Identification of poverty based on nighttime light remote sensing data: A case study on contiguous special poverty-stricken areas in Liupan Mountains
Dan SHEN1,2, Liang ZHOU1,2,3(), Peian WANG1,2
1.College of Mapping and Geographic Information, Lanzhou Jiaotong University, Lanzhou 730070, China 2.Gansu Provincial Engineering Laboratory for National Geographic State Monitoring, Lanzhou 730070, China 3.Institute of Geographic Sciences and Natural Resources Research, Chinese Academy of Sciences, Beijing 100101, China
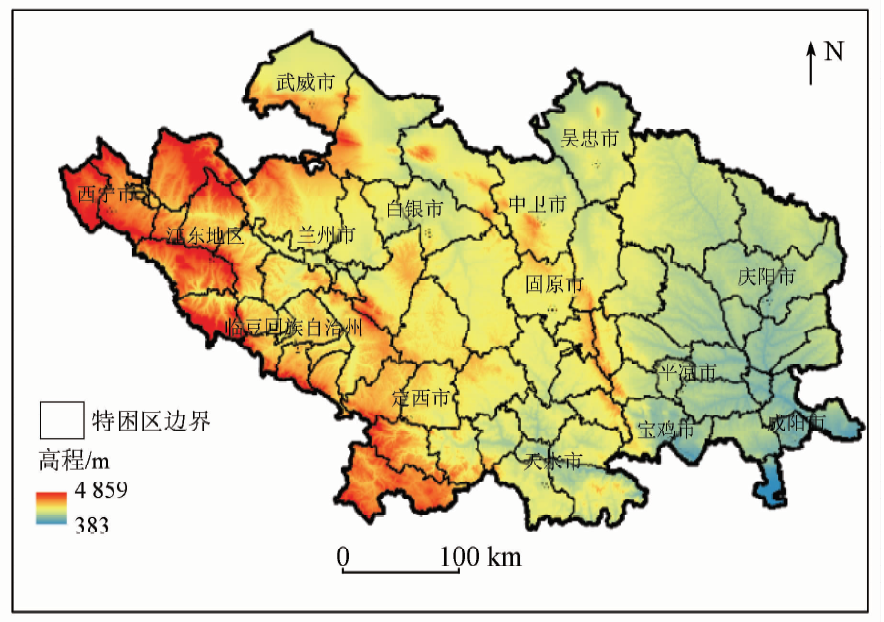
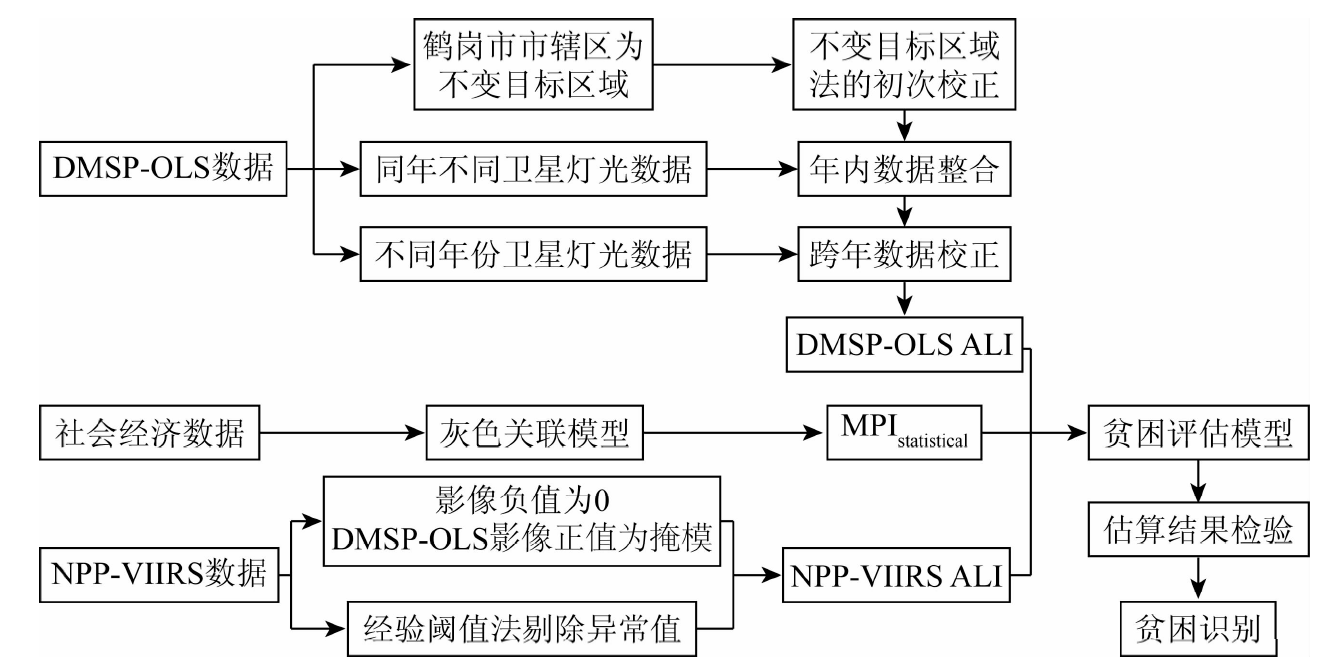
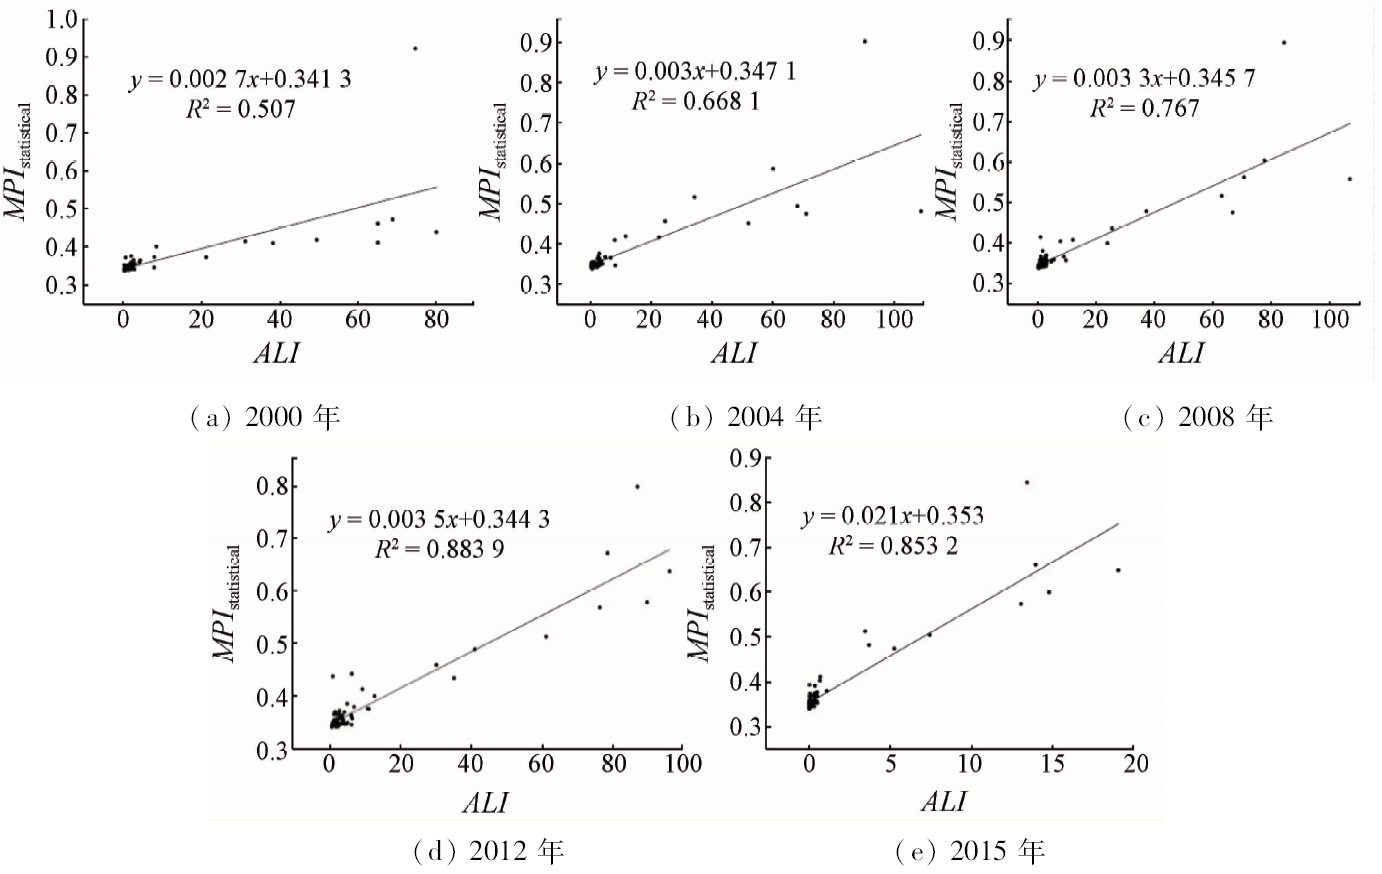
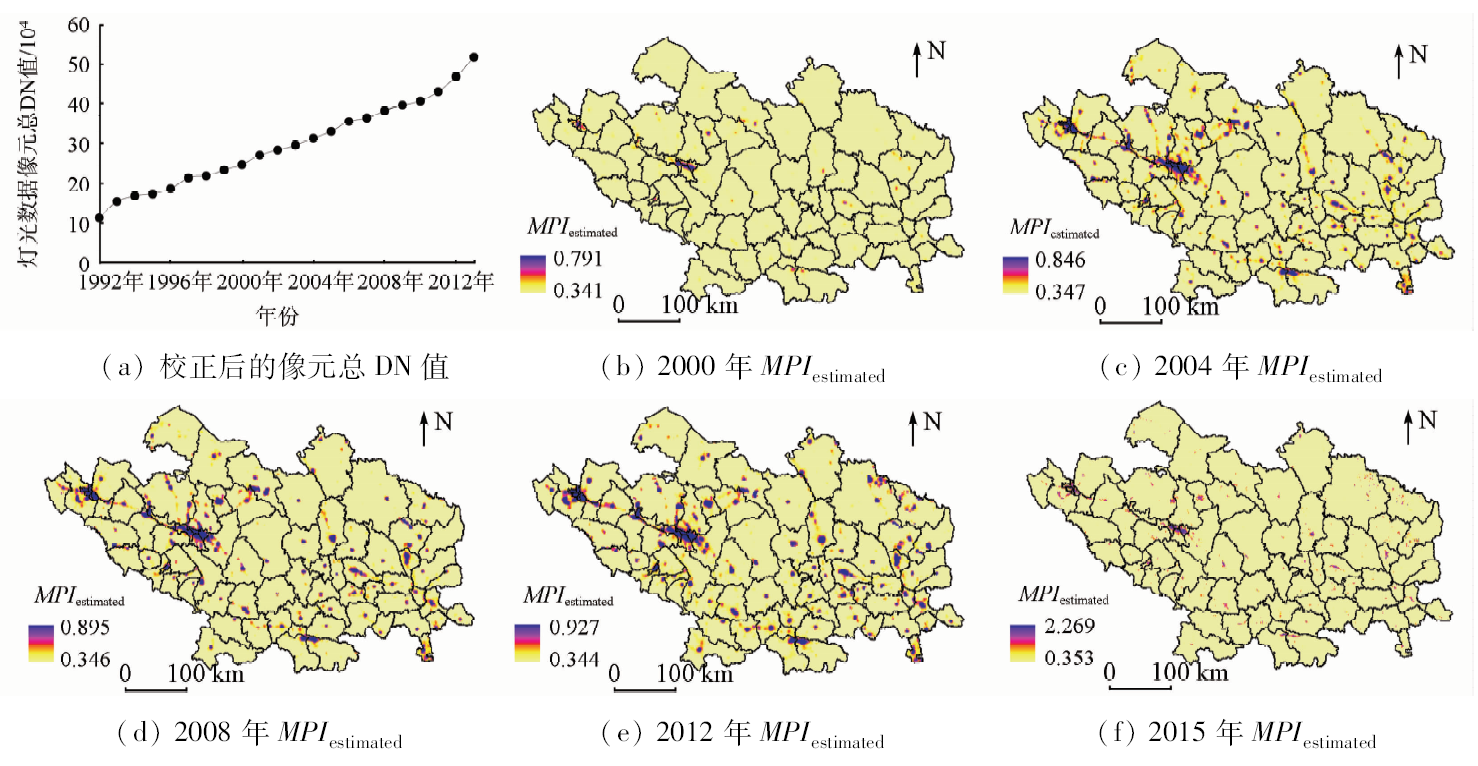
In the process of targeted poverty alleviation, the problems that traditional data statistic aperture is not unified and that nighttime light data for identifying poverty is studied in a short time usually exist. With Liupan Mountain as an example, the average light index and multidimensional poverty index (MPIstatistical) indices were constructed by using the method of invariant target area and gray relational model with the help of night light and socio-economic statistics. Poverty estimation models were constructed through average light index and MPIstatistics. MPIestimation was generated and used to explore long-term sequence of poverty identification. Some conclusions have been reached: the accuracy of poverty results based on nighttime light image was higher, which can reflect the real poverty degree of the region, and the relative error ranges between 3.14% and 3.52%. The MPI estimated averages of the contiguous special poverty areas respectively are 0.346, 0.353, 0.353, 0.357 and 0.358 in many years. The level of poverty has been reduced year by year. Between 2000 and 2012, there were 3946 counties with extremely poor conditions and 2021 counties with highly poor conditions. The Moran’s I index from 2000 to 2015 respectively were 0.49, 0.45, 0.47, 0.49 and 0.43, indicating that the poverty level in 78 counties exhibits obvious agglomeration. The pattern of poverty is presented with the spatial evolution trend of “relatively less poverty in the eastern and western regions and relatively heavier poverty in the northern and southern regions”.
沈丹, 周亮, 王培安. 基于夜间灯光数据的六盘山连片特困区贫困度识别[J]. 国土资源遥感, 2019, 31(2): 157-163.
Dan SHEN, Liang ZHOU, Peian WANG. Identification of poverty based on nighttime light remote sensing data: A case study on contiguous special poverty-stricken areas in Liupan Mountains. Remote Sensing for Land & Resources, 2019, 31(2): 157-163.
Liu Y H, Xu Y . Geographical identification and classification of multi-dimensional poverty in rural China[J]. Acta Geographica Sinica, 2015,70(6):993-1007.
[2]
Liu Y H, Xu Y . A geographic identification of multidimensional poverty in rural China under the framework of sustainable livelihoods analysis[J]. Applied Geography, 2016,73:62-76.
doi: 10.1016/j.apgeog.2016.06.004
He S J, Zuo J J, Zhu S J , et al. Understanding urban poverty in large Chinese cities using multiple measurements and hierarahical regression models[J]. Human Geography, 2014,29(6):74-80.
[4]
Jean N, Burke M, Xie M , et al. Combining satellite imagery and machine learning to predict poverty[J]. Science, 2016,353(6301):790-793.
doi: 10.1126/science.aaf7894
Zhou L, Xu J G, Lin W , et al. Relationship of terrain relief degree and population economic development and evaluation of development suitability in continuous poor areas:A case study on Qinba of national contiguous special poverty-stricken areas[J]. Mountain Research, 2015,33(6):742-750.
Chen Y F, Wang Y H, Wang X L . Measurement and spatial analysis of poverty-stricken villages in China[J]. Geographical Research, 2016,35(12):2298-2308.
Tian Y, Xu J, Ma X F . Multidimensional poverty measurement and spatial distribution of contiguous special poverty-stricken areas:A case study on key city in Wuling Mountain area of poverty alleviation[J]. Economic Geography, 2017,37(1):162-169.
Yang Z, Jiang Q, Liu H M , et al. Multi-dimensional poverty measure and spatial pattern of China’s rural residents[J]. Economic Geography, 2015,35(12):148-153.
[9]
Noor A M, Alegana V A, Gething P W , et al. Using remotely sensed night-time light as a proxy for poverty in Africa[J]. Population Health Metrics, 2008,6(1):1-13.
doi: 10.1186/1478-7954-6-1
[10]
Elvidge C D, Sutton P C, Ghosh T , et al. A global poverty map derived from satellite data[J]. Computers and Geosciences, 2009,35(8):1652-1660.
doi: 10.1016/j.cageo.2009.01.009
[11]
Wang W, Cheng H, Zhang L . Poverty assessment using DMSP/OLS night-time light satellite imagery at a provincial scale in China[J]. Advances in Space Research, 2012,49(8):1253-1264.
doi: 10.1016/j.asr.2012.01.025
[12]
Yu B L, Shi K F, Hu Y J , et al. Poverty evaluation using NPP-VIIRS nighttime light composite data at the county level in China[J]. IEEE Journal of Selected Topics in Applied Earth Observations and Remote Sensing, 2015,8(3):1217-1229.
Pan J H, Hu Y X . Spatial identification of multidimensional poverty in China based on nighttime light remote sensing data[J]. Economic Geography, 2016,36(11):125-131.
Cao Z Y, Wu Z F, Kuang Y Q , et al. Correction of DMSP/OLS night-time light images and its application in China[J]. Journal of Geo-Information Science, 2015,17(9):1093-1102.
Li F, Mi X N, Liu J , et al. Spatialization of GDP in Beijing using NPP-VIIRS data[J]. Remote Sensing for Land and Resources, 2016,28(3):19-24.doi: 10.6046/gtzyyg.2016.03.04.
Ding J J . Comparative analysis on poverty degree of China’s 11 contiguous destitute areas:With view of comprehensive development index[J]. Scientia Geographica Sinica, 2014,34(12):1418-1427.
Li Z G, Hu D Y, Li J H , et al. Simulation and spatialization of GDP in poverty areas based on night light imagery[J]. Remote Sensing for Land and Resources, 2016,28(2):168-174.doi: 10.6046/gtzyyg.2016.02.26.
 2019, Vol. 31
  ), 王培安1,2