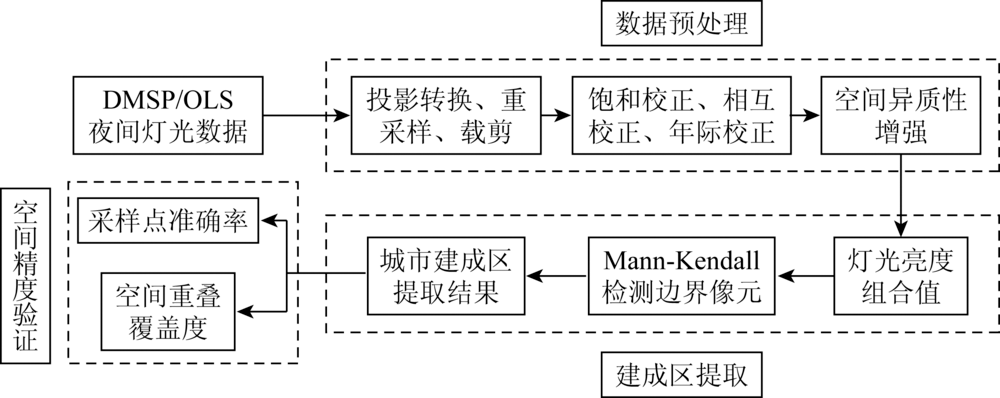
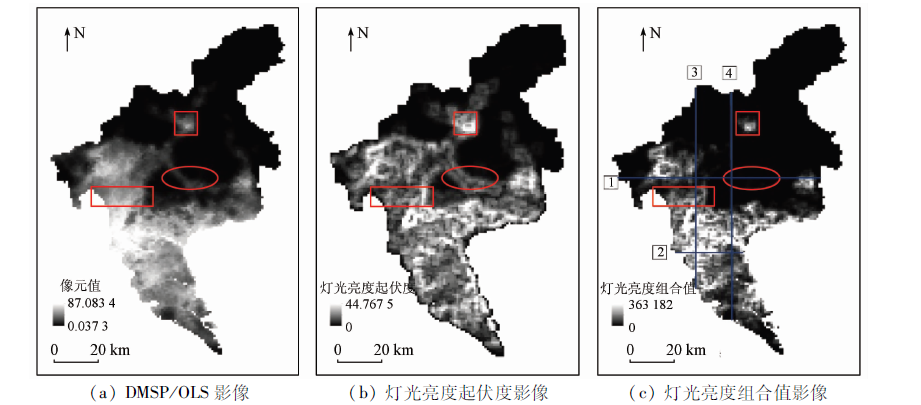
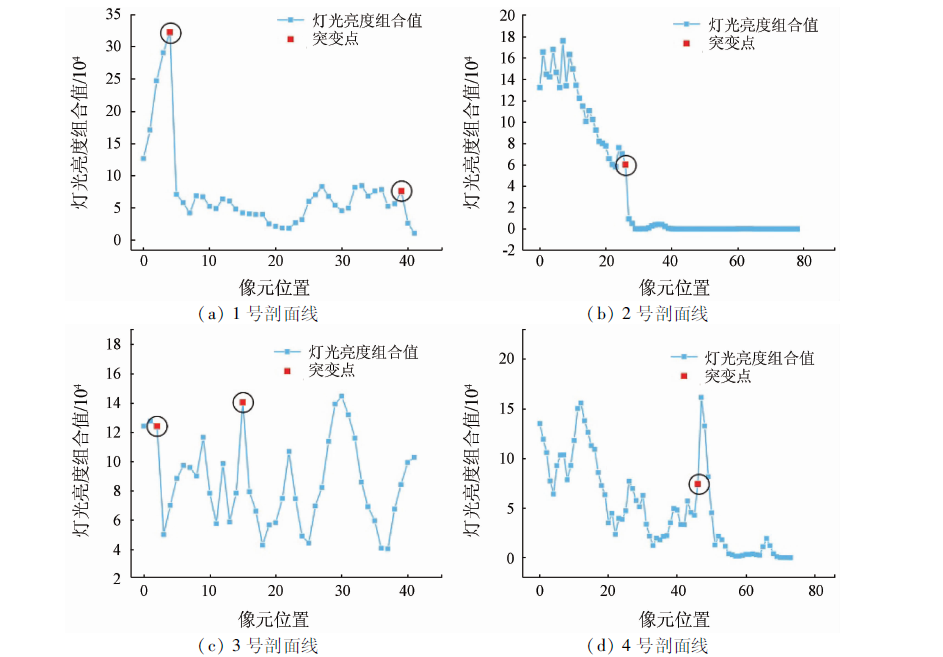
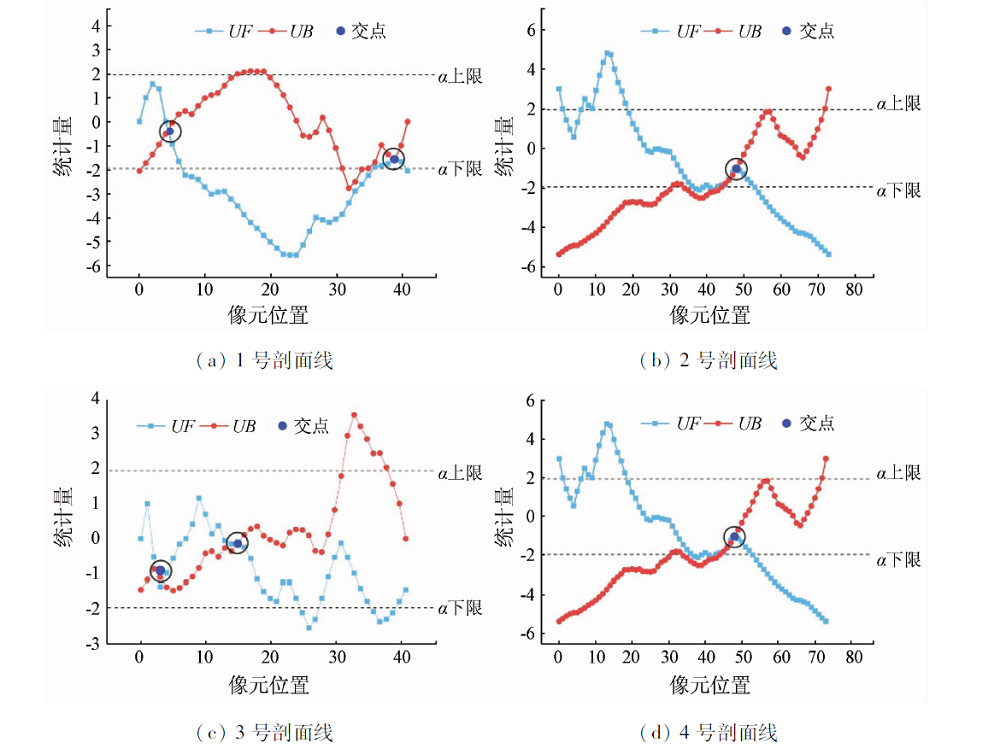
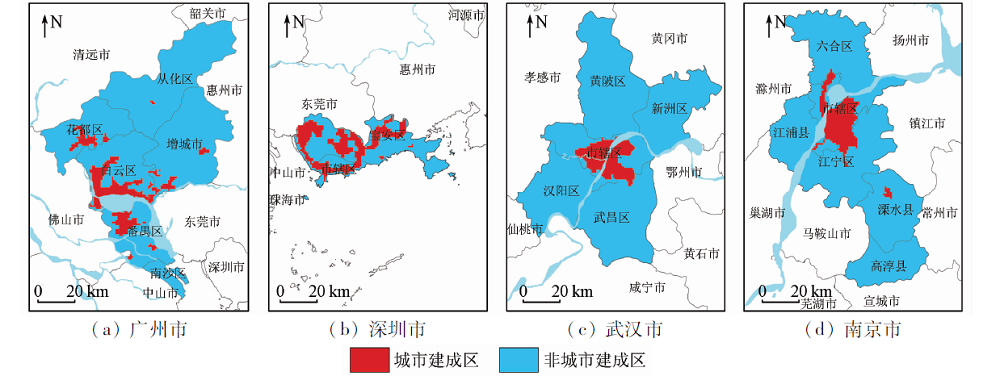
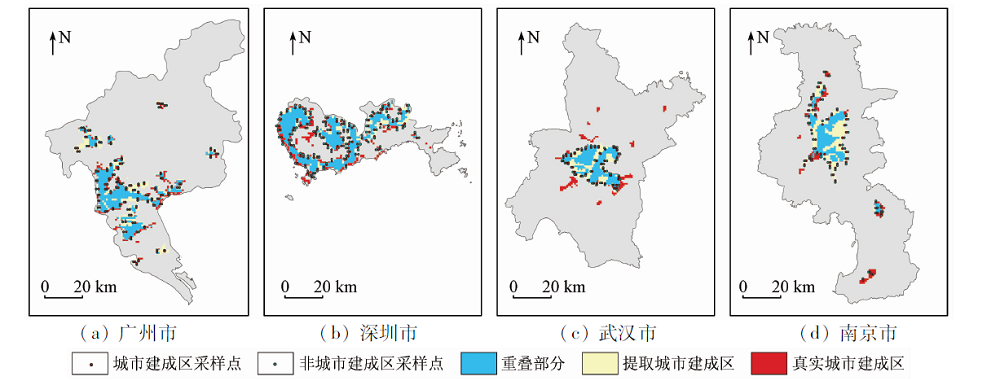
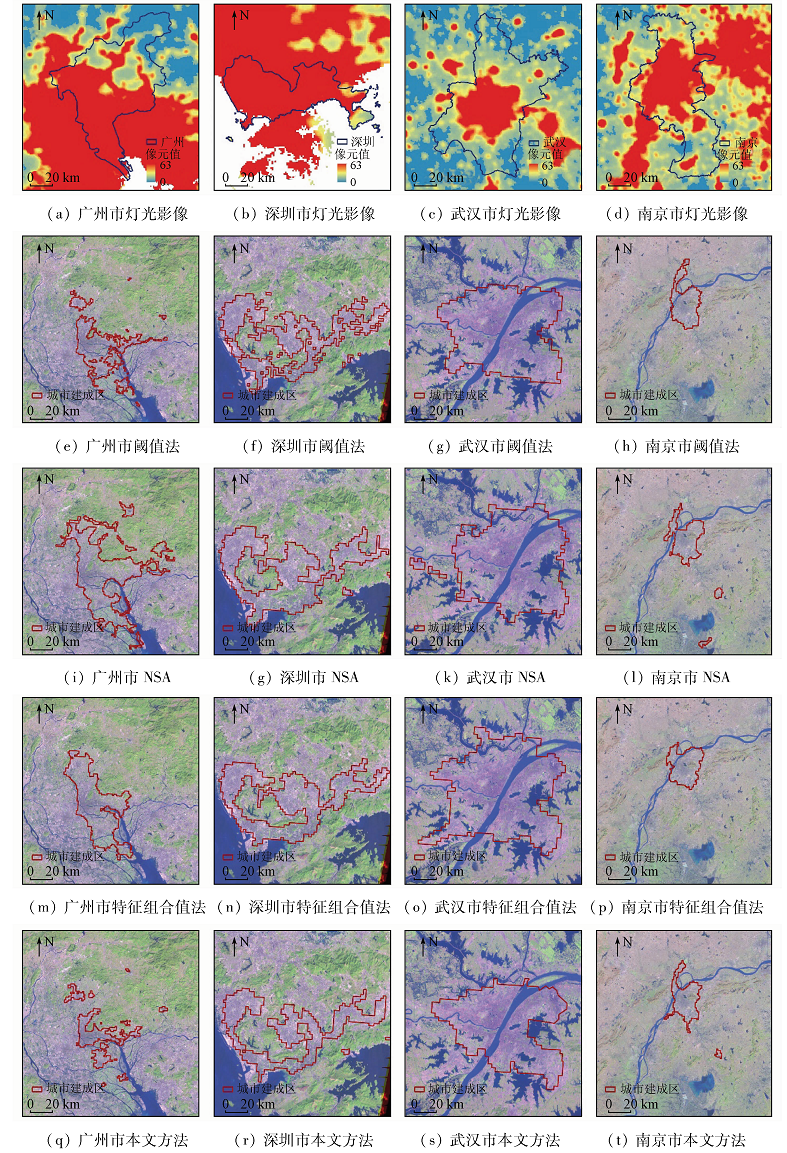
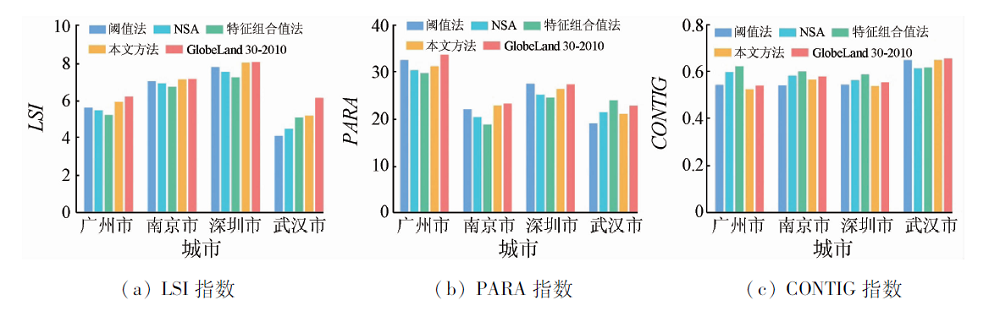
The saturation and overflow effects of DMSP/OLS data tend to misclassified the boundary pixels between urban built-up and non-urban built-up areas as urban built-up areas, which will affect the extraction accuracy of urban built-up areas. This paper proposed an urban built-up area extraction method based on the combination value of light brightness. By determining the accurate boundary location between built-up and non-built-up area, the authors tried to improve the extraction accuracy of built-up area. First, the combination of the brightness of the light is constructed to highlight the difference between the urban built-up and the non-urban built-up area. Second, the Mann-Kendall non-parametric test method is used to determine the change-point of the combination value of light brightness of adjacent pixels, which is used as edge pixel to identify urban built-up area. The relevant experiments were carried out in Guangzhou, Shenzhen, Wuhan and Nanjing. The results show that, the average area error is only 10.89%, the average coverage of spatial overlap is 84.93%, the kappa coefficient is 0.863 0, and the overall accuracy is 91.68%. Compared with threshold method, NSA and feature combination method, this method can reach the highest extraction accuracy, and hence the authors provide an effective and reliable method for extracting urban built-up area based on nighttime light data.
杨艺, 孙文彬, 韩亚辉. 基于DMSP/OLS灯光亮度组合值的城市建成区提取方法[J]. 国土资源遥感, 2020, 32(3): 39-48.
YANG Yi, SUN Wenbin, HAN Yahui. Extraction method of urban built-up area based on light brightness combination value of DMSP/OLS. Remote Sensing for Land & Resources, 2020, 32(3): 39-48.
Zhuo L, Zhang X F, Zheng J, et al. An EVI-based method to reduce saturation of DMSP/OLS nighttime light data[J]. Journal of Geography, 2015,70(8):1339-1350.
[4]
Elvidge C D, Imhoff M L, Baugh K E, et al. Night-time lights of the world:1994—1995[J]. ISPRS Journal of Photogrammetry and Remote Sensing, 2001,56(2):81-99.
doi: 10.1016/S0924-2716(01)00040-5
Zou J G, Chen Y H, Tian J, et al. Construction of DMSP/OLS nighttime light image correction model based on ArcGIS[J]. Mapping Geographic Information, 2014,39(4):33-37.
[6]
Elvidge C, Baugh K, Hobson V, et al. Satellite inventory of human settlements using nocturnal radiation emissions:A contribution for the global toolchest[J]. Global Change Biology, 1997,3(5):387-395.
doi: 10.1046/j.1365-2486.1997.00115.x
[7]
Elvidge C D, Baugh K E, Anderson S J, et al. The night light development index (NLDI):A spatially explicit measure of human development from satellite data[J]. Social Geography & Discussions, 2012,7(1):23-35.
doi: 10.5194/sg-7-23-2012
[8]
Small C, Pozzi F, Elvidge C D. Spatial analysis of global urban extent from DMSP-OLS night lights[J]. Remote Sensing of Environment, 2005,96(34):277-291.
doi: 10.1016/j.rse.2005.02.002
[9]
Liu Z, He C, Zhang Q, et al. Extracting the dynamics of urban expansion in China using DMSP-OLS nighttime light data from 1992 to 2008[J]. Landscape and Urban Planning, 2012,106(1):62-72.
doi: 10.1016/j.landurbplan.2012.02.013
[10]
Zhou Y, Smith S J, Elvidge C D, et al. A cluster-based method to map urban area from DMSP/OLS nightlights[J]. Remote Sensing of Environment, 2014,147:173-185.
doi: 10.1016/j.rse.2014.03.004
[11]
Zhang Q, Seto K C. Mapping urbanization dynamics at regional and global scales using multi-temporal DMSP/OLS nighttime light data[J]. Remote Sensing of Environment, 2011,115(9):2320-2329.
doi: 10.1016/j.rse.2011.04.032
[12]
Xie Y, Weng Q. Updating urban extents with nighttime light imagery by using an object-based thresholding method[J]. Remote Sensing of Environment, 2016,187:1-13.
doi: 10.1016/j.rse.2016.10.002
[13]
Ma T, Zhou C, Pei T, et al. Quantitative estimation of urbanization dynamics using time series of DMSP/OLS nighttime light data:A comparative case study from China’s cities[J]. Remote Sensing of Environment, 2012,124:99-107.
doi: 10.1016/j.rse.2012.04.018
[14]
Liu Y, Delahunty T, Zhao N, et al. These lit areas are undeveloped:Delimiting China’s urban extents from thresholded nighttime light imagery[J]. International Journal of Applied Earth Observation and Geoinformation, 2016,50:39-50.
doi: 10.1016/j.jag.2016.02.011
Shu S, Yu B L, Wu J P, et al. Evaluation and application of urban built-up area extraction method based on night lighting data[J]. Remote Sensing Technology and Applications, 2011,26(2):169-176.
Li J Y, Gong J, Yang J X, et al. Evolution of urban spatial pattern in Wuhan using night light data[J].Remote Sensing Information 2017(3):133-141.
[17]
Huang X M, Annemarie Schneider, Mark AFriedl, et al. Mapping sub-pixel urban expansion in China using MODIS and DMSP/OLS nighttime lights[J]. Remote Sensing of Environment, 2016,175:92-108.
doi: 10.1016/j.rse.2015.12.042
[18]
Ma X L, Tong X H, Liu S C, et al. Optimized sample selection in SVM classification by combining with DMSP-OLS,Landsat NDVI and GlobeLand30 products for extracting urban built-up areas[J]. Remote Sensing, 2017,9(3):236-251.
doi: 10.3390/rs9030236
[19]
Imhoff M L, Lawrence W T, Stutzer D C, et al. A technique for using composite DMSP/OLS “City Lights” satellite data to map urban area[J]. Remote Sensing of Environment, 1997,61(3):361-370.
doi: 10.1016/S0034-4257(97)00046-1
[20]
Lu D, Tian H, Zhou G, et al. Regional mapping of human settlements in Southeastern China with multi-sensor remotely sensed data[J]. Remote Sensing of Environment, 2008,112(9):3668-3679.
doi: 10.1016/j.rse.2008.05.009
[21]
Zhao N, Zhou Y, Samson E L. Correcting incompatible DN values and geometric errors in nighttime lights time-series images[J]. IEEE Transactions on Geoscience and Remote Sensing, 2015,53(4):2039-2049.
doi: 10.1109/TGRS.2014.2352598
Cao Z Y, Wu Z F, Kuang Y Q, et al. Correction and application of DMSP/OLS night lighting image in China[J]. Journal of Geo-Information Science, 2015,17(9):1092-1102.
[23]
Zhao M, Cheng W M, Zhou C H, et al. Assessing spatiotemporal characteristics of urbanization dynamics in Southeast Asia using time series of DMSP/OLS nighttime light data[J]. Remote Sensing, 2018,10(2):47-66.
doi: 10.3390/rs10010047
Zhang Z G, Zhang A M, Guo H H. Research on spatial recognition of urban-rural junction based on DMSP/OLS night light data:Take the main urban area of Chongqing as an example[J].Geographic and Geographic Information Science 2016(6):37-42.
[25]
Su Y X, Chen X Z, Wang C Y, et al. A new method for extracting built-up urban areas using DMSP-OLS nighttime stable lights:A case study in the Pearl River Delta,southern China[J]. GIScience & Remote Sensing, 2015,52(2):218-238.
Zhang S L, Deng G Y, Huang Y Q. Mann-Kendall implementation and application of test method in Excel[EB/OL].Beijing:China Science and Technology Paper Online[2014-06-27]. http://www.paper.edu.cn/releasepaper/content/201406-448.
[27]
汪攀. 时间序列趋势分析及其在预防性维修中的应用[D]. 武汉:武汉科技大学, 2015.
Wang P. Time series trend analysis and its application in preventive maintenance[D]. Wuhan:Wuhan University of Science and Technology, 2015.
Song J C, Li X H, Wei T, et al. Extraction and analysis of urban built-up areas based on night lighting data and Google Earth[J]. Journal of Earth Information Science, 2015,17(6):750-756.
He C Y, Shi P J, Li J G, et al. Research on the spatial process reconstruction of urbanization in mainland China in 1990s based on DMSP/OLS night lighting data and statistical data[J]. Scientific Bulletin, 2006,51(7):856-861.
 2020, Vol. 32
  ), 孙文彬(