Please wait a minute...
 
国土资源遥感  2021, Vol. 33 Issue (1): 191-198    DOI: 10.6046/gtzyyg.2020083
     技术应用 本期目录 | 过刊浏览 | 高级检索 |
土地生态质量遥感评价模型与主控因子研究——以广安市为例
陈震(), 夏学齐, 陈建平
中国地质大学(北京)地球科学与资源学院,北京 100083
A study of remote sensing evaluation model and main controlling factors of land ecological quality:A case study of Guang’an City
CHEN Zhen(), XIA Xueqi, CHEN Jianping
School of Earth Sciences and Resources, China University of Geosciences (Beijing), Beijing 100083, China
全文: PDF(3993 KB)   HTML  
输出: BibTeX | EndNote (RIS)      
摘要 

为了科学评价土地生态质量以及有效识别土地生态主控因子,开展土地生态质量遥感评价模型与主控因子研究,以四川省广安市为研究区,建立基于理想点的遥感评价模型,对广安市2000年、2005年、2010年和2015年的土地生态质量进行评价及主控因子分析; 以公里网格为评价单元,以生态本底、生态结构、生态效益及生态胁迫4个准则层的14个评价指标构建评价指标体系; 应用德尔菲法和熵权法(即主观结合客观的方法)计算各评价指标权重值,以理想点模型计算理想点值、划分理想点生态等级,利用主成分分析法获取各年份的主控因子,然后对理想点生态等级空间分布与环境影响因子之间的关系进行分析。结果表明: 2005—2015年第3等级面积占比有一定幅度上升,第3等级面积占比为各等级最大,因而广安市土地生态质量整体上呈上升趋势、林地面积占比和气温因子是最重要的主控因子、气温与土地生态质量正相关等研究结果。研究结果可为土地整治部门提出广安市土地生态质量监管的决策依据和技术支持,也可对其他地区的土地生态质量监管工作提供借鉴。

服务
把本文推荐给朋友
加入引用管理器
E-mail Alert
RSS
作者相关文章
陈震
夏学齐
陈建平
关键词 土地生态质量生态评价指标理想点模型主控因子主成分分析    
Abstract

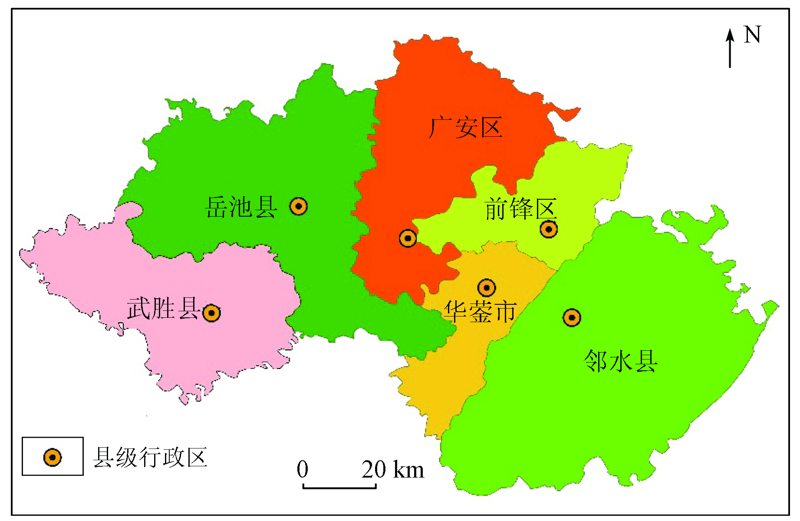
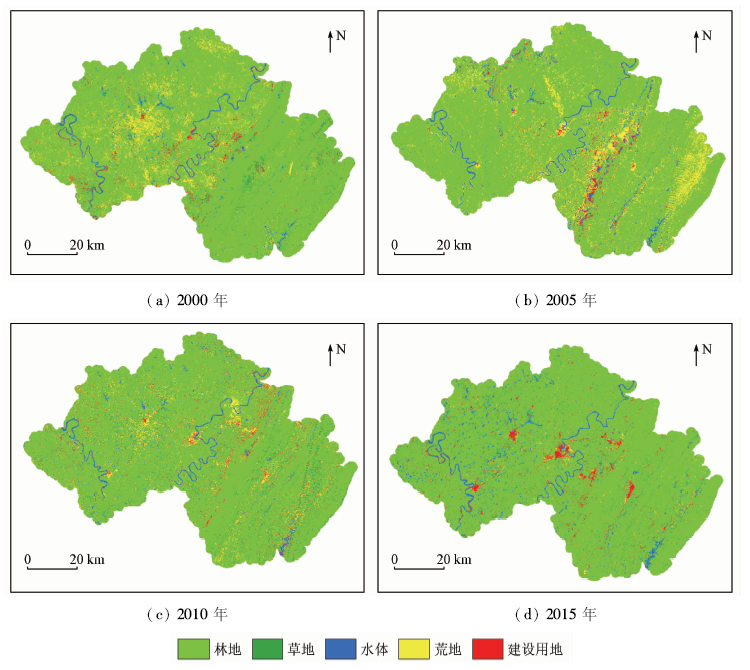
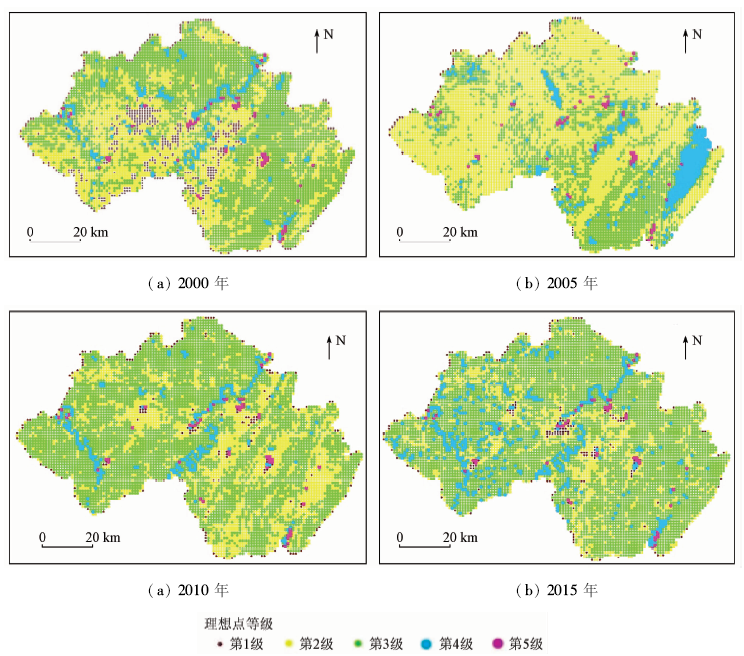
In order to scientifically evaluate the ecological quality of the land and effectively identify the main controlling factors of the land ecology, the authors established a remote sensing evaluation model based on ideal points in Guang’an which served as a research area, evaluated the ecological quality of the land in Guang’an in 2000, 2005, 2010 and 2015, and analyzed the main controlling factors. A kilometer grid was used as the evaluation unit. The evaluation index system was constructed based on the fourteen evaluation criteria in the four criterion layers, i.e., ecological background, ecological structure, ecological benefits and ecological stress. The evaluation index system was constructed by applying Delphi method and entropy weight method. The weight value of each evaluation index and the ideal point values were calculated by using the ideal point model, and the ideal point level was divided. The principal factor analysis method was used to obtain the main control factors of each year, and then the relationship between the spatial distribution of the ideal point level and the environmental impact factor was performed. Through research, the authors obtained the overall upward trend of land ecological quality in Guang’an City. It is shown that the proportion of land ecological quality at various levels of area and spatial distribution and the proportion of forest land area and temperature factor are the most important main control factors, and the proportion of woodland and the temperature are positively related to the land ecological quality. After analysis, the suggestions on land ecological quality supervision in Guang’an City are put forward. which can provide references for land ecological quality supervision in other areas.

Key wordsland ecological quality    ecological evaluation index    ideal point model    main controlling factor    principal component analysis
收稿日期: 2020-03-27      出版日期: 2021-03-18
ZTFLH:  TP79  
基金资助:中国地质调查局项目“土地生态环境与自然性状调查”子项目“四川广安耕地区土地质量地球化学调查”资助(DD20190524-06)
作者简介: 陈 震(1977-),男,博士,讲师,主要从事地球探测与信息技术、遥感地质、遥感土地生态评价等方面的研究。Email: 1186549418@qq.com
引用本文:   
陈震, 夏学齐, 陈建平. 土地生态质量遥感评价模型与主控因子研究——以广安市为例[J]. 国土资源遥感, 2021, 33(1): 191-198.
CHEN Zhen, XIA Xueqi, CHEN Jianping. A study of remote sensing evaluation model and main controlling factors of land ecological quality:A case study of Guang’an City. Remote Sensing for Land & Resources, 2021, 33(1): 191-198.
链接本文:  
https://www.gtzyyg.com/CN/10.6046/gtzyyg.2020083      或      https://www.gtzyyg.com/CN/Y2021/V33/I1/191
Fig.1  广安市行政图
年份 森林 草地 水体 荒地 建设用地
2000年 79.07 6.68 2.55 9.75 1.95
2005年 82.99 0.26 3.56 11.43 1.76
2010年 79.33 8.65 2.75 6.42 2.85
2015年 85.79 4.44 4.39 1.84 3.54
Tab.1  2000年、2005年、2010年和2015年各土地利用类型占比
Fig.2  2000年、2005年、2010年、2015年研究区土地分类
准则层 评价指标
生态本底 年均降水量、年均气温、植被指数、GPP、地形
生态结构 林地占比、草地占比、水体占比、裸地占比、建设用地占比
生态效益 生态服务价值
生态胁迫 GDP、人口密度、夜间灯光
Tab.2  土地生态质量遥感评价指标体系
Fig.3  2000年、2005年、2010年和2015年理想点等级
生态等级 2000年 2005年 2010年 2015年
第1级 7.07 1.25 2.76 2.61
第2级 33.79 56.52 28.60 17.04
第3级 54.84 34.74 64.59 72.41
第4级 3.42 6.61 3.22 7.13
第5级 0.81 0.83 0.76 0.71
Tab.3  4个时相各生态等级评价单元数量占比
主控因子 第1主成分 第2主成分 第3主成分
地形(-) -0.308 07 -0.026 89 -0.342 47
人口(-) -0.520 77 -0.338 18 -0.716 06
GDP(-) -0.424 16 -0.243 47 -0.569 85
灯光(-) -0.329 16 -0.154 92 -0.482 63
气温(+) 0.595 20 0.562 66 0.544 18
NDVI(+) 0.433 00 0.306 73 -0.123 04
降水(+) 0.482 34 0.426 82 0.288 68
GPP(+) -0.844 80 -0.569 17 -1.084 96
林地占比(+) 2.955 60 -0.599 57 -0.172 50
草地占比(+) -0.600 23 0.175 69 -0.762 56
水体占比(+) -0.695 58 -1.952 64 2.563 03
荒地占比(+) -0.399 69 2.579 52 1.348 87
建筑用地占比(-) -0.343 67 -0.166 58 -0.490 69
Tab.4  2000年主控因子
主控因子 第1主成分 第2主成分 第3主成分
地形(-) 0.336 04 -0.333 25 1.884 00
人口(-) -0.336 63 -0.240 46 0.412 78
主控因子 第1主成分 第2主成分 第3主成分
GDP(-) 0.215 26 -0.319 19 1.442 95
灯光(-) -0.071 25 -0.289 97 0.836 87
气温(+) 2.581 45 -0.147 24 -0.860 66
NDVI(+) -0.394 08 -0.349 28 0.012 99
降水(+) 1.390 53 -0.139 22 -0.949 99
GPP(+) -0.883 23 -0.240 13 -1.551 93
林地占比(+) -0.211 71 0.464 05 0.333 61
草地占比(+) -0.862 01 -0.087 26 -0.959 10
水体占占比(+) -0.892 80 -0.247 32 -0.530 70
荒地占比(+) -0.100 58 3.297 76 0.220 05
建筑用地占比(-) -0.770 99 -0.263 21 -0.290 85
Tab.5  2005年主控因子
主控因子 第1主成分 第2主成分 第3主成分
地形(-) -0.315 20 -0.063 57 -0.386 22
人口(-) -0.521 95 -0.052 42 -0.896 30
GDP(-) -0.433 11 -0.07 549 -0.723 02
灯光(-) -0.295 67 -0.061 55 -0.671 06
气温(+) 0.585 50 -0.244 60 0.996 77
NDVI(+) 0.602 72 -0.446 48 0.634 94
降水(+) 0.491 46 -0.276 41 0.736 05
GPP(+) -0.849 94 0.093 58 -1.650 53
林地占比(+) 2.906 75 0.445 09 -0.69 235
草地占比(+) -0.503 90 -1.160 84 0.437 99
水体占比(+) -0.682 32 2.986 16 1.131 55
荒地占比(+) -0.614 83 -1.083 00 1.739 95
建筑用地占比(-) -0.369 50 -0.060 47 -0.657 77
Tab.6  2010年主控因子
主控因子 第1主成分 第2主成分 第3主成分
地形(-) -0.302 46 -0.247 35 0.037 47
人口(-) -0.443 68 -0.416 52 0.302 54
GDP(-) -0.378 95 -0.363 77 0.244 99
灯光(-) -0.268 11 -0.317 80 0.584 07
气温(+) 0.532 44 0.156 52 -1.461 93
NDVI(+) 0.513 35 -0.067 13 -0.423 64
降水(+) 0.493 81 0.029 23 -1.366 81
GPP(+) -0.804 23 -0.539 67 1.890 78
林地占比(+) 2.937 22 -0.105 74 0.921 57
草地占比(+) -0.719 98 -0.533 02 0.016 33
水体占比(+) -0.477 37 3.247 15 0.346 06
荒地占比(+) -0.764 16 -0.513 73 -1.589 99
建筑用地占比(-) -0.317 88 -0.328 19 0.498 56
Tab.7  2015年主控因子
年份 主控因子1 主控因子2 主控因子3
2000年 林地占比 荒地占比 水体占比
2005年 气温 荒地占比 地形
2010年 林地占比 水体占比 荒地占比
2015年 林地占比 水体占比 GPP
Tab.8  2000、2005、2010和2015年主控因子
[1] Pieri C, Dumanski J, Hamblin A, et al. Land quality indicators[J]. World Bank Discussion Papers, 1995,81(2):81.
[2] Messing I, Fagerström M, Chen L D, et al. Criteria for land suitability evaluation in a small catchment on the Loess Plateau in China[J]. Catena, 2003,51(12):215-234.
[3] 张军以, 苏维词, 张凤太. 基于PSR模型的三峡库区生态经济区土地生态安全评价[J]. 中国环境科学, 2011,31(6):1039-1044.
Zhang J Y, Su W C, Zhang F T. Evaluation of land ecological security in the Three Gorges Reservoir ecological economic zone based on PSR model[J]. China Environmental Science, 2011,31(6):1039-1044.
[4] Paracchini M L, Pacini C, Jones M L M, et al. Aggregation framework to link indicators associated with multifunctional land use to the stakehode:Evaluation of options[J]. Ecological Indicators, 2011,1(1):71-80.
[5] 巩芳, 陈宝新. 基于DPSIR模型的草原生态补偿效果综合评价研究——以内蒙古为例[J]. 内蒙古农业大学学报(社会科学版), 2019,21(5):1-6.
Gong F, Chen B X. Research on comprehensive evaluation of grassland ecological compensation based on DPSIR model:Taking Inner Mongolia as an example[J]. Journal of Inner Mongolia Agricultural University (Social Science Edition), 2019,21(5):1-6.
[6] 邹炎平, 朱达, 陈维国, 等. 基于DEA模型下中国各区域环境效率和生态无效效率评价[J]. 湖北大学学报(自然科学版), 2020,42(1):12-19,26.
Zou Y P, Zhu D, Chen W G, et al. Evaluation of environmental efficiency and ecological inefficiency of various regions in China based on DEA model[J]. Journal of Hubei University (Natural Science Edition), 2020,42(1):12-19,26.
[7] 王毅, 魏江超, 孙启元, 等. 基于ARIMA-ANN模型的生态安全评价及预测——以河西走廊城市群为例[J]. 生态学杂志, 2020,39(1):326-336.
Wang Y, Wei J C, Sun Q Y, et al. Evaluation and prediction of ecological security based on ARIMA-ANN model:Taking Hexi Corridor urban agglomeration as an example[J]. Journal of Ecology, 2020,39(1):326-336.
[8] 冯文斌, 李升峰. 江苏省土地生态安全评价研究[J]. 水土保持通报, 2013,33(2):285-290.
Feng W B, Li S F. Research on evaluation of land ecological security in Jiangsu Province[J]. Bulletin of Soil and Water Conservation, 2013,33(2):285-290.
[9] 李玲, 侯淑涛, 赵悦, 等. 基于P-S-R模型的河南省土地生态安全评价及预测[J]. 水土保持研究, 2014,21(1):188-192.
Li L, Hou S T, Zhao Y, et al. Evaluation and prediction of land ecological security in Henan Province based on P-S-R model[J]. Research of Soil and Water Conservation, 2014,21(1):188-192.
[10] 李迎迎, 杨朝现, 信桂新, 等. 土地生态安全动态变化研究[J]. 西南师范大学学报(自然科学版), 2014,39(11):189-195.
Li Y Y, Yang C X, Xin G X, et al. Research on the dynamic changes of land ecological security[J]. Journal of Southwest China Normal University (Natural Science Edition), 2014,39(11):189-195.
[11] 卢立峰, 严力蛟. 县域土地生态安全评价——以四川省丹棱县为例[J]. 生态与农村环境学报, 2013,29(3):295-300.
Lu L F, Yan L J. Evaluation of land ecological security in county areas:Taking Danling County,Sichuan Province as an example[J]. Journal of Ecology and Rural Environment, 2013,29(3):295-300.
[12] 戴靓, 姚新春, 周生路, 等. 长三角经济发达区金坛市土地生态状况评价[J]. 农业工程学报, 2013,29(8):249-257.
Dai L, Yao X C, Zhou S L, et al. Evaluation of the ecological status of land in Jintan City,an economically developed area of the Yangtze River Delta[J]. Transactions of the Chinese Society of Agricultural Engineering, 2013,29(8):249-257.
[13] 于勇, 周大迈, 王红, 等. 土地资源评价方法及评价因素权重的确定探析[J]. 中国生态农业学报, 2006(2):213-215.
Yu Y, Zhou D M, Wang H, et al. Analysis of land resource evaluation method and determination of evaluation factor weight[J]. Chinese Journal of Eco-Agriculture, 2006(2):213-215.
[14] 郭岐峰, 王清礼, 蓝鸿第. 生态系统熵的初步研究[J]. 辽宁气象, 1992(4):9-10.
Guo Q F, Wang Q L, Lan H D. Preliminary research on ecosystem entropy[J]. Liaoning Meteorology, 1992(4):9-10.
[15] 王清源, 潘旭海. 熵权法在重大危险源应急救援评估中的应用[J]. 南京工业大学学报(自然科学版), 2011,33(3):87-92.
Wang Q Y, Pan X H. Application of entropy weight method in emergency rescue assessment of major hazard sources[J]. Journal of Nanjing University of Technology (Natural Science Edition), 2011,33(3):87-92.
[16] 黄辉玲, 罗文斌, 吴次芳, 等. 基于物元分析的土地生态安全评价[J]. 农业工程学报, 2010,26(3):316-322.
Huang H L, Luo W B, Wu C F, et al. Evaluation of land ecological security based on matter element analysis[J]. Transactions of the Chinese Society of Agricultural Engineering, 2010,26(3):316-322.
[1] 梁锦涛, 陈超, 张自力, 刘志松. 一种融合指数与主成分分量的随机森林遥感图像分类方法[J]. 自然资源遥感, 2023, 35(3): 35-42.
[2] 孙肖, 彭军还, 赵锋, 王晓阳, 吕洁, 张登峰. 基于空间统计学的高光谱遥感影像主成分选择方法[J]. 自然资源遥感, 2022, 34(2): 37-46.
[3] 秦大辉, 杨灵, 谌伦超, 段云飞, 贾宏亮, 李贞培, 马建琴. 基于多源数据的新疆干旱特征及干旱模型研究[J]. 自然资源遥感, 2022, 34(1): 151-157.
[4] 张秦瑞, 赵良军, 林国军, 万虹麟. 改进遥感生态指数的宜宾市三江汇合区生态环境评价[J]. 自然资源遥感, 2022, 34(1): 230-237.
[5] 魏英娟, 刘欢. 北衙金矿床遥感矿化蚀变信息提取及找矿预测[J]. 自然资源遥感, 2021, 33(3): 156-163.
[6] 木哈代思·艾日肯, 张飞, 刘康, 阿依努尔·玉山江. 基于天宫二号及Landsat8城镇生态环境现状评价[J]. 国土资源遥感, 2020, 32(4): 209-218.
[7] 姚本佐, 何芳. 空谱特征分层融合的高光谱图像特征提取[J]. 国土资源遥感, 2019, 31(3): 59-64.
[8] 阿茹罕, 何芳, 王标标. 加权空-谱主成分分析的高光谱图像分类[J]. 国土资源遥感, 2019, 31(2): 17-23.
[9] 董立新. 三峡库区森林叶面积指数多模型遥感估算[J]. 国土资源遥感, 2019, 31(2): 73-81.
[10] 涂兵, 张晓飞, 张国云, 王锦萍, 周瑶. 递归滤波与KNN的高光谱遥感图像分类方法[J]. 国土资源遥感, 2019, 31(1): 22-32.
[11] 尹凌宇, 覃先林, 孙桂芬, 刘树超, 祖笑锋, 陈小中. 利用KPCA法检测高分一号影像中的森林覆盖变化[J]. 国土资源遥感, 2018, 30(1): 95-101.
[12] 张洪敏, 张艳芳, 田茂, 吴春玲. 基于主成分分析的生态变化遥感监测——以宝鸡市城区为例[J]. 国土资源遥感, 2018, 30(1): 203-209.
[13] 张倩宁, 谭诗腾, 徐柱, 黄泽纯. 基于GLC30数据的斑块级别景观指标适用性及简化研究[J]. 国土资源遥感, 2017, 29(4): 98-105.
[14] 邓曾, 李丹, 柯樱海, 吴燕晨, 李小娟, 宫辉力. 基于改进SVM算法的高分辨率遥感影像分类[J]. 国土资源遥感, 2016, 28(3): 12-18.
[15] 成功, 朱佳玮, 毛先成. 基于ASTER数据的金川铜镍矿床外围遥感找矿预测[J]. 国土资源遥感, 2016, 28(1): 15-21.
Viewed
Full text


Abstract

Cited

  Shared   
  Discussed   
京ICP备05055290号-2
版权所有 © 2015 《自然资源遥感》编辑部
地址:北京学院路31号中国国土资源航空物探遥感中心 邮编:100083
电话:010-62060291/62060292 E-mail:zrzyyg@163.com
本系统由北京玛格泰克科技发展有限公司设计开发