Please wait a minute...
 
国土资源遥感  2021, Vol. 33 Issue (2): 124-133    DOI: 10.6046/gtzyyg.2020210
  技术应用 本期目录 | 过刊浏览 | 高级检索 |
基于多光谱遥感的盐渍化评价指数对宁夏银北灌区土壤盐度预测的适用性分析
吴霞(), 王长军, 樊丽琴, 李磊
宁夏农林科学院农业资源与环境研究所,银川 750002
An applicability analysis of salinization evaluation index based on multispectral remote sensing to soil salinity prediction in Yinbei irrigation area of Ningxia
WU Xia(), WANG Zhangjun, FAN Liqin, LI Lei
Institute of Agricultural Resources and Environment, Ningxia Academy of Agriculture and Forestry Science, Yinchuan 750002, China
全文: PDF(1927 KB)   HTML  
输出: BibTeX | EndNote (RIS)      
摘要 

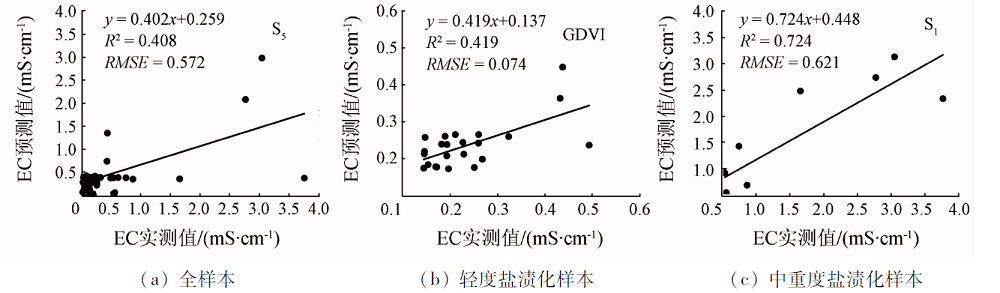
土壤盐渍化是影响干旱区土壤健康的重要因素之一,因此快速获取土壤盐度信息、监测土壤盐度变化对干旱区土地资源合理利用和土壤恢复至关重要。本研究选取宁夏平原土壤盐渍化较重的银北灌区为研究区域,以野外采集的52个土壤样本和同时期Landsat8 OLI遥感影像为数据基础,采用相关分析和曲线回归分析法对基于多光谱遥感数据构建的土壤盐渍化评价指数与实测土壤电导率(electrical conductivity,EC)的相关关系和拟合度进行了定量化分析。结果表明: ①采样时期研究区土壤盐度较轻,非盐渍化和轻度盐渍化土壤样本合计占比82.68%; ②盐度指数与土壤EC的相关性整体高于植被指数,全样本中盐分指数S3(salinity index 3,S3)、盐分指数S5(salinity index 5,S5)、盐分指数S6(salinity index 6,S6)和盐分指数SI(salinity index,SI)与土壤EC的相关性均达到0.50以上; ③全样本中与土壤EC拟合度较高的为盐分指数S2(salinity index 2,S2),S3,S5和SI,其中S5的表现最好(R2=0.406),不同盐度水平下指数与土壤EC的拟合度随土壤盐度升高而显著增加,中重度盐渍化中指数与土壤EC的拟合度最高的为指数S1(salinity index 1,S1)(R2=0.730)和S2(R2=0.724); ④拟合模型中,基于Cubic模型、Quadratic模型和S模型计算的评价指数与土壤EC的拟合度较高。本研究分析了多种土壤盐渍化评价指数在银北灌区土壤盐度监测中的适用性,得出的初步结论可为宁夏银北灌区土壤盐度遥感监测提供参考依据。

服务
把本文推荐给朋友
加入引用管理器
E-mail Alert
RSS
作者相关文章
吴霞
王长军
樊丽琴
李磊
关键词 土壤盐渍化盐分指数植被指数曲线拟合Landsat    
Abstract

Soil salinization is one of the important factors that affect the soil health in the arid area, so it is very important to obtain the information of soil salinity and monitor the change of soil salinity for the rational use of land resources and soil restoration in the arid area. Based on 52 soil samples collected in the field and Landsat 8 OLI remote sensing images obtained at the same time, the correlation and curve regression analysis were used to quantitatively analyze the correlation and fitting degree between the soil salinization evaluation index based on multispectral remote sensing data and the measured soil Electrical Conductivity (EC). The results are as follows: ① The soil salinity in the study area is relatively light, and the total proportion of non-salinized and slightly salinized soil samples is 82.68%; ② The correlation between salinity index and soil EC is higher than that of vegetation index. The correlation between salinity index S3 (S3), salinity index S5 (S5), salinity index S6 (salinity index, S6) and salinity index Si (salinity index, SI) is above 0.50; ③ Salinity indexes S2 (S2), S3, S5 and Si have the highest fitting degree with soil EC in the whole sample, among which S5 has the best performance (R2 = 0.41). The fitting degree of index and soil EC increases significantly with the increase of soil salinity under different salinity levels. The highest fitting degree of salinity index and soil EC is S1 (R2 = 0.73) and S2 (R2 = 0.72); ④ In the fitting model, the evaluation index and soil EC calculated based on cubic model, quadratic model and S model has a high fitting degree. This study has analyzed the applicability of various soil salinization evaluation indexes in soil salinity monitoring of Yinbei irrigation area, and the preliminary conclusions can provide reference for remote sensing monitoring of soil salinity in Yinbei irrigation area of Ningxia.

Key wordssoil salinization    salinity index    vegetation index    curve fitting    Landsat
收稿日期: 2020-07-16      出版日期: 2021-07-21
ZTFLH:  TP79S153  
基金资助:国家自然科学基金项目“农田退水灌溉和玉米种植方式对宁夏盐碱土水盐运移的影响”(31960274);宁夏青年科技人才托举项目“基于遥感技术的银北灌区土壤盐渍化动态监测研究”(TJGC2018055)
作者简介: 吴 霞(1984-),女,硕士,助理研究员,主要从事土地资源研究。Email: wuxia-xia@163.com
引用本文:   
吴霞, 王长军, 樊丽琴, 李磊. 基于多光谱遥感的盐渍化评价指数对宁夏银北灌区土壤盐度预测的适用性分析[J]. 国土资源遥感, 2021, 33(2): 124-133.
WU Xia, WANG Zhangjun, FAN Liqin, LI Lei. An applicability analysis of salinization evaluation index based on multispectral remote sensing to soil salinity prediction in Yinbei irrigation area of Ningxia. Remote Sensing for Land & Resources, 2021, 33(2): 124-133.
链接本文:  
https://www.gtzyyg.com/CN/10.6046/gtzyyg.2020210      或      https://www.gtzyyg.com/CN/Y2021/V33/I2/124
Fig.1  研究区影像及采样点示意图
Fig.1  研究区影像及采样点示意图
指数 公式 参考文献
归一化盐分指数 NDSI=(R-NIR)/(R+NIR) [14]
盐分指数S1 S1=B/R [14]
盐分指数S2 S2=(B-R)/(B+R) [14]
盐分指数S3 S3=(B×R)/B [14]
盐分指数S5 S5=(B×R)/G [14]
盐分指数S6 S6=(R×NIR)/G [14]
盐分指数SI SI= ( B × R ) [14]
盐分指数SI1(salt index1,SI1) SI1= ( G × R ) [14]
盐分指数SI2(salt index 2,SI2) SI2= G 2 + R 2 + NI R 2 [14]
盐分指数SI3(salt index3,SI3) SI3= R 2 + G 2 [14]
强度指数1(intensity index 1,Int1) Int1=(G+R)/2 [9]
强度指数2(intensity index 2,Int1) Int2=(G+R+NIR)/2 [9]
归一化植被指数 NDVI=(NIR-R)/(NIR+R) [25]
扩展的归一化植被指数(enhanced NDVI,ENDVI) ENDVI= ( NIR + SWI R 2 - R ) ( NIR + SWI R 2 + R ) [16]
增强型植被指数(enhanced vegetation index,EVI) EVI=G(NIR-R)/(NIR+6R+7.5B+1) [16]
指数 公式 参考文献
扩展的增强型植被指数(extented enhanced vegetation index,EEVI) EEVI=2.5(NIR+SWIR1-R)/(NIR+SWIR1+6R-7.5B+1) [16]
冠层盐分响应指数 CRSI= NIR × R - G × B NIR × R + G × B [17]
联合光谱指数(combined spectral response index,
CORSI)
CORSI= ( B + G ) ( R + NIR ) ×NDVI [17]
广义植被指数(generalized difference vegetation index,GDVI) GDVI=(NIR-G)/(NIR+G) [26]
盐渍化遥感监测指数模型 SDI= ( NDVI - 1 ) 2 - S I 2 [27]
Tab.1  土壤盐渍化评价指数
指数 公式 参考文献
归一化盐分指数 NDSI=(R-NIR)/(R+NIR) [14]
盐分指数S1 S1=B/R [14]
盐分指数S2 S2=(B-R)/(B+R) [14]
盐分指数S3 S3=(B×R)/B [14]
盐分指数S5 S5=(B×R)/G [14]
盐分指数S6 S6=(R×NIR)/G [14]
盐分指数SI SI= ( B × R ) [14]
盐分指数SI1(salt index1,SI1) SI1= ( G × R ) [14]
盐分指数SI2(salt index 2,SI2) SI2= G 2 + R 2 + NI R 2 [14]
盐分指数SI3(salt index3,SI3) SI3= R 2 + G 2 [14]
强度指数1(intensity index 1,Int1) Int1=(G+R)/2 [9]
强度指数2(intensity index 2,Int1) Int2=(G+R+NIR)/2 [9]
归一化植被指数 NDVI=(NIR-R)/(NIR+R) [25]
扩展的归一化植被指数(enhanced NDVI,ENDVI) ENDVI= ( NIR + SWI R 2 - R ) ( NIR + SWI R 2 + R ) [16]
增强型植被指数(enhanced vegetation index,EVI) EVI=G(NIR-R)/(NIR+6R+7.5B+1) [16]
指数 公式 参考文献
扩展的增强型植被指数(extented enhanced vegetation index,EEVI) EEVI=2.5(NIR+SWIR1-R)/(NIR+SWIR1+6R-7.5B+1) [16]
冠层盐分响应指数 CRSI= NIR × R - G × B NIR × R + G × B [17]
联合光谱指数(combined spectral response index,
CORSI)
CORSI= ( B + G ) ( R + NIR ) ×NDVI [17]
广义植被指数(generalized difference vegetation index,GDVI) GDVI=(NIR-G)/(NIR+G) [26]
盐渍化遥感监测指数模型 SDI= ( NDVI - 1 ) 2 - S I 2 [27]
Tab.1  土壤盐渍化评价指数
曲线模型 公式
线性函数(Linear) Y=b0+b1t
对数函数(Logarithmic) Y=b0+b1lnt
逆模型(Inverse) Y=b0+b1/t
二次函数(Quadratic) Y=b0+b1t+b2t2
三次函数(Cubic) Y=b0+b1t+b2t2+b3t3
复合函数(Compound) Y=b0 b 1 t
幂函数(Power) Y=b0 t b 1
S函数 Y= e ( b 0 + b 1 / t )
增长函数(Growth) Y= e ( b 0 + b 1 t )
指数函数(Exponential) Y=b0 e b 1 t
逻辑函数(Logistic) Y= ( 1 / u + b 0 b 1 t ) - 1
Tab.2  曲线回归模型及其公式
统计特征 样本数 最小值/
(mS·cm-1)
最大值/
(mS·cm-1)
均值/
(mS·cm-1)
标准差/
(mS·cm-1)
变异系数
全样本 52 0.04 7.52 0.84 1.50 1.78
非盐渍化 20 0.04 0.27 0.19 0.08 0.40
轻度盐渍化 23 0.29 0.99 0.47 0.20 0.42
中重度盐渍化 9 1.08 7.52 3.24 2.51 0.77
Tab.3  研究区土壤EC的统计特征
统计特征 样本数 最小值/
(mS·cm-1)
最大值/
(mS·cm-1)
均值/
(mS·cm-1)
标准差/
(mS·cm-1)
变异系数
全样本 52 0.04 7.52 0.84 1.50 1.78
非盐渍化 20 0.04 0.27 0.19 0.08 0.40
轻度盐渍化 23 0.29 0.99 0.47 0.20 0.42
中重度盐渍化 9 1.08 7.52 3.24 2.51 0.77
Tab.3  研究区土壤EC的统计特征
Fig.2  土壤EC与盐渍化评价指数之间的相关性图
模型 NDSI S1 S2 S3 S5 S6 SI
R2 RMSE/
(mS·cm-1)
R2 RMSE/
(mS·cm-1)
R2 RMSE/
(mS·cm-1)
R2 RMSE/
(mS·cm-1)
R2 RMSE/
(mS·cm-1)
R2 RMSE/
(mS·cm-1)
R2 RMSE/
(mS·cm-1)
线性函数 0.036 0.729 0.215 0.657 0.199 0.664 0.335 0.605 0.272 0.633 0.257 0.640 0.268 0.635
对数函数 0.195 1.055 0.215 1.541 0.216 1.547 0.172 1.389 0.216 1.545
逆模型 0.025 0.733 0.175 0.674 0.298 0.622 0.089 0.708 0.161 0.680 0.082 0.711 0.163 0.679
二次函数 0.036 0.729 0.293 0.624 0.278 0.631 0.367 0.591 0.346 0.600 0.290 0.625 0.337 0.604
三次函数 0.036 0.729 0.304 0.619 0.327 0.609 0.395 0.577 0.406 0.572 0.319 0.612 0.382 0.583
复合函数 0.095 0.761 0.129 0.720 0.122 0.726 0.293 0.610 0.292 0.652 0.246 0.668 0.288 0.658
幂函数 0.121 0.728 0.261 0.694 0.264 0.691 0.211 0.718 0.262 0.693
S函数 0.063 0.765 0.112 0.734 0.168 0.670 0.156 0.747 0.225 0.744 0.138 0.750 0.225 0.719
增长函数 0.095 0.761 0.129 0.720 0.122 0.726 0.293 0.610 0.292 0.652 0.246 0.668 0.288 0.658
指数函数 0.095 0.761 0.129 0.720 0.122 0.726 0.293 0.610 0.292 0.652 0.246 0.668 0.288 0.658
逻辑函数 0.095 0.761 0.129 0.720 0.122 0.726 0.293 0.610 0.292 0.652 0.246 0.668 0.288 0.658
模型 SI1 SI2 SI3 Int1 Int2 NDVI ENDVI
R2 RMSE/
(mS·cm-1)
R2 RMSE/
(mS·cm-1)
R2 RMSE/
(mS·cm-1)
R2 RMSE/
(mS·cm-1)
R2 RMSE/
(mS·cm-1)
R2 RMSE/
(mS·cm-1)
R2 RMSE/
(mS·cm-1)
线性函数 0.218 0.656 0.180 0.672 0.210 0.659 0.214 0.658 0.193 0.667 0.036 0.729 0.135 0.690
对数函数 0.181 1.400 0.153 1.028 0.175 1.188 0.178 1.389 0.163 1.130 0.032 0.788 0.150 1.433
模型 SI1 SI2 SI3 Int1 Int2 NDVI ENDVI
R2 RMSE/
(mS·cm-1)
R2 RMSE/
(mS·cm-1)
R2 RMSE/
(mS·cm-1)
R2 RMSE/
(mS·cm-1)
R2 RMSE/
(mS·cm-1)
R2 RMSE/
(mS·cm-1)
R2 RMSE/
(mS·cm-1)
逆模型 0.142 0.687 0.125 0.694 0.138 0.689 0.140 0.688 0.133 0.691 0.025 0.733 0.165 0.678
二次函数 0.269 0.635 0.233 0.650 0.259 0.639 0.264 0.637 0.252 0.642 0.036 0.728 0.205 0.662
三次函数 0.292 0.625 0.257 0.640 0.281 0.629 0.286 0.627 0.277 0.631 0.036 0.728 0.205 0.662
复合函数 0.255 0.690 0.192 0.718 0.250 0.694 0.252 0.692 0.212 0.710 0.095 0.761 0.161 0.730
幂函数 0.235 0.711 0.178 0.729 0.231 0.713 0.233 0.712 0.196 0.723 0.082 0.762 0.171 0.722
S函数 0.207 0.728 0.159 0.738 0.204 0.729 0.205 0.729 0.175 0.735 0.063 0.765 0.182 0.714
增长函数 0.255 0.690 0.192 0.718 0.250 0.694 0.252 0.692 0.212 0.710 0.095 0.710 0.161 0.730
指数函数 0.255 0.690 0.192 0.718 0.250 0.694 0.252 0.692 0.212 0.710 0.095 0.710 0.161 0.730
逻辑函数 0.255 0.690 0.192 0.718 0.250 0.694 0.252 0.692 0.212 0.710 0.095 0.710 0.161 0.730
模型 EVI EEVI COSRI CRSI GDVI SDI
R2 RMSE/
(mS·cm-1)
R2 RMSE/
(mS·cm-1)
R2 RMSE/
(mS·cm-1)
R2 RMSE/
(mS·cm-1)
R2 RMSE/
(mS·cm-1)
R2 RMSE/
(mS·cm-1)
线性函数 0.110 0.699 0.131 0.692 0.009 0.739 0.199 0.664 0.095 0.706 0.055 0.722
对数函数 0.100 1.611 0.119 1.142 0.006 0.770 0.221 0.895 0.114 0.912 0.053 0.753
逆模型 0.070 0.716 0.108 0.701 0.003 0.741 0.245 0.645 0.140 0.688 0.051 0.723
二次函数 0.110 0.699 0.207 0.661 0.014 0.737 0.284 0.628 0.114 0.699 0.058 0.720
三次函数 0.210 0.660 0.213 0.658 0.015 0.769 0.284 0.628 0.186 0.670 0.059 0.720
复合函数 0.050 0.757 0.078 0.749 0.051 0.769 0.169 0.709 0.135 0.744 0.118 0.754
幂函数 0.050 0.758 0.076 0.751 0.044 0.770 0.176 0.698 0.136 0.737 0.118 0.755
S函数 0.040 0.761 0.073 0.752 0.034 0.772 0.183 0.684 0.138 0.728 0.117 0.756
增长函数 0.050 0.757 0.078 0.749 0.051 0.769 0.169 0.709 0.135 0.744 0.118 0.754
指数函数 0.050 0.757 0.078 0.749 0.051 0.769 0.169 0.709 0.135 0.744 0.118 0.754
逻辑函数 0.050 0.757 0.078 0.749 0.051 0.769 0.169 0.709 0.135 0.744 0.118 0.754
Tab.4  盐渍化评价指数与全样本土壤EC之间的曲线拟合结果
模型 S3 S5 SI SI2 Int2 CRSI GDVI
R2 RMSE/
(mS·cm-1)
R2 RMSE/
(mS·cm-1)
R2 RMSE/
(mS·cm-1)
R2 RMSE/
(mS·cm-1)
R2 RMSE/
(mS·cm-1)
R2 RMSE/
(mS·cm-1)
R2 RMSE/
(mS·cm-1)
线性函数 0.320 0.080 0.279 0.082 0.270 0.082 0.302 0.081 0.293 0.081
对数函数 0.224 0.226 0.26 0.227 0.225 0.226 0.267 0.177 0.259 0.191
逆模型 0.176 0.088 0.227 0.085 0.220 0.085
二次函数 0.333 0.079 0.360 0.077 0.338 0.079 0.359 0.077 0.344 0.078 0.329 0.079
三次函数 0.362 0.077 0.341 0.078 0.356 0.077 0.342 0.078 0.329 0.079 0.419 0.074
复合函数 0.292 0.080 0.245 0.082 0.241 0.082 0.283 0.081 0.272 0.081
幂函数 0.198 0.085 0.193 0.085 0.197 0.085 0.249 0.083 0.239 0.083
S函数 0.211 0.085 0.201 0.086
增长函数 0.292 0.080 0.245 0.082 0.241 0.082 0.283 0.081 0.272 0.081
指数函数 0.292 0.080 0.245 0.082 0.241 0.082 0.283 0.081 0.272 0.081
逻辑函数 0.292 0.080 0.245 0.082 0.241 0.082 0.283 0.081 0.272 0.081
Tab.5  盐渍化评价指数与土壤EC之间的曲线拟合结果(轻度盐渍化)
模型 S1 S2 S3 S5 S6 SI SI1
R2 RMSE/
(mS·cm-1)
R2 RMSE/
(mS·cm-1)
R2 RMSE/
(mS·cm-1)
R2 RMSE/
(mS·cm-1)
R2 RMSE/
(mS·cm-1)
R2 RMSE/
(mS·cm-1)
R2 RMSE/
(mS·cm-1)
线性函数 0.578 0.767 0.604 0.744
对数函数 0.610 1.881
逆模型 0.638 0.711
二次函数 0.722 0.623 0.717 0.628
三次函数 0.724 0.621 0.711 0.635
复合函数 0.664 0.949 0.692 0.921 0.463 0.983 0.507 0.939 0.493 0.984 0.523 0.931 0.502 0.934
幂函数 0.699 0.913 0.528 0.895 0.508 0.913 0.501 0.902 0.523 0.931 0.491 0.913
模型 S1 S2 S3 S5 S6 SI SI1
R2 RMSE/
(mS·cm-1)
R2 RMSE/
(mS·cm-1)
R2 RMSE/
(mS·cm-1)
R2 RMSE/
(mS·cm-1)
R2 RMSE/
(mS·cm-1)
R2 RMSE/
(mS·cm-1)
R2 RMSE/
(mS·cm-1)
S函数 0.730 0.872 0.498 1.063 0.463 0.925 0.476 0.912
增长函数 0.664 0.949 0.692 0.921 0.463 0.983 0.507 0.939 0.493 0.984 0.523 0.931 0.502 0.934
指数函数 0.664 0.949 0.692 0.921 0.463 0.983 0.508 0.939 0.493 0.984 0.523 0.931 0.502 0.934
逻辑函数 0.664 0.949 0.692 0.921 0.463 0.983 0.507 0.939 0.493 0.984 0.523 0.931 0.502 0.934
模型 SI2 SI3 Int1 Int2 EEVI CRSI
R2 RMSE/
(mS·cm-1)
R2 RMSE/
(mS·cm-1)
R2 RMSE/
(mS·cm-1)
R2 RMSE/
(mS·cm-1)
R2 RMSE/
(mS·cm-1)
R2 RMSE/
(mS·cm-1)
线性函数 0.580 0.766
对数函数 0.553 3.000
逆模型 0.520 0.819
二次函数
三次函数
复合函数 0.511 0.915 0.493 0.937 0.498 0.935 0.517 0.915 0.623 0.770 0.515 0.946
幂函数 0.487 0.912 0.481 0.919 0.486 0.916 0.495 0.906 0.588 0.780 0.496 0.961
S函数 0.548 0.803 0.477 0.974
增长函数 0.511 0.915 0.493 0.937 0.498 0.935 0.517 0.915 0.623 0.770 0.515 0.983
指数函数 0.511 0.915 0.493 0.937 0.498 0.935 0.517 0.915 0.623 0.770 0.515 0.983
逻辑函数 0.511 0.915 0.493 0.937 0.498 0.935 0.517 0.915 0.623 0.770 0.515 0.983
Tab.6  盐渍化评价指数与土壤EC之间的曲线拟合结果(中重度盐渍化)
模型 S1 S2 S3 S5 S6 SI SI1
R2 RMSE/
(mS·cm-1)
R2 RMSE/
(mS·cm-1)
R2 RMSE/
(mS·cm-1)
R2 RMSE/
(mS·cm-1)
R2 RMSE/
(mS·cm-1)
R2 RMSE/
(mS·cm-1)
R2 RMSE/
(mS·cm-1)
线性函数 0.578 0.767 0.604 0.744
对数函数 0.610 1.881
逆模型 0.638 0.711
二次函数 0.722 0.623 0.717 0.628
三次函数 0.724 0.621 0.711 0.635
复合函数 0.664 0.949 0.692 0.921 0.463 0.983 0.507 0.939 0.493 0.984 0.523 0.931 0.502 0.934
幂函数 0.699 0.913 0.528 0.895 0.508 0.913 0.501 0.902 0.523 0.931 0.491 0.913
模型 S1 S2 S3 S5 S6 SI SI1
R2 RMSE/
(mS·cm-1)
R2 RMSE/
(mS·cm-1)
R2 RMSE/
(mS·cm-1)
R2 RMSE/
(mS·cm-1)
R2 RMSE/
(mS·cm-1)
R2 RMSE/
(mS·cm-1)
R2 RMSE/
(mS·cm-1)
S函数 0.730 0.872 0.498 1.063 0.463 0.925 0.476 0.912
增长函数 0.664 0.949 0.692 0.921 0.463 0.983 0.507 0.939 0.493 0.984 0.523 0.931 0.502 0.934
指数函数 0.664 0.949 0.692 0.921 0.463 0.983 0.508 0.939 0.493 0.984 0.523 0.931 0.502 0.934
逻辑函数 0.664 0.949 0.692 0.921 0.463 0.983 0.507 0.939 0.493 0.984 0.523 0.931 0.502 0.934
模型 SI2 SI3 Int1 Int2 EEVI CRSI
R2 RMSE/
(mS·cm-1)
R2 RMSE/
(mS·cm-1)
R2 RMSE/
(mS·cm-1)
R2 RMSE/
(mS·cm-1)
R2 RMSE/
(mS·cm-1)
R2 RMSE/
(mS·cm-1)
线性函数 0.580 0.766
对数函数 0.553 3.000
逆模型 0.520 0.819
二次函数
三次函数
复合函数 0.511 0.915 0.493 0.937 0.498 0.935 0.517 0.915 0.623 0.770 0.515 0.946
幂函数 0.487 0.912 0.481 0.919 0.486 0.916 0.495 0.906 0.588 0.780 0.496 0.961
S函数 0.548 0.803 0.477 0.974
增长函数 0.511 0.915 0.493 0.937 0.498 0.935 0.517 0.915 0.623 0.770 0.515 0.983
指数函数 0.511 0.915 0.493 0.937 0.498 0.935 0.517 0.915 0.623 0.770 0.515 0.983
逻辑函数 0.511 0.915 0.493 0.937 0.498 0.935 0.517 0.915 0.623 0.770 0.515 0.983
Tab.6  盐渍化评价指数与土壤EC之间的曲线拟合结果(中重度盐渍化)
Fig.3  不同盐度水平土壤EC预测值与实测值关系散点图
Fig.4  研究区土壤EC分布图
Fig.4  研究区土壤EC分布图
[1] 张雅莉, 尔达克·克里木. 基于Landsat8 OLI影像光谱的土壤盐分估算模型研究[J]. 国土资源遥感, 2018, 30(1):87-94.doi: 10.6046/gtzyyg.2018.01.12.
doi: 10.6046/gtzyyg.2018.01.12
Zhang Y L, Kelimu A. Estimation model of soil salinization based on Landsat8 OLI image spectrum[J]. Remote Sensing for Land and Resources, 2018, 30(1):87-94.doi: 10.6046/gtzyyg.2018.01.12.
doi: 10.6046/gtzyyg.2018.01.12
[2] 厉彦玲. 黄河三角洲土壤质量退化对土地利用/覆被变化的响应研究[D]. 泰安:山东农业大学, 2018.
Li Y L. Response of soil quality degradation to land use/cover changes in the Yellow River delta[D]. Taian:Shandong Agricultural University, 2018.
[3] 吴加敏, 姚建华, 张永庭, 等. 银川平原土壤盐渍化与中低产田遥感应用研究[J]. 遥感学报, 2007, 11(3):414-419.
Wu J M, Yao J H, Zhang Y T, et al. Remote sensing application study on the soil salinity and the medium & low yield croplands in Yinchuan Plain(YCP)[J]. Journal of Remote Sensing, 2007, 11(3):414-419.
[4] 李剑萍, 马力文, 苏占胜, 等. 宁夏银北地区盐碱地遥感调查分析[C]//周光召.加入WTO和中国科技与可持续发展——挑战与机遇、责任和对策(下册). 北京: 中国科学技术出版社, 2002:136-139.
Li J P, Ma L W, Su Z S, et al. Remote sensing investigation and analysis of saline alkali land in Yinbei area of Ningxia[C]//Zhou G Z.China’s accession to WTO and China’s science and technology and sustainable development:Challenges and opportunities, responsibilities and Countermeasures (Volume II). Beijing: China Science and Technology Press, 2002:136-139.
[5] 李重阳, 宋豫秦. 宁夏银北灌区土壤盐渍化时空分布特征[J]. 人民黄河, 2014, 36(8):134-136,140.
Li C Y, Song Y Q. Spatial-temporal distribution characteristics of soil salinization in northern Yinchuan plain of Ningxia[J]. Yellow River, 2014, 36(8):134-136,140.
[6] 吴亚坤, 刘广明, 苏里坦, 等. 多源数据的区域土壤盐渍化精确评估[J]. 光谱学与光谱分析, 2018, 38(11):3528-3533.
Wu Y K, Liu G M, Su L T, et al. Accurate evaluation of regional soil salinization using multi-source data[J]. Spectroscopy and Spectral Analysis, 2018, 38(11):3528-3533.
[7] 吐尔逊·艾山, 海米提·司马义. 土壤盐渍化遥感监测研究进展综述[J]. 新疆大学学报(自然科学版), 2008, 109(1):1-7.
Hasan T, Ishmael H. Research progress and summary of remote sensing monitoring of soil salinization[J]. Journal of Xinjiang University(Natural Science Edition), 2008, 109(1):1-7.
[8] 胡婕. 基于多源遥感的干旱地区土壤盐分反演研究[D]. 杭州:浙江大学, 2019.
Hu J. Estimation of soil salinity in arid area based on multi-source remote sensing[D]. Hangzhou:Zhejiang University, 2019.
[9] 梁静, 丁建丽, 王敬哲, 等. 基于反射光谱与Landsat 8 OLI多光谱数据的艾比湖湿地土壤盐分估算[J]. 土壤学报, 2019, 56(2):320-330.
Liang J, Ding J L, Wang J Z, et al. Quantitative estimation and mapping of soil salinity in the Ebinur Lake wetland based on Vis-NIR reflectance and Landsat 8 OLI data[J]. Acta Pedologica Sinica, 2019, 56(2):320-330.
[10] 樊彦国, 侯春玲, 朱浩, 等. 基于BP神经网络的盐渍土盐分遥感反演模型研究[J]. 地理与地理信息科学, 2010, 26(6):24-27,115.
Fan Y G, Hou C L, Zhu H, et al. Research on salinity inversion from remote sensing of saline soil based on BP neural network[J]. Geography and Geo-Information Science, 2010, 26(6):24-27,115.
[11] 缪琛. 基于时空序列重构的物候与土壤盐渍化关系研究[D]. 乌鲁木齐:新疆大学, 2017.
Miu C. Study on the relationship between phenology and soil salinization based on spatial and temporal sequence reconstruction: A case study of Ugan-Kugqa oases[D]. Urumchi:Xinjiang University, 2017.
[12] Metternicht G I, Zinck J A. Remote sensing of soil salinity:Potentials and constraints[J]. Remote Sensing of Environment, 2003, 85(1):1-20.
doi: 10.1016/S0034-4257(02)00188-8
[13] 扶卿华, 倪绍祥, 王世新, 等. 土壤盐分含量的遥感反演研究[J]. 农业工程学报, 2007(23):48-54.
Fu Q H, Ni S X, Wang S X, et al. Retrieval of soil salt content based on remote sensing[J]. Transactions of the Chinese Society of Agricultural Engineering, 2007(23):48-54.
[14] Allbed A, Kumar L, Aldakheel Y Y, Assessing soil salinity using soil salinity and vegetation indices derived from IKONOS high-spatial resolution imageries:Applications in a date palm dominated region[J]. Geoderma, 2014, 230-231:1-8.
doi: 10.1016/j.geoderma.2014.03.025
[15] Elia S, Todd H S, Dennis L C. Regional-scale soil salinity assessment using Landsat ETM+ canopy reflectance[J]. Remote Sensing of Environment, 2015, 169(9):335-343.
doi: 10.1016/j.rse.2015.08.026
[16] 陈红艳, 赵庚星, 陈敬春, 等. 基于改进植被指数的黄河口区盐渍土盐分遥感反演[J]. 农业工程学报, 2015, 31(5):107-114.
Chen H Y, Zhao G X, Chen J C, et al. Remote sensing inversion of saline soil salinity based on modifiedvegetation index in estuary arca of Yellow River[J]. Transactions of the Chinese Socicty of Agricultural Engineering, 2015, 31(5):107-114.
[17] 王飞, 丁建丽, 魏阳, 等. 基于Landsat系列数据的盐分指数和植被指数对土壤盐度变异性的响应分析——以新疆天山南北典型绿洲为例[J]. 生态学报, 2017, 37(15):5007-5022.
Wang F, Ding J L, Wei Y, et al. Sensitivity analysis of soil salinity and vegetation indices to detect soil salinity variation by using Landsat series images:Applications in different oases in Xinjiang[J]. Acta Ecologica Sinica, 2017. 37(15):5007-5022.
[18] 于文婧. 基于环境小卫星和GIS的灌区土壤盐渍化研究[D]. 北京:中国农业大学, 2016.
Yu W J. Study of the soil salinization in irrigated area based on HJ satellite and GIS[D]. Beijing:China Agricultural University, 2016.
[19] 孙玉芳. 基于遥感监测指数模型的银川平原土壤盐渍化动态研究[J]. 地下水, 2019, 41(5):80-82.
Sun Y F. Study on soil salinization dynamics in Yinchuan Plain based on remote sensing monitoring index model[J]. Ground Water, 2019, 41(5):80-82.
[20] 阿也提古丽·斯迪克. 宁夏平罗土壤含盐量遥感估算方法研究[D]. 南京:南京大学, 2011.
Sidike A. Estimation model of salt content in soils by remote sensing:A case study of Pingluo County,Ningxia Province,China[D]. Nanjing:Nanjing University, 2011.
[21] 鲁如坤. 土壤农业化学分析方法[M]. 北京: 中国农业科技出版社, 2000.
Lu R K. Soil agrochemical analysis methods[M]. Beijing: China Agricultural Science and Technology Press, 2000.
[22] Rai A K, Mandal N, Singh A, et al. Landsat 8 OLI satellite image classification using convolutional neural network[J]. Procedia Computer Science, 2020, 167:987-993.
doi: 10.1016/j.procs.2020.03.398
[23] 蒲智, 于瑞德, 尹昌应, 等. 干旱区典型盐碱土壤含盐量估算的最佳高光谱指数研究[J]. 水土保持通报, 2012, 32(6):129-133.
Pu Z, Yu R D, Yin C Y, et al. Optimal hyperspectral indices for soil salt content estimation on typical saline soil in arid areas[J]. Bulletin of Soil and Water Conservation, 2012, 32(6):129-133.
[24] 张智韬. 基于遥感技术的灌区动态信息监测[D]. 杨陵:西北农林科技大学, 2005.
Zhang Z T. Dynamic information monitoring in irrigation distract base on remote sensing[D]. Yangling:Northwest A & F University, 2005.
[25] 王飞, 丁建丽. 基于土壤植被光谱协同分析的土壤盐度推理模型构建研究[J]. 光谱学与光谱分析, 2016, 36(6):1848-1853.
Wang F, Ding J L. Soil salinity modelling study with salinity inference model based on the integration of soil and vegetation spectrum in arid land[J]. Spectroscopy and Spectral Analysis, 2016, 36(6):1848-1853.
[26] Wu W C. The generalized difference vegetation index (GDVI) for dryland characterization[J]. Remote Sensing, 2014, 6(2):1211-1233.
doi: 10.3390/rs6021211
[27] 王飞, 丁建丽, 伍漫春. 基于NDVI-SI特征空间的土壤盐渍化遥感模型[J]. 农业工程学报, 2010, 26(8):8,168-173.
Wang F, Ding J L, Wu M C. Remote sensing monitoring models of soil salinization based on NDVI-SI feature space[J]. Transactions of the Chinese Socicty of Agricultural Engineering, 2010, 26(8):8,168-173.
[28] 尹德光. 农业统计学[M]. 北京: 中国统计出版社, 1995.
Yin D G. Agricultural statistics[M]. Beijing: China Statistics Press, 1995.
[29] 曹雷, 丁建丽, 玉米提·哈力克,等.基于国产高分一号卫星数据的区域土壤盐渍化信息提取与建模[J]. 土壤学报, 2016, 53(6):1399-1409.
Cao L, Ding J L, Halik U, et al. Extraction and modeling of regional soil salinization based on data from GF-1 satellite[J]. Acta Pedologica Sinica, 2016, 53(6):1399-1409.
[30] 关红, 贾科利, 张至楠, 等. 盐渍化土壤光谱特征分析与建模[J]. 国土资源遥感, 2015, 27(2):100-104.doi: 10.6046/gtzyyg.2015.02.16.
doi: 10.6046/gtzyyg.2015.02.16
Guan H, Jia K L, Zhang Z N, et al. Research on remote sensing monitoring model of soil salinization based on spectrum characteristic analysis[J]. Remote Sensing for Land and Resources, 2015, 27(2):100-104.doi: 10.6046/gtzyyg.2015.02.16.
doi: 10.6046/gtzyyg.2015.02.16
[31] 买买提·沙吾提, 丁建丽, 等. 基于GIS的干旱区土壤盐渍化敏感性评价——以渭干河-库车河三角洲绿洲为例[J]. 资源科学, 2012, 34(2):353-358.
Sawut M, Ding J L, et al. A GIS-based assessment on sensitivity of soil salinization in arid areas:A case study of the Ugan-Kuqa River delta[J]. Resources Science, 2012, 34(2):353-358.
[32] 彭杰, 刘焕军, 史舟, 等. 盐渍化土壤光谱特征的区域异质性及盐分反演[J]. 农业工程学报, 2014, 30(17):167-174.
Peng J, Liu H J, Shi Z, et al. Regional heterogeneity of hyperspectral characteristics of salt-affected soil and salinity inversion[J]. Transactions of the Chinese Socicty of Agricultural Engineering, 2014, 30(17):167-174.
[33] 江红南. 新疆不同区域土壤盐渍化光学遥感定量监测研究[D]. 武汉:武汉大学, 2018.
Jiang H N. Quantitative monitoring on soil salinization utilizing optical remote sensing in different regions of Xinjiang[J]. Wuhan:Wuhan University, 2018.
[34] 赵群, 吴加敏. 基于遥感技术的银川土地盐渍化动态监测研究[J]. 现代农业科技, 2009, 517(23):312-314,317.
Zhao Q, Wu J M, Dynamic monitoring of land salinization in Yinchuan based on remote sensing[J]. Modern Agricultural Science and Technology, 2009, 517(23):312-314,317.
[35] 阿尔达克·克里木, 尼格拉·塔什甫拉提, 等. 艾比湖自然保护区荒漠-盐生植被VIS-NIR光谱反射特征研究[J]. 草地学报, 2016, 24(2):453-458.
Kelimu A, Tashpolat N, et al. Study on hyperspectral reflectance characteristics of typical vegetation in Ebinur Lake wetland[J]. Acta Agrestia Sinica, 2016, 24(2):453-458.
[1] 李娜, 甘甫平, 董新丰, 李娟, 张世凡, 李彤彤. 基于高分五号高光谱数据的石漠化调查应用研究[J]. 自然资源遥感, 2023, 35(2): 230-235.
[2] 于森, 贾明明, 陈高, 鲁莹莹, 李毅, 张博淳, 路春燕, 李慧颖. 基于LandTrendr算法海南东寨港红树林扰动研究[J]. 自然资源遥感, 2023, 35(2): 42-49.
[3] 代云豪, 管瑶, 冯春涌, 蒋敏, 贺兴宏. 基于光谱指数建模的阿拉尔垦区土壤盐渍化信息提取与分析[J]. 自然资源遥感, 2023, 35(1): 205-212.
[4] 陈慧欣, 陈超, 张自力, 汪李彦, 梁锦涛. 一种基于Google Earth Engine云平台的潮间带遥感信息提取方法[J]. 自然资源遥感, 2022, 34(4): 60-67.
[5] 李毅, 程丽娜, 鲁莹莹, 张博淳, 于森, 贾明明. 基于最大值合成和最大类间方差法莱州湾滨海滩涂变化研究[J]. 自然资源遥感, 2022, 34(4): 68-75.
[6] 秦乐, 何鹏, 马玉忠, 刘建强, 杨彬. 基于时空谱特征的遥感影像时间序列变化检测[J]. 自然资源遥感, 2022, 34(4): 105-112.
[7] 李星佑, 张飞, 王筝. 土壤盐渍化遥感监测模型构建方法现状与发展趋势[J]. 自然资源遥感, 2022, 34(4): 11-21.
[8] 张思源, 岳楚, 袁国礼, 袁帅, 庞文强, 李俊. 基于ENDVI-SI3特征空间的盐渍化反演模型及风险评估[J]. 自然资源遥感, 2022, 34(4): 136-143.
[9] 陈艳英, 马鑫程, 徐彦平, 王颖, 汪艳波. 地形及NDVI在林火遥感监测二次识别中应用的方法探讨[J]. 自然资源遥感, 2022, 34(3): 88-96.
[10] 董双发, 范晓, 石海岗, 许莉萍, 章新益. 基于Landsat8和无人机的福清核电温排水分布研究[J]. 自然资源遥感, 2022, 34(3): 112-120.
[11] 王驷鹞, 赵春雷, 陈霞, 刘丹. 基于遥感的唐山市绿色空间演化及对热岛效应的影响[J]. 自然资源遥感, 2022, 34(2): 168-175.
[12] 伯英杰, 曾业隆, 李国庆, 曹兴文, 姚清秀. 浮岛光伏电场对地表温度空间分布特征的影响[J]. 自然资源遥感, 2022, 34(1): 158-168.
[13] 姚金玺, 张志, 张焜. 基于GEE的诺木洪洪积扇植被时空变化特征、成因及趋势分析[J]. 自然资源遥感, 2022, 34(1): 249-256.
[14] 张爱竹, 王伟, 郑雄伟, 姚延娟, 孙根云, 辛蕾, 王宁, 胡光. 一种基于分层策略的时空融合模型[J]. 自然资源遥感, 2021, 33(3): 18-26.
[15] 李阳, 袁琳, 赵志远, 张晋磊, 王宪业, 张利权. 基于无人机低空遥感和现场调查的潮滩地形反演研究[J]. 自然资源遥感, 2021, 33(3): 80-88.
Viewed
Full text


Abstract

Cited

  Shared   
  Discussed   
京ICP备05055290号-2
版权所有 © 2015 《自然资源遥感》编辑部
地址:北京学院路31号中国国土资源航空物探遥感中心 邮编:100083
电话:010-62060291/62060292 E-mail:zrzyyg@163.com
本系统由北京玛格泰克科技发展有限公司设计开发