Spatial-temporal analysis of drought characteristics of Yunnan Province based on MODIS_TVDI/GNSS_PWV data
YU Wei1(), KE Fuyang1(), CAO Yunchang2
1. School of Remote Sensing & Geomatics Engineering, Nanjing University of Information Science & Technology, Nanjing 210044, China 2. Meteorological Observation Center, China Meteorological Administration, Beijing 100081, China
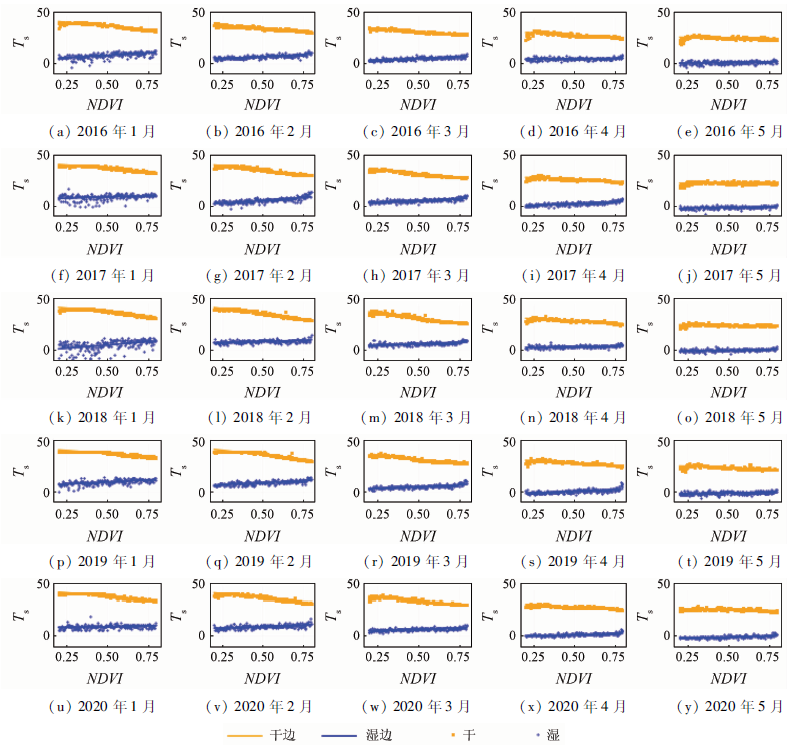
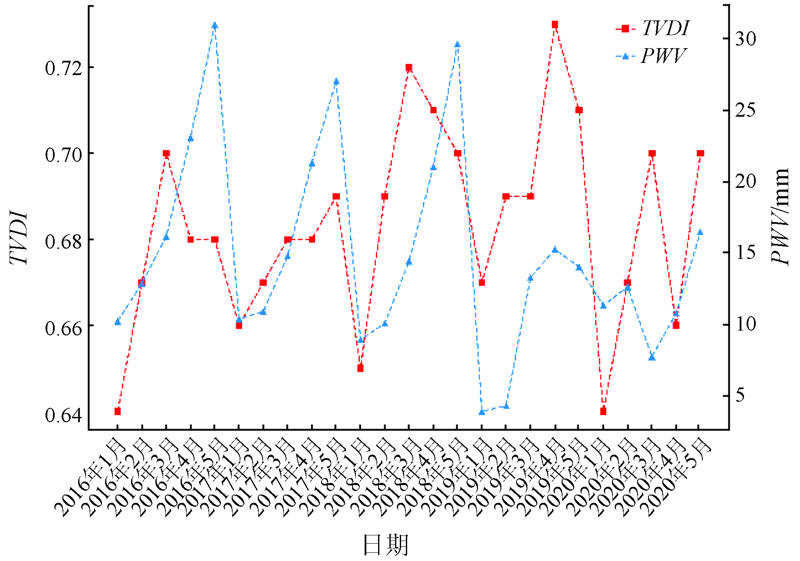
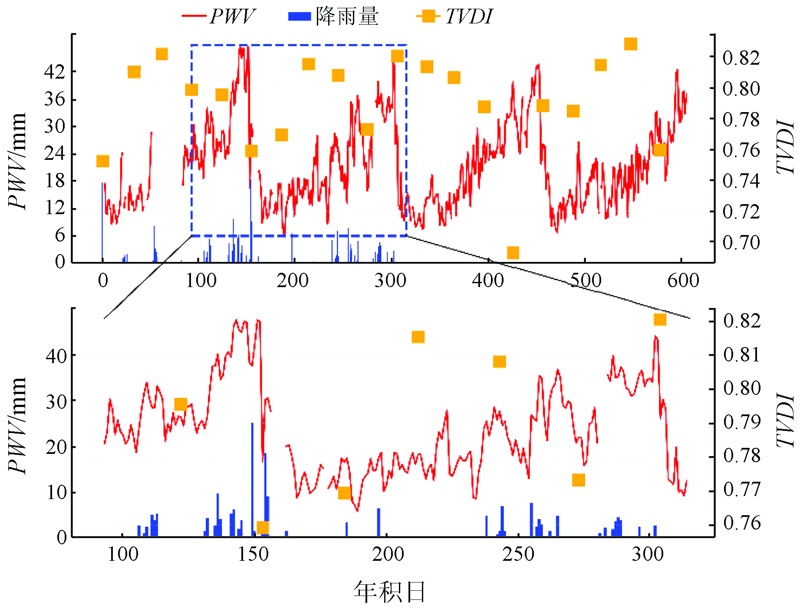
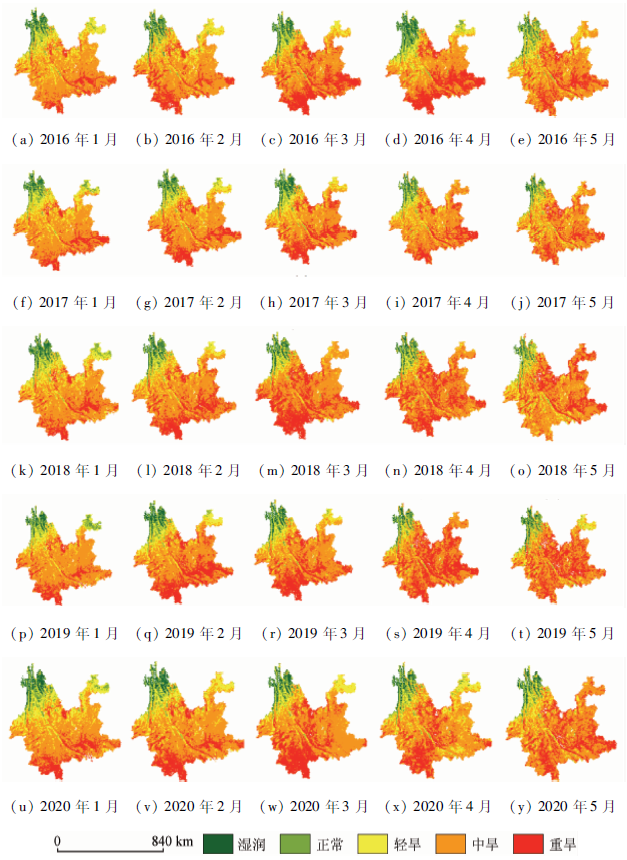
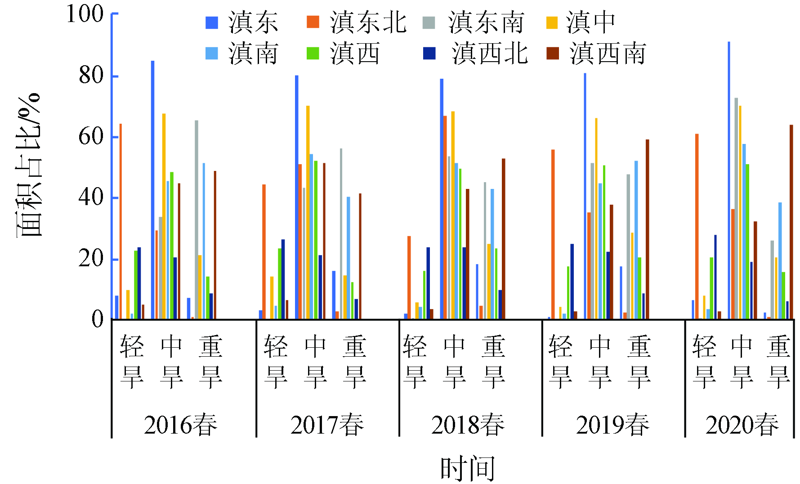
Existing drought monitoring technologies are liable to be affected by the environment and suffer poor timeliness. Given this, this study utilized the MODIS_TVDI and GNSS_PWV data to investigate the spatial-temporal changes in the drought characteristics in spring from 2016 to 2020 in Yunnan province through correlation analysis and regression analysis. The research results are as follows. The TVDI inversion results can accurately reflect the spatial-temporal changes in the regional drought characteristics during 2016—2020. In space, the drought showed the trend of increasing from northwest to southeast in Yunnan. In terms of time, the drought increased first and then alleviated in spring, especially from March to April. In addition, there was a strong correlation between PWV and TVDI according to Pearson correlation analysis. The correlation coefficient was largely greater than 0.5 on a quarterly scale. On a monthly scale, the variation trend of PWV was roughly consistent with that of TVDI, except that the variation of TVDI showed a certain time delay. On a daily scale, the variation amplitude of PWV was highly consistent with that of TVDI, especially during rainfall, and both of them showed certain signals of drought characteristics. Therefore, PWV can serve as a new technical means for drought monitoring.
于维, 柯福阳, 曹云昌. 基于MODIS_TVDI/GNSS_PWV的云南省干旱特征时空分析[J]. 自然资源遥感, 2021, 33(3): 202-210.
YU Wei, KE Fuyang, CAO Yunchang. Spatial-temporal analysis of drought characteristics of Yunnan Province based on MODIS_TVDI/GNSS_PWV data. Remote Sensing for Natural Resources, 2021, 33(3): 202-210.
Yu H, Wang L, Wen J, et al. Study on spatial and temporal distribution of drought disaster in 500 years in Yunnan Province[J]. Journal of Arid Land Resources and Environment, 2014, 28(12):38-44.
Li X Y, Yang L A, Nie H M, et al. Assessment of temporal and spatial dynamics of agricultural drought in Shaanxi Province based on vegetation condition index[J]. Journal of Ecology, 2018, 37(4):1172-1180.
Zhao J P, Zhang X F, Liao C H, et al. TVDI based soil moisture retrieval from remotely sensed data over large arid areas[J]. Remote Sensing Technology and Application, 2011, 26(6):742-750.
Sha S, Guo N, Li Y H, et al. Applicability of TVDI in monitoring drought in Longdong area of Gansu,China[J]. Journal of Desert Research, 2017, 37(1):132-139.
Wang M L, Jiang Q O, Shao Y Q, et al. Spatio-temporal variation of soil moisture and analysis on its influencing factors in Maqu county based on TVDI[J]. Science of Soil and Water Conservation, 2019, 17(4):141-152.
Liu Y, Yue H, Hou E K. Drought monitoring based on MODIS in Shaanxi[J]. Remote Sensing for Land and Resources, 2019, 31(2):172-179.doi: 10.6046/gtzyyg.2019.02.24.
doi: 10.6046/gtzyyg.2019.02.24
Huang Z, Li W B, Liang J. Application of precipitable water vapor from ground based GPS data to analysis of precipitation weather process[J]. Journal of Meteorology and Environment, 2013, 29(4):31-36.
Jin X, Shi K, Chen Y B, et al. Analysis on the characteristics of GPS precipitable water vapor during heavy rainfall[J]. GNSS World of China, 2018, 43(2):69-75.
Liu P, Liu Z M, Zhang M M, et al. Influence of different IGS ephemeris products on GPS of precipitable water vapor inversion[J]. Science of Surveying and Mapping, 2018, 43(12):17-22.
Han H B, Zhang X J, Zhang B Y, et al. Accuracy test of precipitable water vapor retrieved by GPS data and its variation characteristic in Qaidam Basin[J]. Journal of Arid Meteorology, 2020, 38(1):50-57.
[11]
F Alshawaf, F Zus, K Balidakis, et al. On the statistical significance of climatic trends estimated from GPS tropospheric time series[J]. Journal of Geophysical Research:Atmospheres, 2018, 123(19):10967-10990.
doi: 10.1029/2018JD028703
[12]
Wang X M, Zhang K F, Wu S Q, et al. The correlation between GNSS-derived precipitable water vapor and sea surface temperature and its responses to El Niño-Southern oscillation[J]. Remote Sensing of Environment, 2018, 2(16):1-12.
doi: 10.1016/0034-4257(71)90072-1
Hu S S, Huang C X, Yang B, et al. Reconstruction of MODIS vegetation index time series by adaptive weighted Savitzky-Golay filter[J]. Science of Surveying and Mapping, 2020, 45(4):105-116.
Lyu K, Lyu C W, Qiao T, et al. Effect of LST synjournal methods on prediction accuracy of TVDI[J]. Remote Sensing Information, 2019, 34(2):91-97.
[15]
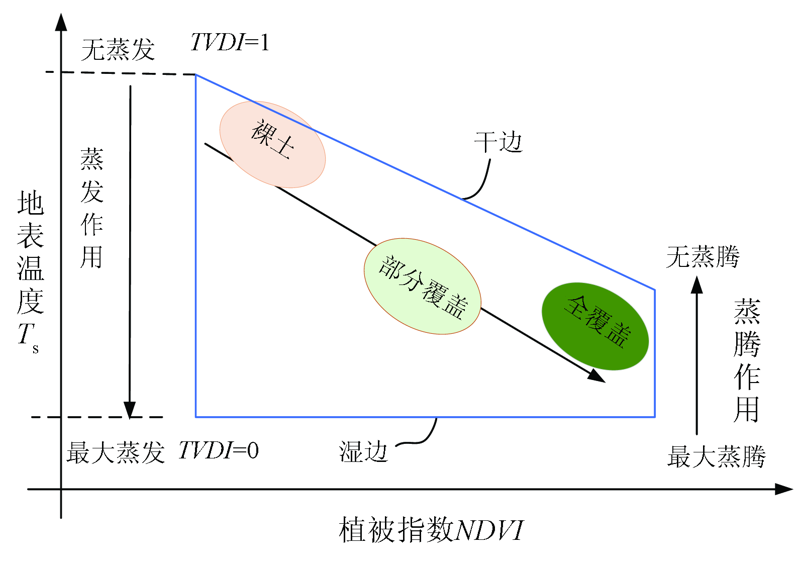
Sandholt I, Rasmussen K, Andersen J. A simple interpretation of the surface temperature vegetation index space for assessment of surface moisture status[J]. Remote Sensing of Environment, 2002, 79(2):213-224.
doi: 10.1016/S0034-4257(01)00274-7
[16]
Price J C. Using spatial context in satellite data to infer regional scale evapotranspiration[J]. IEEE Transactions on Geoscience and Remote Sensing, 1990, 28(5):940-948.
doi: 10.1109/36.58983
[17]
Nemani R, L Pierce, S Running, et al. Developing satellite-derived estimates of surface moisture status[J]. Journal of Applied Meteorology and Climatology, 1993, 32(3):548-557.
[18]
Michael B, Steven B, Thomas A H, et al. GPS Meteorology:Remote sensing of atmospheric water vapor using the global positioning system[J]. Geophysical Research Letters, 1992, 97(D14):15787-15801.
Li L, Tian Y, Yuan Z M, et al. Time series changes of GNSS remote sensing meteorological elements during rainstorms[J]. Science of Surveying and Mapping, 2016, 41(10):82-87.
Sun L, Wu Q, Pei Z Y, et al. Study on the correlation between temperature vegetation dryness index (TVDI) and various factors[J]. Geography and Geo-Information Science, 2010, 26(2):31-34,88.
Qi S H, Wang C Y, Niu Z. Evaluating soil moisture status in China using the temperature/vegetation dryness index (TVDI)[J]. Journal of Remote Sensing, 2003, 18(5):420-427,436.
Cao Y, Hu W Q, Yan P D. Remote sensing monitoring of the drought based on temperature vegetation dryness index in Yunnan Province[J]. Geotechnical Investigation & Surveying, 2016, 44(1):69-73.
 2021, Vol. 33
  ), 柯福阳1(