|
|
|
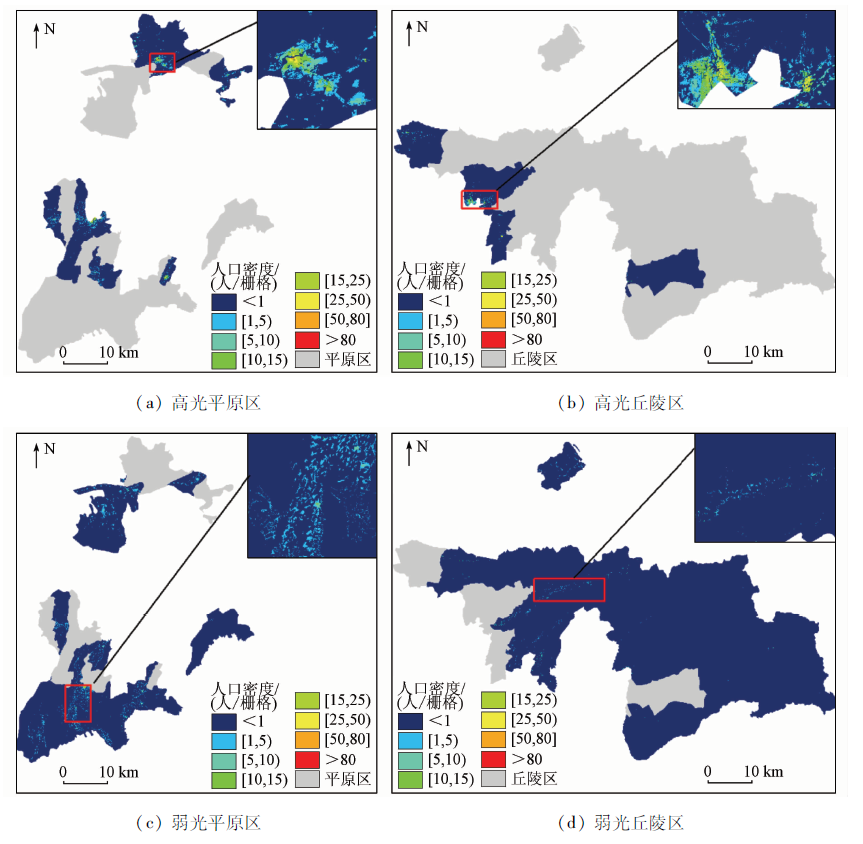
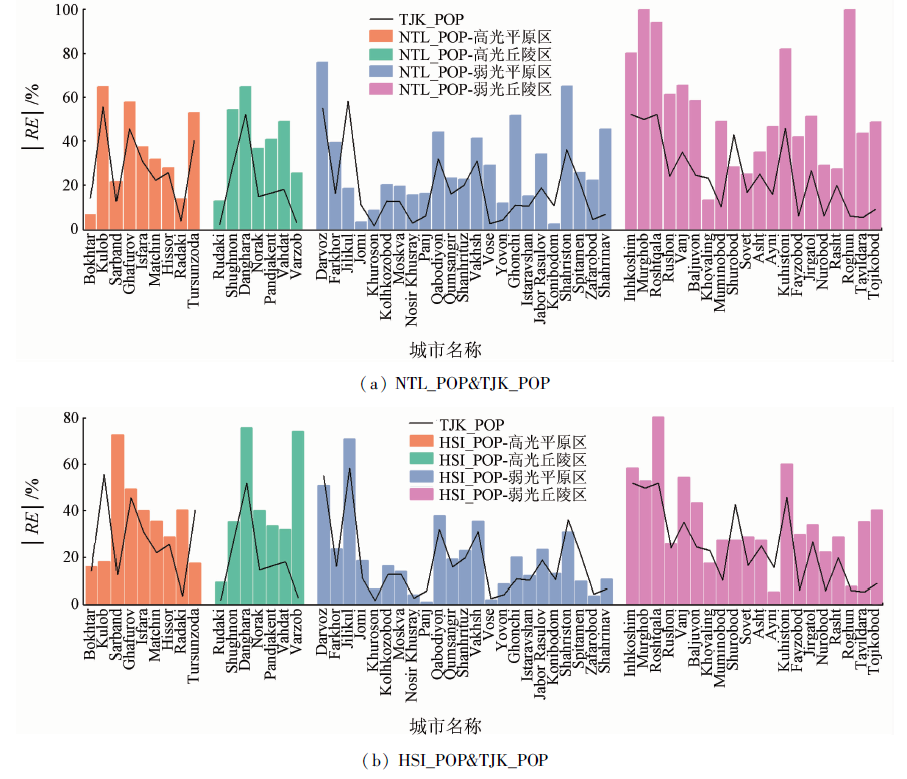
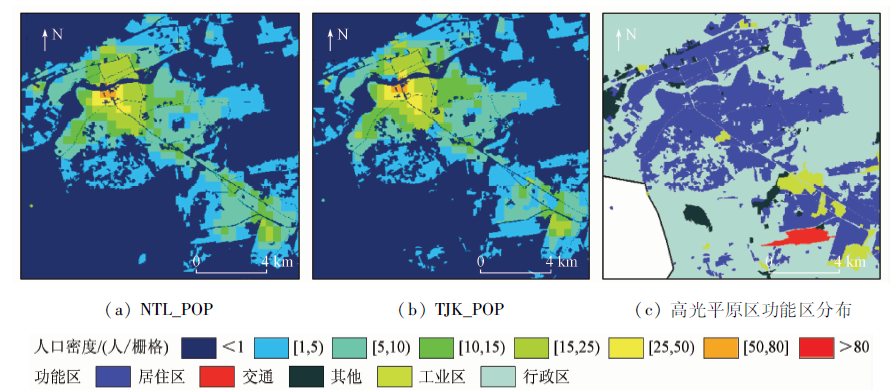
Abstract At present, the commonly used partition modeling of population can reflect the spatial differences and dynamic changes of population distribution. Nevertheless, due to the limitations of methods and data, the population distribution indicators in multi-partition also need to be specifically optimized according to regional characteristics to improve the accuracy of population spatialization. Based on the geographical characteristics of the developing countries along the “Belt and Road”, the authors proposed four geographic partition of high-light plain area, high-light hilly area, low-light plain area and low-light hilly area, and optimized the modeling index of multi-divisional partition through the adjustment of population distribution indicators, fusion of functional area population index and some other means. Finally, Tajikistan was used as the study area to draw a 30 m population distribution map (TJK_POP), and TJK_POP was compared with modeling results of using a single index for each district (NTL_POP and HSI_POP) for verification. The results show that the mean relative error (MRE) of TJK_POP is 22.57%, of which the MRE of the four partition are 28.01%, 19.33%, 17.99%, and 24.97%, respectively. The accuracy is better than that of NTL_POP and HSI_POP. At the same time, TJK_POP reduces the interference of the flowing population of commercial land such as airports and factories on the actual population distribution. The optimization of population distribution indicators for multi-divisional partition in this paper also provides a reference for the study of population spatialization in other similar areas along the “Belt and Road”.
|
| Keywords
Belt and Road
multiple partition
index optimization
functional zone population index
nighttime light
human settlement index
|
|
|
|
Corresponding Authors:
ZHAO Xuesheng
E-mail: xutianyu03@163.com;zxs@cumtb.edu.cn
|
|
Issue Date: 21 July 2021
|
|
|
| [1] |
赵立新, 吴迪. 生态压力人口研究——兼析中国人口与环境关系的地区差异[J]. 人口刊, 2015, 37(6):25-36.
|
| [1] |
Zhao L X, Wu D. A study on the ecological pressure of population:Concurrent analysis on the regional differences of the relationship between population and environment in China[J]. Population Journal, 2015, 37(6):25-36.
|
| [2] |
王培安. 人口新形势与人口研究[J]. 人口研究, 2016, 40(5):3-5.
|
| [2] |
Wang P A. New population situation and population research[J]. Population Research, 2016, 40(5):3-5.
|
| [3] |
Morton T A, Yuan F. Analysis of population dynamics using satellite remote sensing and US census data[J]. Geocarto International, 2009, 24(2):143-163.
doi: 10.1080/10106040802460715
url: http://www.tandfonline.com/doi/abs/10.1080/10106040802460715
|
| [4] |
Zandbergen P A, Ignizio D A. Comparison of dasymetric mapping techniques for small-area population estimates[J]. Cartography and Geographic Information Science, 2010, 37(3):199-214.
doi: 10.1559/152304010792194985
url: http://www.tandfonline.com/doi/abs/10.1559/152304010792194985
|
| [5] |
董南, 杨小唤, 蔡红艳. 人口数据空间化研究进展[J]. 地球信息科学学报, 2016, 18(10):1295-1304.
doi: 10.3724/SP.J.1047.2016.01295
|
| [5] |
Dong N, Yang X H, Cai H Y. Research progress and perspective on the spatialization of population data[J]. Journal of Geo-Information Sciences, 2016, 18(10):1295-1304.
|
| [6] |
柏中强, 王卷乐, 杨飞. 人口数据空间化研究综述[J]. 地理科学进展, 2013, 32(11):1692-1702.
doi: 10.11820/dlkxjz.2013.11.012
|
| [6] |
Bai Z Q, Wang J L, Yang F. Research progress in spatialization of population data[J]. Progress in Geography, 2013, 32(11):1692-1702.
|
| [7] |
Dong N, Yang X, Cai H, et al. Research on grid size suitability of gridded population distribution in urban area:A case study in urban area of Xuanzhou District,China[J]. PloSone, 2017, 12(1):e0170830.
doi: 10.1371/journal.pone.0170830
url: https://dx.plos.org/10.1371/journal.pone.0170830
|
| [8] |
IIimi A, Ahmed F, Anderson E C, et al. New rural access index:Main determinants and correlation to poverty[M]. World Bank Policy Research Working Paper.Washington:World Bank Group, 2016: 7876.
|
| [9] |
田永中, 陈述彭, 岳天祥, 等. 基于土地利用的中国人口密度模拟[J]. 地理学报, 2004(2):283-292.
|
| [9] |
Tian Y Z, Chen S P, Yue T X, et al. Simulation of Chinese population density based on land use[J]. Acta Geographica Sinica, 2004(2):283-292.
|
| [10] |
Wang L, Wang S, Zhou Y, et al. Mapping population density in China between 1990 and 2010 using remote sensing[J]. Remote Sensing of Environment, 2018, 210:269-281.
doi: 10.1016/j.rse.2018.03.007
url: https://linkinghub.elsevier.com/retrieve/pii/S0034425718301007
|
| [11] |
王明明, 王卷乐. 基于夜间灯光与土地利用数据的山东省乡镇级人口数据空间化[J]. 地球信息科学学报, 2019, 21(5):699-709.
doi: 10.12082/dqxxkx.2019.180497
|
| [11] |
Wang M M, Wang J L. Spatialization of township-level population based on nighttime light and land use data in Shandong Province[J]. Journal of Geo-Information Science, 2019, 21(5):699-709.
|
| [12] |
鲁楠, 张委伟, 陈利军, 等. 顾及城乡差异的大区域人口密度估算——以山东省为例[J]. 测绘学报, 2015, 44(12):1384-1391.
|
| [12] |
Lu N, Zhang W W, Chen L J, et al. Estimation of large regional urban and rural population density based on the differences of population distribution between urban and rural:Taking Shandong Province as example[J]. Acta Geodaetica et Cartographica Sinica, 2015, 44(12):1384-1391.
|
| [13] |
Sun W, Zhang X, Wang N, et al. Estimating population density using DMSP-OLS night-time imagery and land cover data[J]. IEEE Journal of Selected Topics in Applied Earth Observations and Remote Sensing, 2017, 10(6):2674-2684.
doi: 10.1109/JSTARS.4609443
url: https://ieeexplore.ieee.org/xpl/RecentIssue.jsp?punumber=4609443
|
| [14] |
Gaughan A E, Stevens F R, Huang Z, et al. Spatiotemporal patterns of population in mainland China,1990 to 2010[J]. Scientific Data, 2016, 3:160005.
doi: 10.1038/sdata.2016.5
pmid: 26881418
|
| [15] |
郭晓莹, 唐雨竹. 基于DMSP/OLS夜间灯光数据的东三省城市人口估算及精度分析[J]. 国土与自然资源研究, 2019(4):44-46.
|
| [15] |
Guo X Y, Tang Y Z. Urban population estimation and accuracy analysis of Three Northeastern Provinces based on DMSP/OLS night light data[J]. Territory & Natural Resources Study, 2019(4):44-46.
|
| [16] |
肖东升, 杨松. 基于夜间灯光数据的人口空间分布研究综述[J]. 国土资源遥感, 2019, 31(3):10-19.doi: 10.6046/gtzyyg.2019.03.02.
doi: 10.6046/gtzyyg.2019.03.02
|
| [16] |
Xiao D S, Yang S. A review of population spatial distribution based on nighttime light data[J]. Remote Sensing for Land and Resources, 2019, 31(3):10-19.doi: 10.6046/gtzyyg.2019.03.02.
doi: 10.6046/gtzyyg.2019.03.02
|
| [17] |
Karunarathne A, Lee G. Estimating hilly areas population using a dasymetric mapping approach:A case of Sri Lanka’s highest mountain range[J]. ISPRS International Journal of Geo-Information, 2019, 8(4):166.
doi: 10.3390/ijgi8040166
url: https://www.mdpi.com/2220-9964/8/4/166
|
| [18] |
卓莉, 陈晋, 史培军, 等. 基于夜间灯光数据的中国人口密度模拟[J]. 地理学报, 2005(2):266-276.
|
| [18] |
Zhuo L, Chen J, Shi P J, et al.Modelling population density of China in 1998 based on DMSP/OLS nighttime light image[J]. Acta Geographica Sinica, 2005(2):266-276.
|
| [19] |
Song J, Tong X, Wang L, et al. Monitoring finer-scale population density in urban functional zones:A remote sensing data fusion approach[J]. Landscape and Urban Planning, 2019, 190:103580.
doi: 10.1016/j.landurbplan.2019.05.011
url: https://linkinghub.elsevier.com/retrieve/pii/S0169204619301513
|
| [20] |
赵鑫, 宋英强, 刘轶伦, 等. 基于卫星遥感和POI数据的人口空间化研究——以广州市为例[J]. 热带地理, 2020, 40(1):101-109.
|
| [20] |
Zhao X, Song Y Q, Liu Y L, et al. Population spatialization based on satellite remote sensing and POI data:Regarding Guangzhou as an example[J]. Tropical Geography, 2020, 40(1):101-109.
|
| [21] |
刘卫东. “一带一路”战略的科学内涵与科学问题[J]. 地理科学进展, 2015, 34(5):538-544.
doi: 10.11820/dlkxjz.2015.05.001
|
| [21] |
Liu W D. Scientific understanding of the Belt and Road Initiative of China and related research themes[J]. Progress in Geography, 2015, 34(5):538-544.
|
|
Viewed |
|
|
|
Full text
|
|
|
|
|
Abstract
|
|
|
|
|
Cited |
|
|
|
|
| |
Shared |
|
|
|
|
| |
Discussed |
|
|
|
|
 2021,
Vol. 33
2021,
Vol. 33
 ), ZHAO Xuesheng(