|
|
|
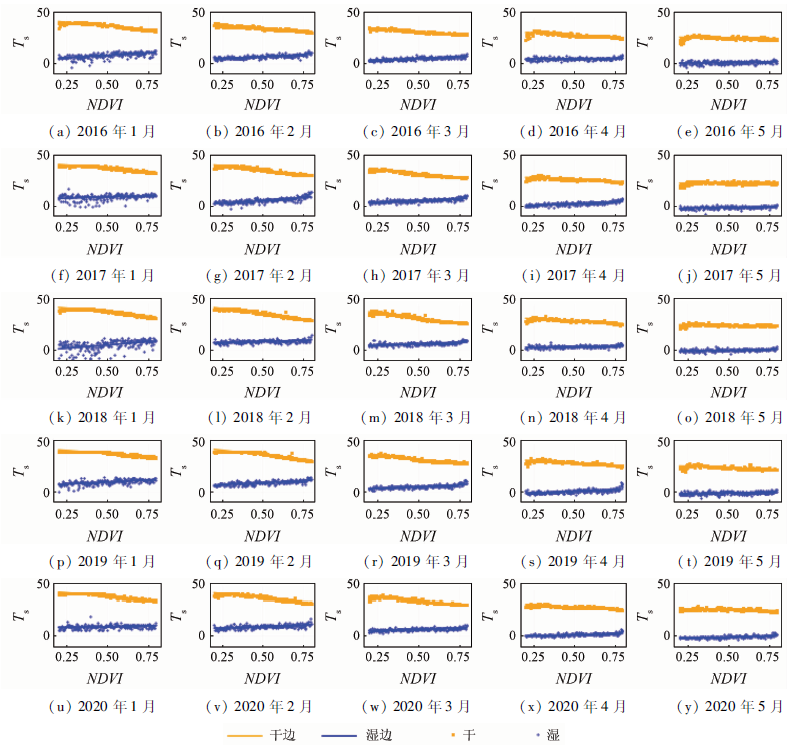
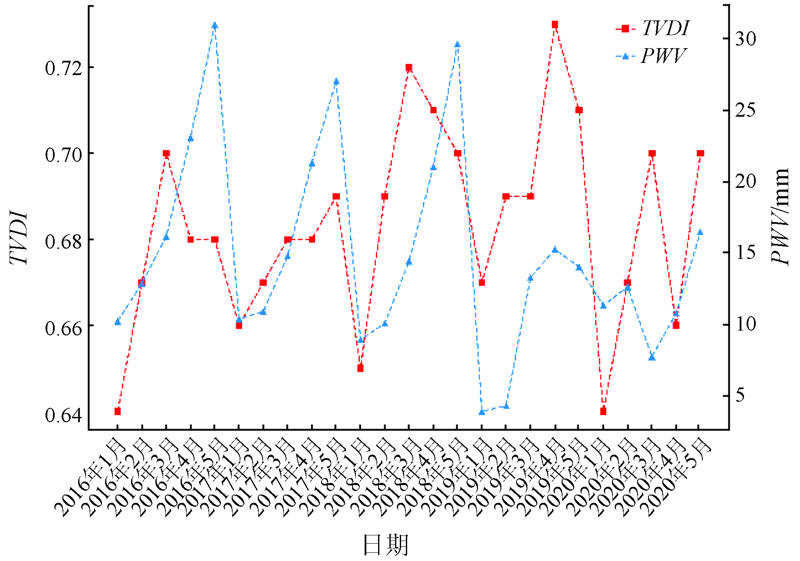
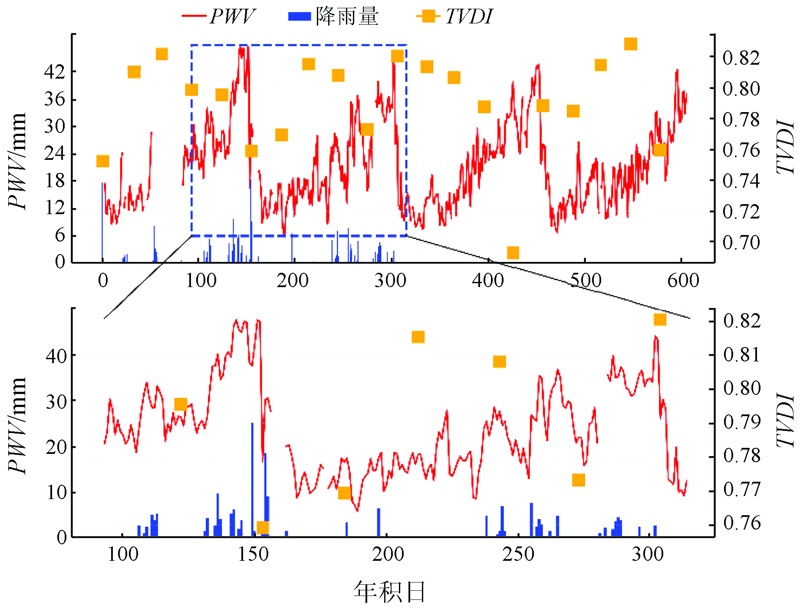
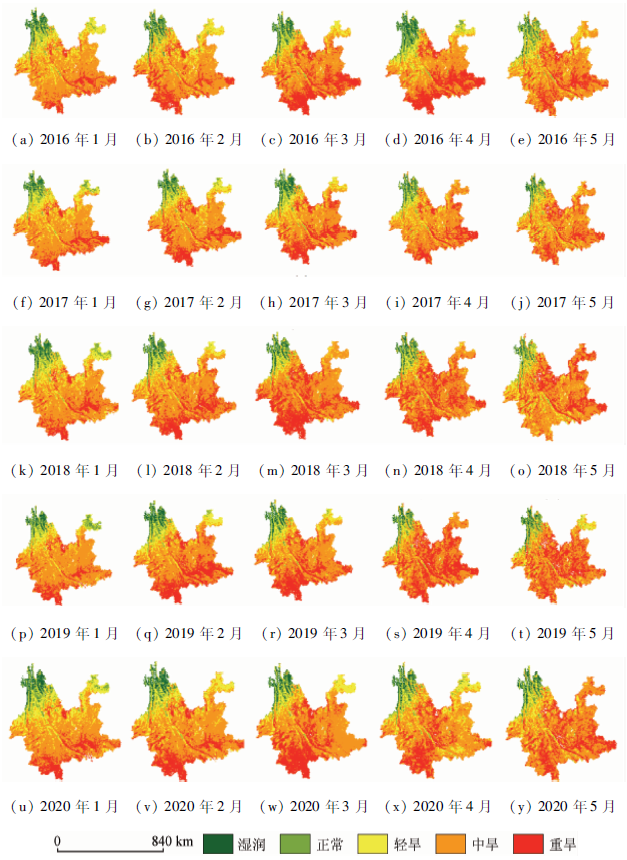
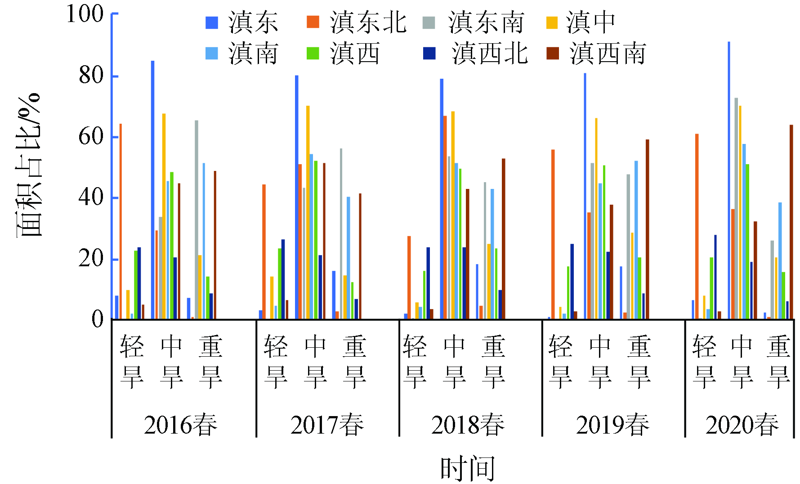
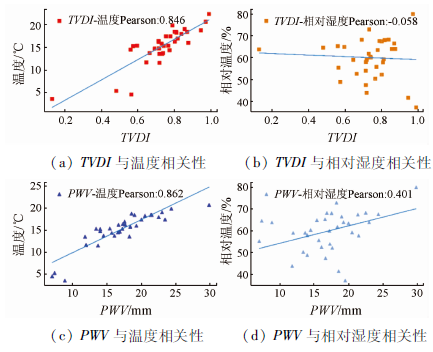
Abstract Existing drought monitoring technologies are liable to be affected by the environment and suffer poor timeliness. Given this, this study utilized the MODIS_TVDI and GNSS_PWV data to investigate the spatial-temporal changes in the drought characteristics in spring from 2016 to 2020 in Yunnan province through correlation analysis and regression analysis. The research results are as follows. The TVDI inversion results can accurately reflect the spatial-temporal changes in the regional drought characteristics during 2016—2020. In space, the drought showed the trend of increasing from northwest to southeast in Yunnan. In terms of time, the drought increased first and then alleviated in spring, especially from March to April. In addition, there was a strong correlation between PWV and TVDI according to Pearson correlation analysis. The correlation coefficient was largely greater than 0.5 on a quarterly scale. On a monthly scale, the variation trend of PWV was roughly consistent with that of TVDI, except that the variation of TVDI showed a certain time delay. On a daily scale, the variation amplitude of PWV was highly consistent with that of TVDI, especially during rainfall, and both of them showed certain signals of drought characteristics. Therefore, PWV can serve as a new technical means for drought monitoring.
|
| Keywords
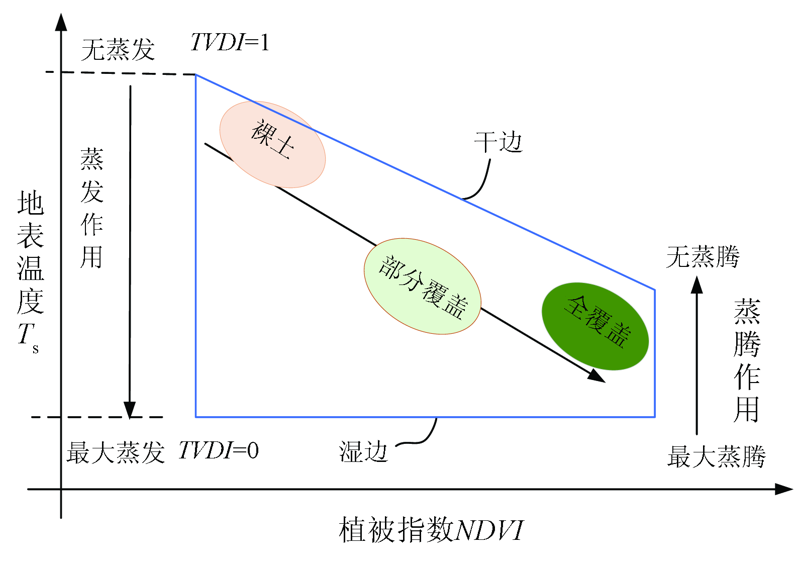
temperature vegetation drought index
precipitable water vapor
correlation analysis
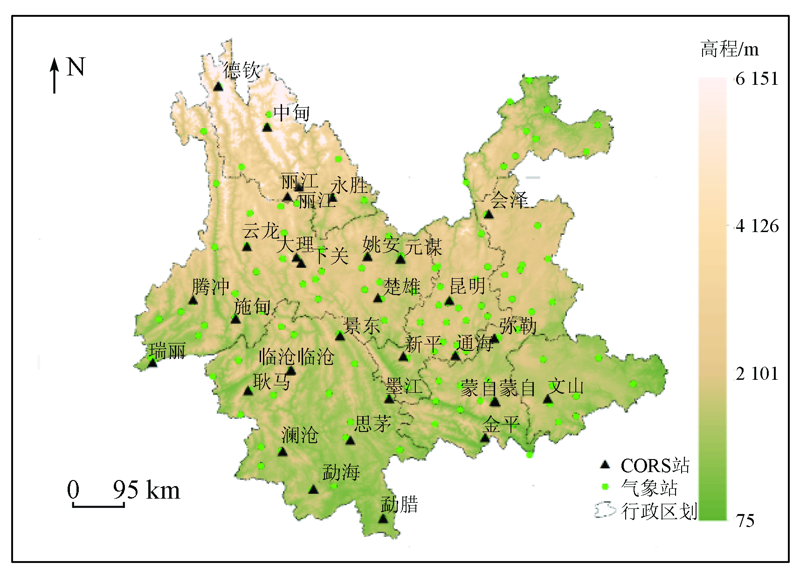
Yunnan Province
|
|
|
|
Corresponding Authors:
KE Fuyang
E-mail: 2232446236@qq.com;ke.fuyang@qq.com
|
|
Issue Date: 24 September 2021
|
|
|
| [1] |
余航, 王龙, 文俊, 等. 云南省500年干旱灾害时空分布研究[J]. 干旱区资源与环境, 2014, 28(12):38-44.
|
| [1] |
Yu H, Wang L, Wen J, et al. Study on spatial and temporal distribution of drought disaster in 500 years in Yunnan Province[J]. Journal of Arid Land Resources and Environment, 2014, 28(12):38-44.
|
| [2] |
李新尧, 杨联安, 聂红梅, 等. 基于植被状态指数的陕西省农业干旱时空动态[J]. 生态学杂志, 2018, 37(4):1172-1180.
|
| [2] |
Li X Y, Yang L A, Nie H M, et al. Assessment of temporal and spatial dynamics of agricultural drought in Shaanxi Province based on vegetation condition index[J]. Journal of Ecology, 2018, 37(4):1172-1180.
|
| [3] |
赵杰鹏, 张显峰, 廖春华, 等. 基于TVDI的大范围干旱区土壤水分遥感反演模型研究[J]. 遥感技术与应用, 2011, 26(6):742-750.
|
| [3] |
Zhao J P, Zhang X F, Liao C H, et al. TVDI based soil moisture retrieval from remotely sensed data over large arid areas[J]. Remote Sensing Technology and Application, 2011, 26(6):742-750.
|
| [4] |
沙莎, 郭铌, 李耀辉, 等. 温度植被干旱指数(TVDI)在陇东土壤水分监测中的适用性[J]. 中国沙漠, 2017, 37(1):132-139.
|
| [4] |
Sha S, Guo N, Li Y H, et al. Applicability of TVDI in monitoring drought in Longdong area of Gansu,China[J]. Journal of Desert Research, 2017, 37(1):132-139.
|
| [5] |
王美林, 姜群鸥, 邵雅琪, 等. 基于TVDI的玛曲土壤湿度时空变化及其影响因素[J]. 中国水土保持科学, 2019, 17(4):141-152.
|
| [5] |
Wang M L, Jiang Q O, Shao Y Q, et al. Spatio-temporal variation of soil moisture and analysis on its influencing factors in Maqu county based on TVDI[J]. Science of Soil and Water Conservation, 2019, 17(4):141-152.
|
| [6] |
刘英, 岳辉, 侯恩科. MODIS数据在陕西省干旱监测中的应用[J]. 国土资源遥感, 2019, 31(2):172-179.doi: 10.6046/gtzyyg.2019.02.24.
doi: 10.6046/gtzyyg.2019.02.24
|
| [6] |
Liu Y, Yue H, Hou E K. Drought monitoring based on MODIS in Shaanxi[J]. Remote Sensing for Land and Resources, 2019, 31(2):172-179.doi: 10.6046/gtzyyg.2019.02.24.
doi: 10.6046/gtzyyg.2019.02.24
|
| [7] |
黄振, 李万彪, 梁军. GPS遥感大气可降水量在降水天气过程分析中的应用[J]. 气象与环境学报, 2013, 29(4):31-36.
|
| [7] |
Huang Z, Li W B, Liang J. Application of precipitable water vapor from ground based GPS data to analysis of precipitation weather process[J]. Journal of Meteorology and Environment, 2013, 29(4):31-36.
|
| [8] |
金鑫, 施昆, 陈云波, 等. GPS可降水汽含量在强降雨过程中的特征分析[J]. 全球定位系统, 2018, 43(2):69-75.
|
| [8] |
Jin X, Shi K, Chen Y B, et al. Analysis on the characteristics of GPS precipitable water vapor during heavy rainfall[J]. GNSS World of China, 2018, 43(2):69-75.
|
| [9] |
刘盼, 刘智敏, 张明敏, 等. 不同IGS星历产品对地基GPS反演水汽的影响[J]. 测绘科学, 2018, 43(12):17-22.
|
| [9] |
Liu P, Liu Z M, Zhang M M, et al. Influence of different IGS ephemeris products on GPS of precipitable water vapor inversion[J]. Science of Surveying and Mapping, 2018, 43(12):17-22.
|
| [10] |
韩辉邦, 张小军, 张博越, 等. 柴达木盆地GPS大气可降水量精度检验及其变化特征[J]. 干旱气象, 2020, 38(1):50-57.
|
| [10] |
Han H B, Zhang X J, Zhang B Y, et al. Accuracy test of precipitable water vapor retrieved by GPS data and its variation characteristic in Qaidam Basin[J]. Journal of Arid Meteorology, 2020, 38(1):50-57.
|
| [11] |
F Alshawaf, F Zus, K Balidakis, et al. On the statistical significance of climatic trends estimated from GPS tropospheric time series[J]. Journal of Geophysical Research:Atmospheres, 2018, 123(19):10967-10990.
doi: 10.1029/2018JD028703
url: http://doi.wiley.com/10.1029/2018JD028703
|
| [12] |
Wang X M, Zhang K F, Wu S Q, et al. The correlation between GNSS-derived precipitable water vapor and sea surface temperature and its responses to El Niño-Southern oscillation[J]. Remote Sensing of Environment, 2018, 2(16):1-12.
doi: 10.1016/0034-4257(71)90072-1
url: https://linkinghub.elsevier.com/retrieve/pii/0034425771900721
|
| [13] |
胡顺石, 黄春晓, 杨斌, 等. 自适应加权Savitzky-Golay滤波重构MODIS植被指数时间序列[J]. 测绘科学, 2020, 45(4):105-116.
|
| [13] |
Hu S S, Huang C X, Yang B, et al. Reconstruction of MODIS vegetation index time series by adaptive weighted Savitzky-Golay filter[J]. Science of Surveying and Mapping, 2020, 45(4):105-116.
|
| [14] |
吕凯, 吕成文, 乔天, 等. 地表温度合成方式对TVDI预测精度影响[J]. 遥感信息, 2019, 34(2):91-97.
|
| [14] |
Lyu K, Lyu C W, Qiao T, et al. Effect of LST synjournal methods on prediction accuracy of TVDI[J]. Remote Sensing Information, 2019, 34(2):91-97.
|
| [15] |
Sandholt I, Rasmussen K, Andersen J. A simple interpretation of the surface temperature vegetation index space for assessment of surface moisture status[J]. Remote Sensing of Environment, 2002, 79(2):213-224.
doi: 10.1016/S0034-4257(01)00274-7
url: https://linkinghub.elsevier.com/retrieve/pii/S0034425701002747
|
| [16] |
Price J C. Using spatial context in satellite data to infer regional scale evapotranspiration[J]. IEEE Transactions on Geoscience and Remote Sensing, 1990, 28(5):940-948.
doi: 10.1109/36.58983
url: http://ieeexplore.ieee.org/document/58983/
|
| [17] |
Nemani R, L Pierce, S Running, et al. Developing satellite-derived estimates of surface moisture status[J]. Journal of Applied Meteorology and Climatology, 1993, 32(3):548-557.
|
| [18] |
Michael B, Steven B, Thomas A H, et al. GPS Meteorology:Remote sensing of atmospheric water vapor using the global positioning system[J]. Geophysical Research Letters, 1992, 97(D14):15787-15801.
|
| [19] |
李黎, 田莹, 袁志敏, 等. 暴雨期间GNSS遥感气象要素的时序变化[J]. 测绘科学, 2016, 41(10):82-87.
|
| [19] |
Li L, Tian Y, Yuan Z M, et al. Time series changes of GNSS remote sensing meteorological elements during rainstorms[J]. Science of Surveying and Mapping, 2016, 41(10):82-87.
|
| [20] |
侯建国, 杨成生, 张勤, 等. GPS可降水汽与MODIS可降水汽回归性分析[J]. 地理与地理信息科学, 2010, 26(2):42-45,113.
|
| [20] |
Hou J G, Yang C S, Zhang Q, et al. Regression analysis between GPS PWV and MODIS PWV[J]. Geography and Geo-Information Science, 2010, 26(2):42-45,113.
|
| [21] |
孙丽, 吴全, 裴志远, 等. 温度植被干旱指数(TVDI)与多因子关系研究[J]. 地理与地理信息科学, 2010, 26(2):31-34,88.
|
| [21] |
Sun L, Wu Q, Pei Z Y, et al. Study on the correlation between temperature vegetation dryness index (TVDI) and various factors[J]. Geography and Geo-Information Science, 2010, 26(2):31-34,88.
|
| [22] |
马雄伟, 赵庆志, 姚顽强, 等. PWV对全球气候变化的响应研究[J]. 测绘通报, 2019, 65(8):54-59.
|
| [22] |
Ma X W, Zhao Q Z, Yao W Q, et al. PWV response to global climate change[J]. Bulletin of Surveying and Mapping, 2019, 65(8):54-59.
|
| [23] |
齐述华, 王长耀, 牛铮. 利用温度植被旱情指数(TVDI)进行全国旱情监测研究[J]. 遥感学报, 2003, 18(5):420-427,436.
|
| [23] |
Qi S H, Wang C Y, Niu Z. Evaluating soil moisture status in China using the temperature/vegetation dryness index (TVDI)[J]. Journal of Remote Sensing, 2003, 18(5):420-427,436.
|
| [24] |
曹影, 胡文庆, 颜培东. 基于温度植被干旱指数(TVDI)的云南干旱遥感监测[J]. 工程勘察, 2016, 44(1):69-73.
|
| [24] |
Cao Y, Hu W Q, Yan P D. Remote sensing monitoring of the drought based on temperature vegetation dryness index in Yunnan Province[J]. Geotechnical Investigation & Surveying, 2016, 44(1):69-73.
|
|
Viewed |
|
|
|
Full text
|
|
|
|
|
Abstract
|
|
|
|
|
Cited |
|
|
|
|
| |
Shared |
|
|
|
|
| |
Discussed |
|
|
|
|
 2021,
Vol. 33
2021,
Vol. 33
 ), KE Fuyang1(