|
|
 |
|

|
|
|
LST reversion and downscaling based on FY-3D/MWRI L1B brightness temperature data |
ZHU Yuxin1( ), WU Menxin2(), BAO Yansong3, LI Xinchuan1, ZHANG Jinzong1 ), WU Menxin2(), BAO Yansong3, LI Xinchuan1, ZHANG Jinzong1 |
1. School of Urban and Environmental Sciences, Huaiyin Normal University, Huaian 223300, China
2. National Meteorological Centre, Beijing 100081, China
3. School of Atmospheric Physics,Nanjing University of Information Science & Technology, Nanjing 210044, China |
|
|
|
|
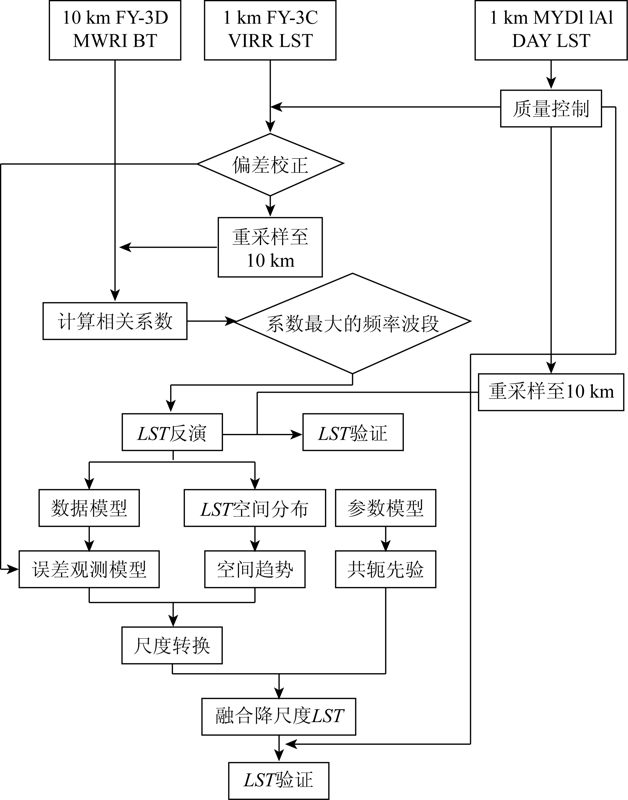
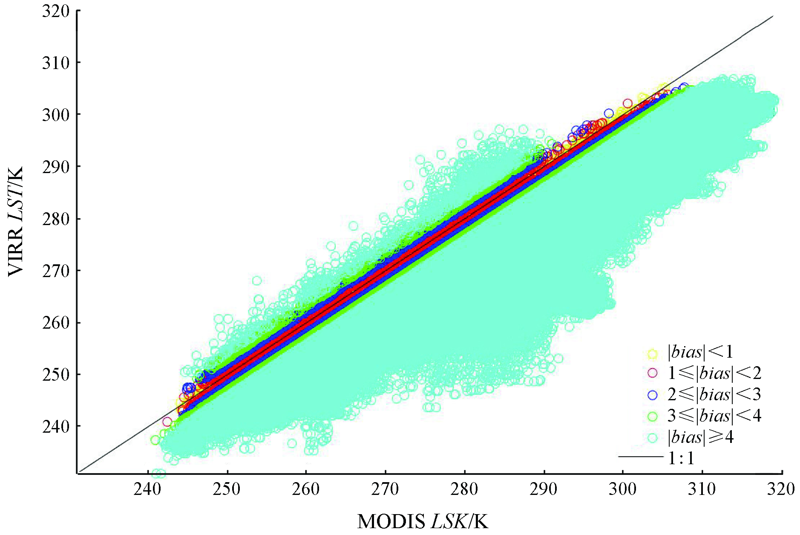
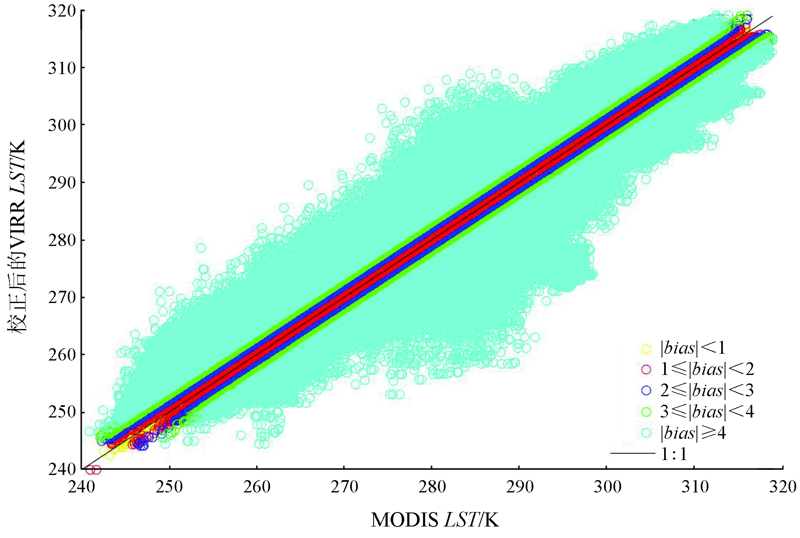
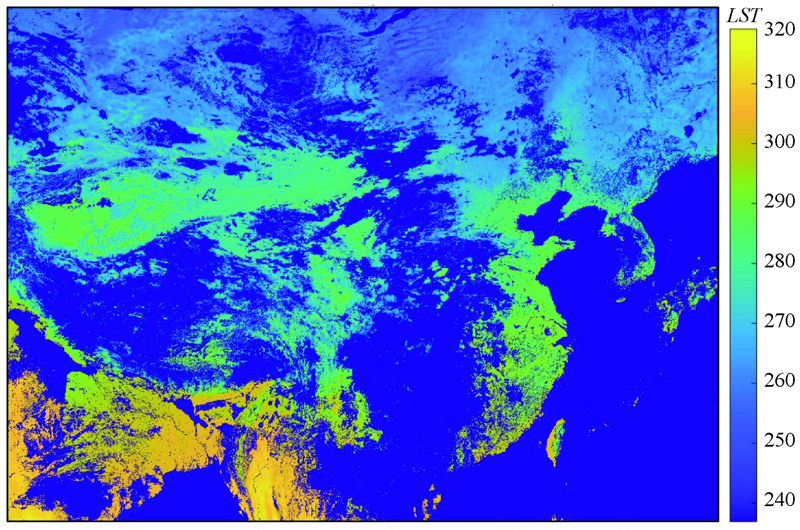
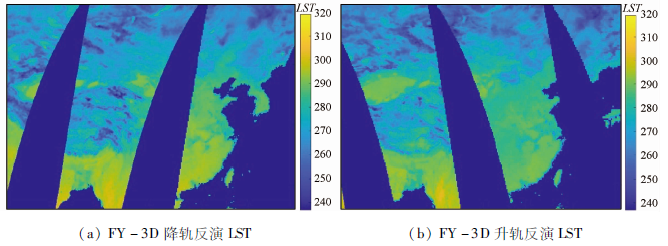
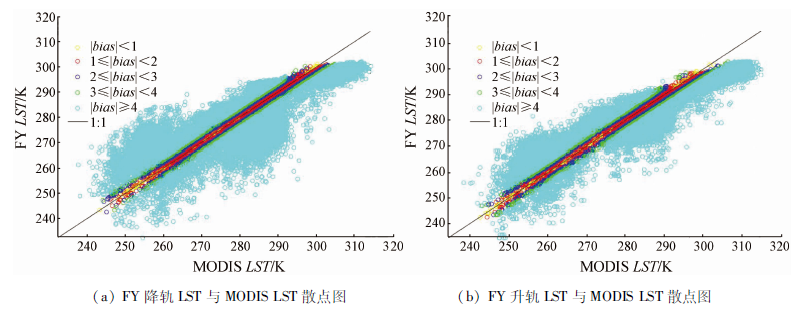
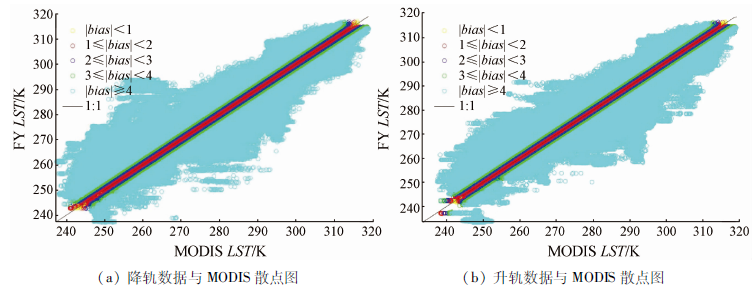
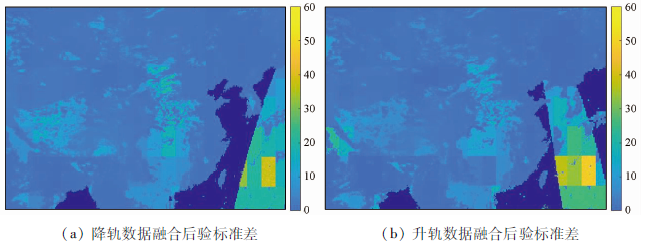
Abstract Based on FY-3C VIRR LST and FY-3D/MWRI L1B brightness temperature data of February 1, 2020 and taking the area with geographical coordinates of 18°~54°N, 73°~135°E as an example, the LST reversion and downscaling based on the FY-3D/MWRI L1B data were studied using a statistical regression model and a hierarchical Bayesian fusion model. As a result, two models were constructed, namely a LST binary linear regression inversion model based on FY-3D single-channel horizontal and vertical polarization-corrected brightness temperature data and a hierarchical Bayesian fusion downscaling model based on FY-3D retrieved LST and FY-3C VIRR LST. They were verified with the LST on the day of MYD11A1 as reference data, obtaining the following results. As for the reversion statistical model, the mean bias, error standard deviation, and root mean square error were -1.28 K, 8.85 K, and 8.85 K, respectively for the FY-3D descending data and were -0.81 K, 6.74 K, and 6.78 K, respectively for the FY-3D ascending data. As for the hierarchical Bayesian fusion downscaling model, the mean bias, error standard deviation, and root mean square error were 0.50 K, 5.45 K, and 5.41 K, respectively for the FY-3D descending data and were 0.25 K, 5.54 K, and 5.54 K, respectively for the FY-3D ascending data. This study will provide a novel idea for the LST inversion and downscaling of passive microwaves.
|
| Keywords
FY-3D MWRI
VIRR LST
hierarchical Bayesian
statistical regression
downscaling
|
|
|
|
Corresponding Authors:
WU Menxin
E-mail: zhuyuxin_402@163.com;wumx@cma.gov.cn
|
|
Issue Date: 24 September 2021
|
|
|
| [1] |
刘晶, 马红章, 杨乐, 等. 基于被动微波的地表温度反演研究综述[J]. 遥感技术与应用, 2012, 27(6):812-821.
|
| [1] |
Liu J, Ma H Z, Yang L, et al. A survey of surface temperature retrieval by passive microwave remote sensing[J]. Remote Sensing Technology and Application, 2012, 27(6):812-821.
|
| [2] |
Wan Z, Zhang Y, Zhang Q, et al. Quality assessment and validation of the MODIS global land surface temperature[J]. International Journal of Remote Sensing, 2004, 25(1):261-274.
doi: 10.1080/0143116031000116417
url: https://www.tandfonline.com/doi/full/10.1080/0143116031000116417
|
| [3] |
Li Z L, Tang B H, Wu H, et al. Satellite-derived land surface temperature:Current status and perspectives[J]. Remote Sensing of Environment, 2013, 131(131):14-37.
doi: 10.1016/j.rse.2012.12.008
url: https://linkinghub.elsevier.com/retrieve/pii/S0034425712004749
|
| [4] |
Duan S B, Li Z L, Leng P. A framework for the retrieval of all-weather land surface temperature at a high spatial resolution from polar-orbiting thermal infrared and passive microwave data[J]. Remote Sensing of Environment:An Interdisciplinary Journal, 2017,(195):107-117.
|
| [5] |
刘礼杨, 苏泳娴, 陈修治, 等. 一种针对旱季与雨季差异的AMSR-E被动微波遥感地表温度反演经验模型[J]. 热带地理, 2017, 37(3):434-442.
|
| [5] |
Liu L Y, Su Y X, Chen X Z, et al. AMSR-E passive microwave remote sensing surface temperature inversion experimental model focused on differences between dry season and rainy season[J]. Tropical Geography, 2017, 37(3):434-442.
|
| [6] |
Mcfarland M J, Miller R L, Neale C M U. Land surface temperature derived from the SSM/I passive microwave brightness temperatures[J]. IEEE Transactions on Geoence & Remote Sensing, 1990, 28(5):839-845.
|
| [7] |
Njoku E G, Li L. Retrieval of land surface parameters using passive microwave measurements at 6-18 GHz[J]. IEEE Transactions on Geoence & Remote Sensing, 1999, 37(1):79-93.
|
| [8] |
刘曾林, 唐伯惠, 李召良. AMSR-E微波数据反演裸地地表温度算法研究[J]. 科技导报, 2009, 27(4):24-27.
|
| [8] |
Liu C L, Tang B H, Li Z L. Calculation of land surface temperature based on AMSR-E data[J]. Science & Technology Review, 2009, 27(4):24-27.
|
| [9] |
毛克彪, 施建成, 李召良, 等. 用被动微波AMSR数据反演地表温度及发射率的方法研究[J]. 国土资源遥感, 2005, 17(3):14-17.doi: 10.6046/gtzyyg.2005.03.04.
doi: 10.6046/gtzyyg.2005.03.04
|
| [9] |
Mao K B, Shi J C, Li Z L, et al. The land surface temperature and emissivity retrieved from the AMSR passive microwave data[J]. Remote Sensing for Land and Resources, 2005, 17(3):14-17.doi: 10.6046/gtzyyg.2005.03.04.
doi: 10.6046/gtzyyg.2005.03.04
|
| [10] |
毛克彪, 施建成, 李召良, 等. 一个针对被动微波AMSR-E数据反演地表温度的物理统计算法[J]. 中国科学:地球科学, 2006, 36(12):1170-1176.
|
| [10] |
Mao K B, Shi J C, Li Z L, et al. A physical statistical algorithm for land surface temperature retrieval from passive microwave AMSR-E data[J]. Science in China Ser.D Earth Sciences, 2006, 36(12):1170-1176.
|
| [11] |
武胜利, 杨虎. AMSR-E亮温数据与MODIS陆表分类产品结合反演全球陆表温度[J]. 遥感技术与应用, 2007, 22(2):234-237.
|
| [11] |
Wu S L, Yang H. Global land surface temperature retrieval with AMSR-E brightness temperature and MODIS land cover type products[J]. Remote Sensing Technology and Application, 2007, 22(2):234-237.
|
| [12] |
潘广东, 王超, 田国良. SSM/I微波辐射计数据陆面温度反演[J]. 遥感学报, 2001, 5(4):254-258.
|
| [12] |
Pan G D, Wang C, Tian G L. Land surface temperature retrieval with SSM/I data[J]. Journal of Remote Sensing, 2001, 5(4):254-258.
|
| [13] |
Zhu Y X, Kang E L, Bo Y C, et al. Hierarchical bayesian model based on robust fixed rank filter for fusing MODIS SST and AMSR-E SST[J]. Photogrammetric Engineering and Remote Sensing, 2019, 85(2):119-131.
doi: 10.14358/PERS.85.2.119
url: https://www.ingentaconnect.com/content/10.14358/PERS.85.2.119
|
| [14] |
Zhu Y X, Bo Y C, Zhang J Z, et al. Fusion of Multisensor SSTs Based on the Spatiotemporal Hierarchical Bayesian Model[J]. Journal of Atmospheric & Oceanic Technology, 2018, 35(1):91-109.
|
|
Viewed |
|
|
|
Full text
|
|
|
|
|
Abstract
|
|
|
|
|
Cited |
|
|
|
|
| |
Shared |
|
|
|
|
| |
Discussed |
|
|
|
|
 2021,
Vol. 33
2021,
Vol. 33