|
|
 |
|

|
|
|
Exploring the spatio-temporal distributions of industrial parks in Xining City from the perspective of buildings made of color steel plates |
LI Yuqing1( ), YANG Shuwen1,2,3(), HONG Weili1, SU Hang1, LUO Yawen1 ), YANG Shuwen1,2,3(), HONG Weili1, SU Hang1, LUO Yawen1 |
1. Faculty of Geomatics, Lanzhou Jiaotong University, Lanzhou 730700, China
2. National - Local Joint Engineering Research Center for Application of Technologies and Applications for National Geographic State Monitoring, Lanzhou 730070, China
3. Gansu Provincial Engineering Laboratory for National Geographic State Monitoring, Lanzhou 730070, China |
|
|
|
|
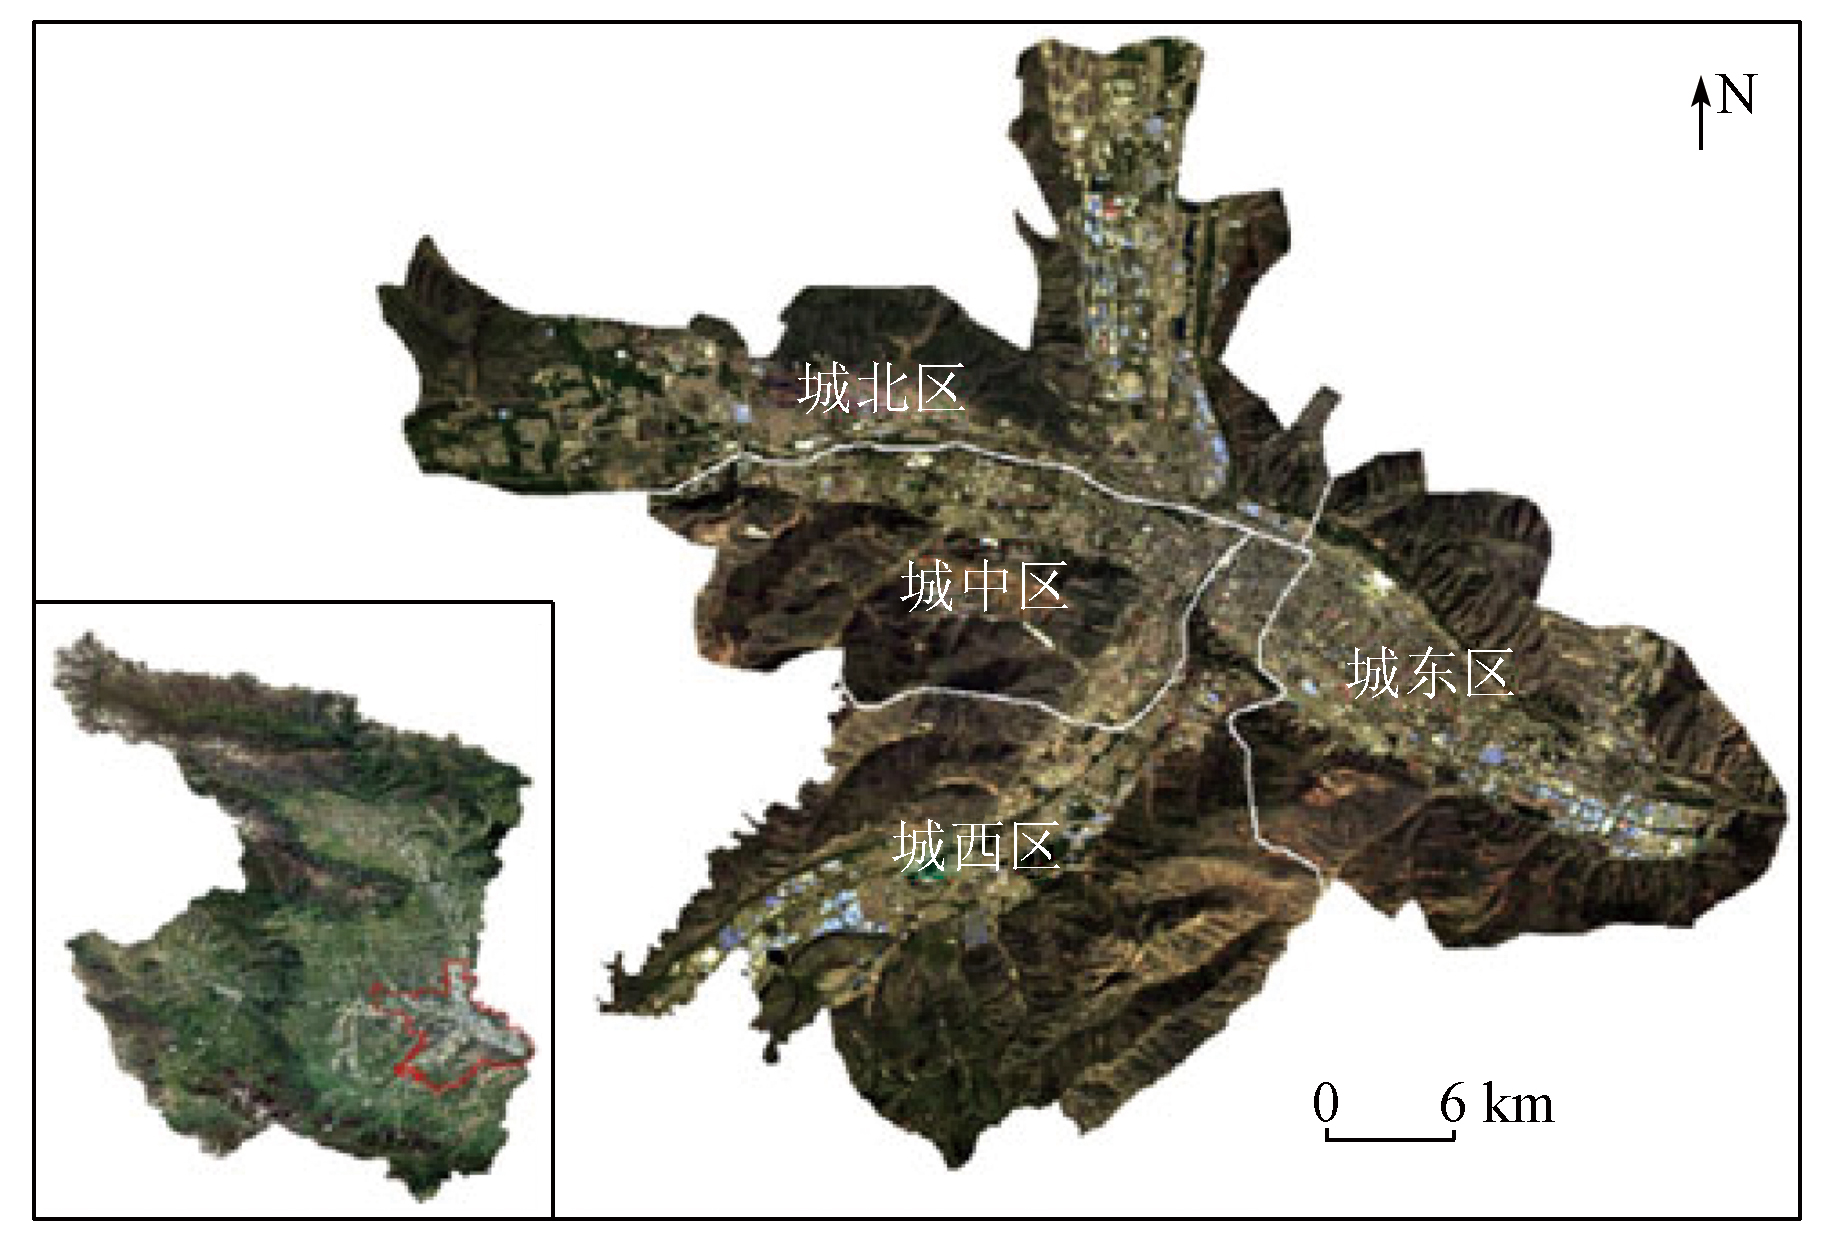
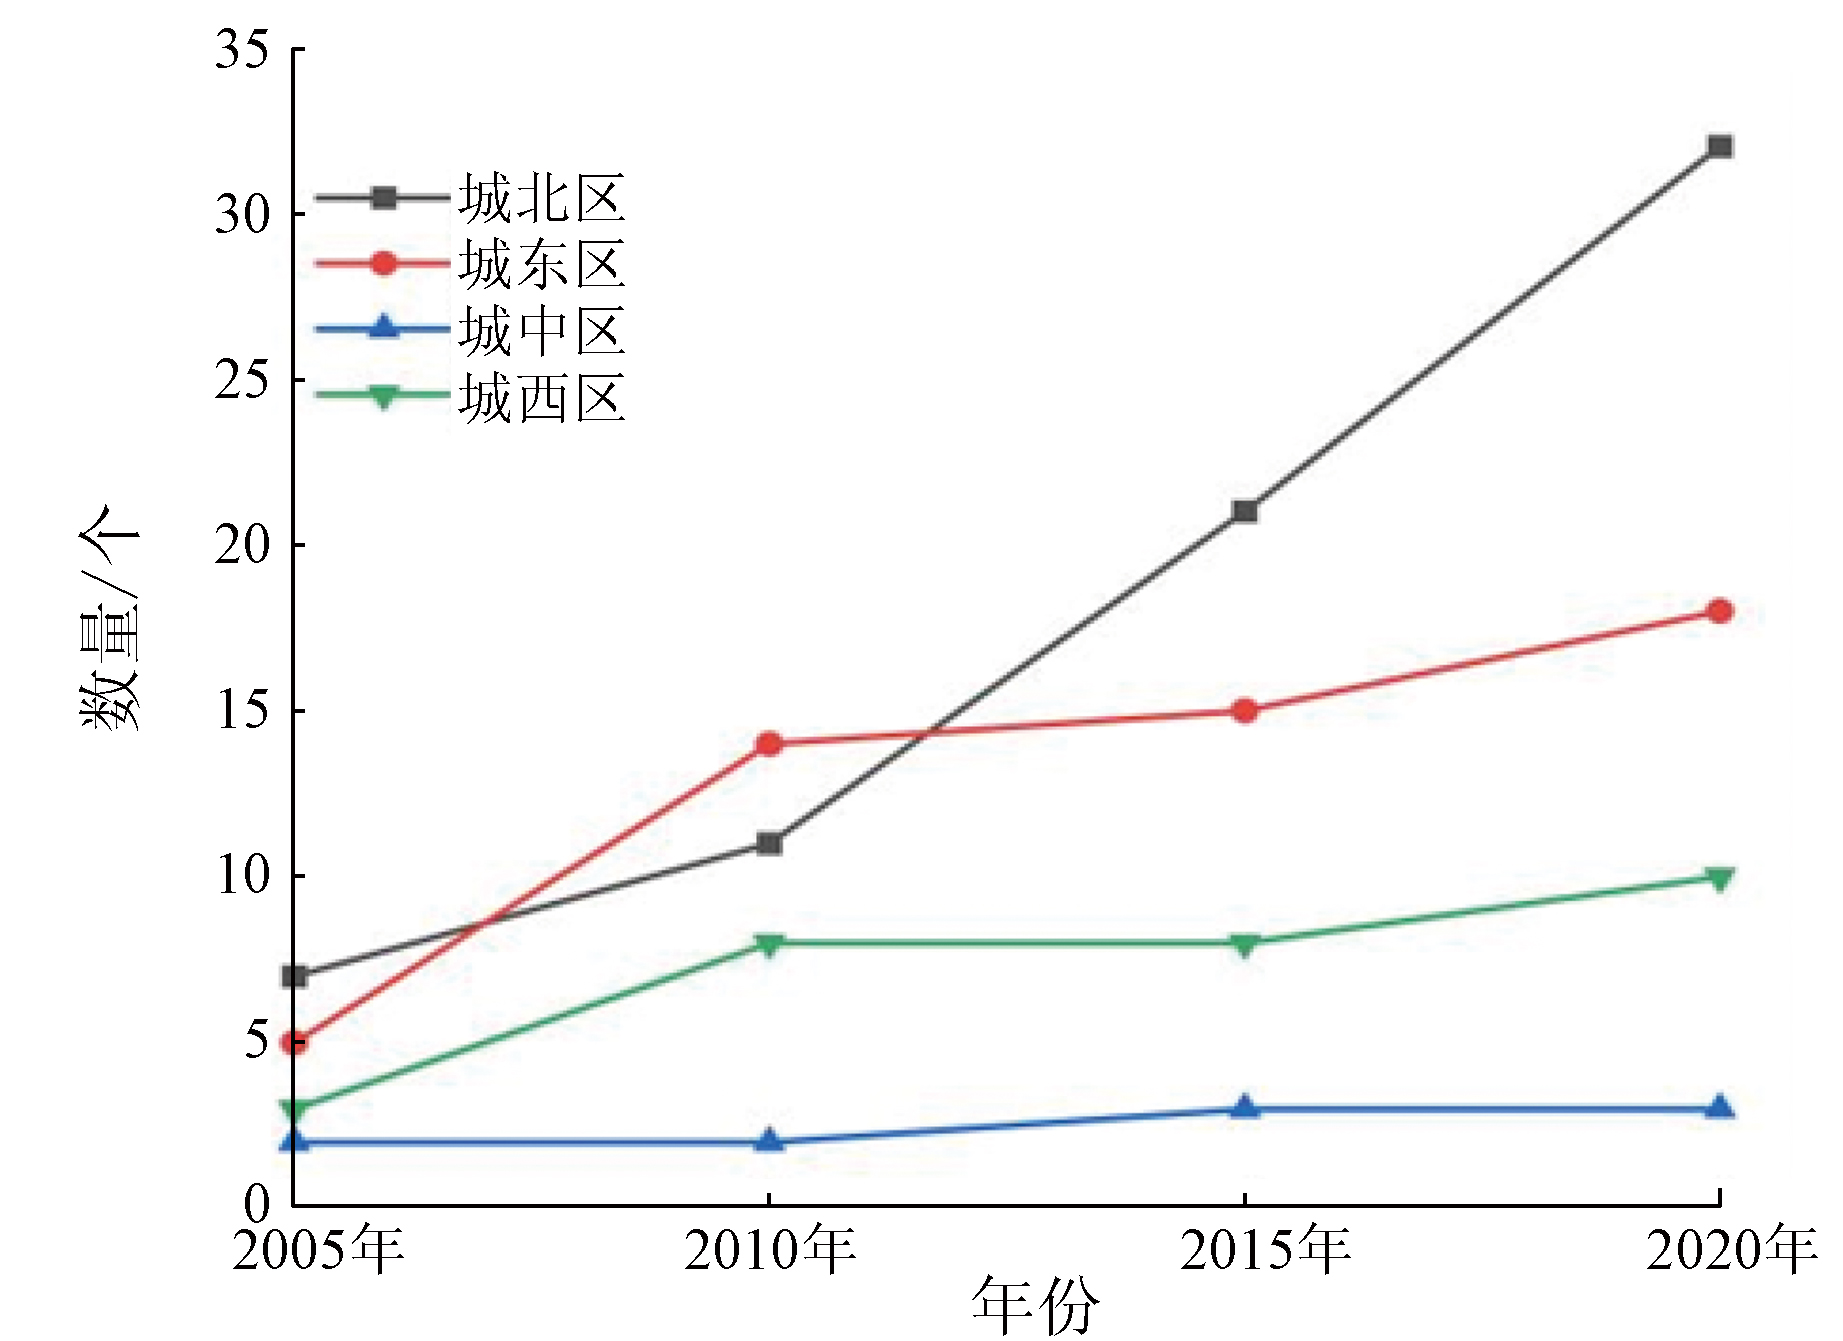
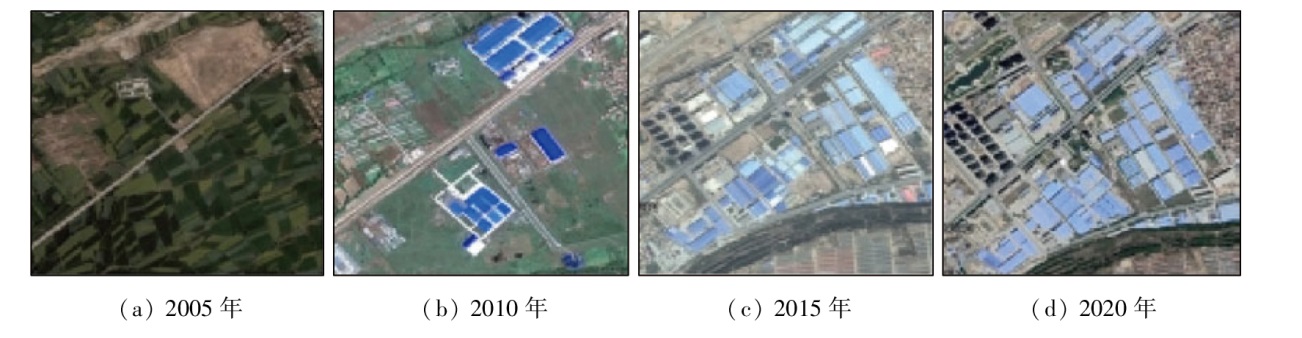
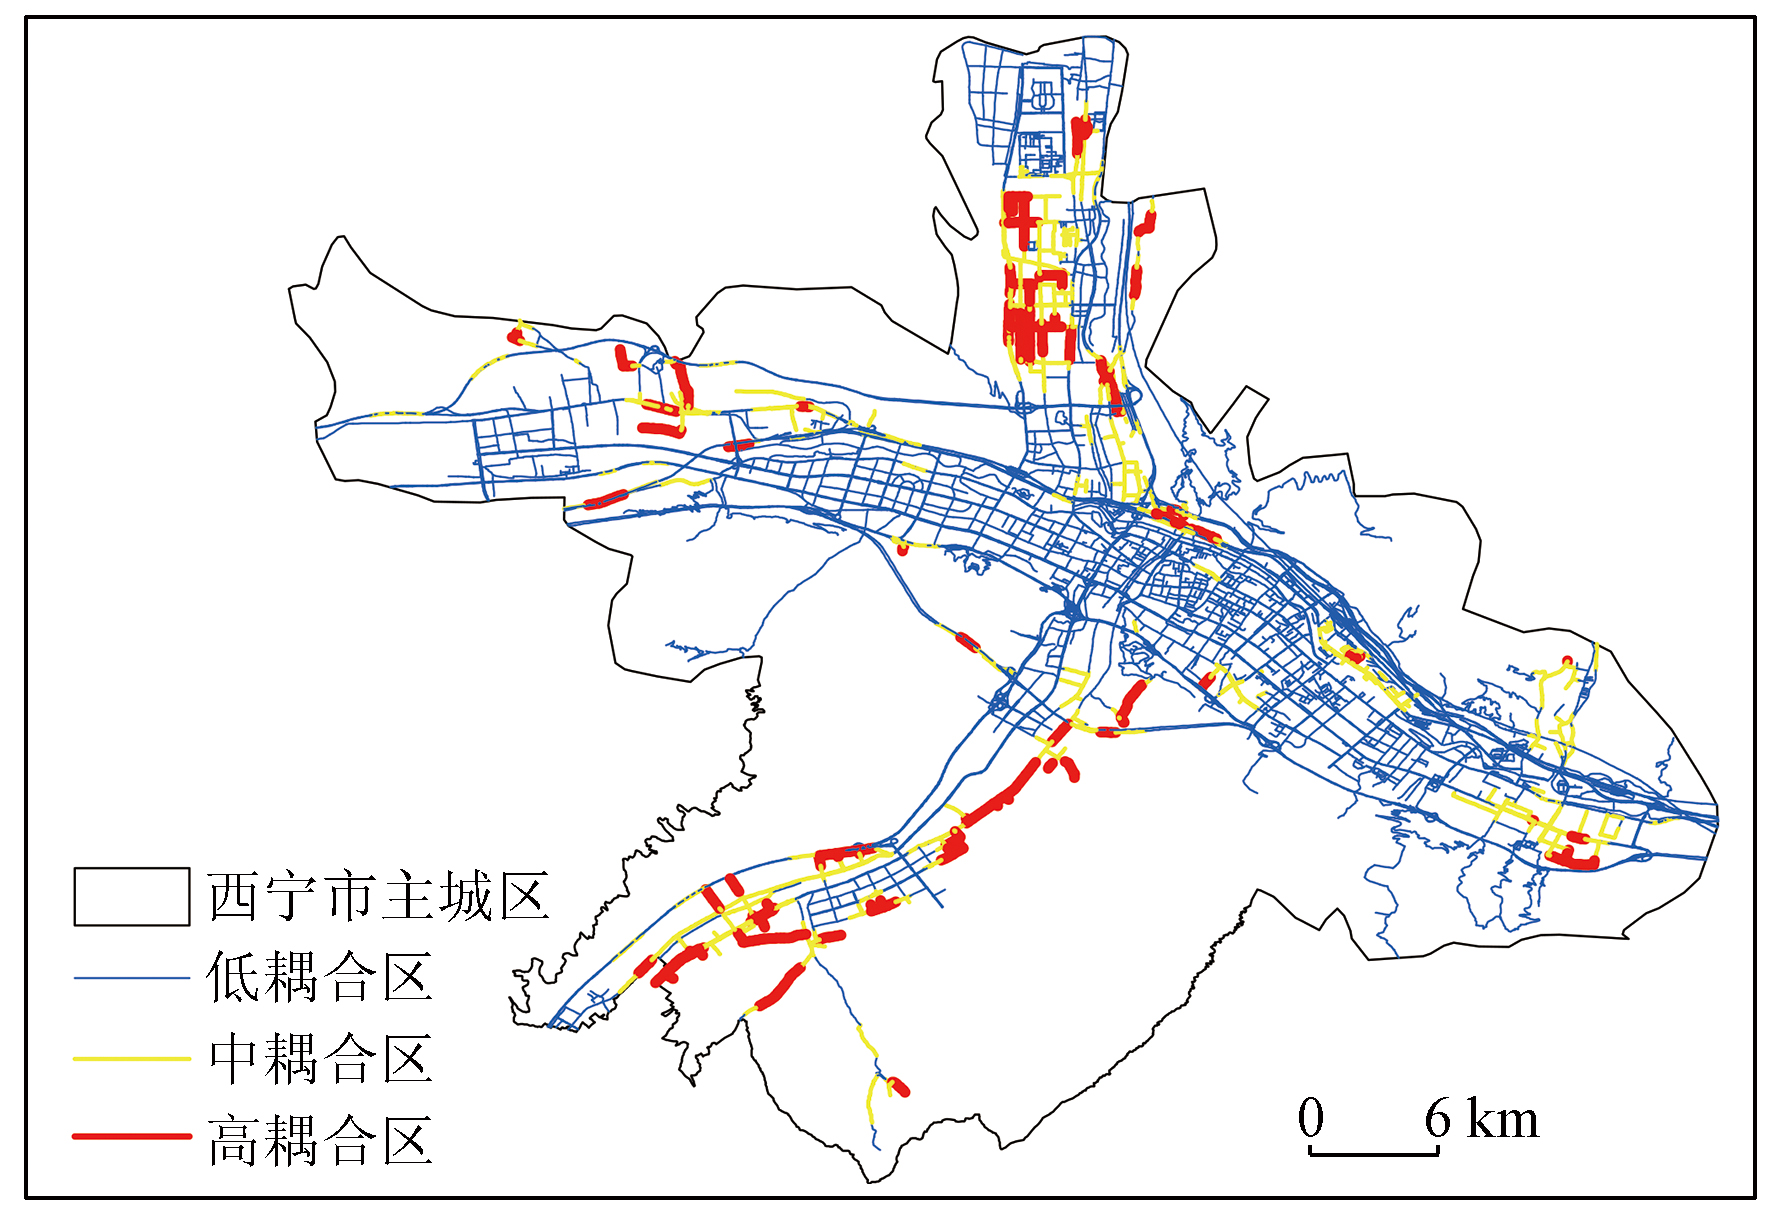
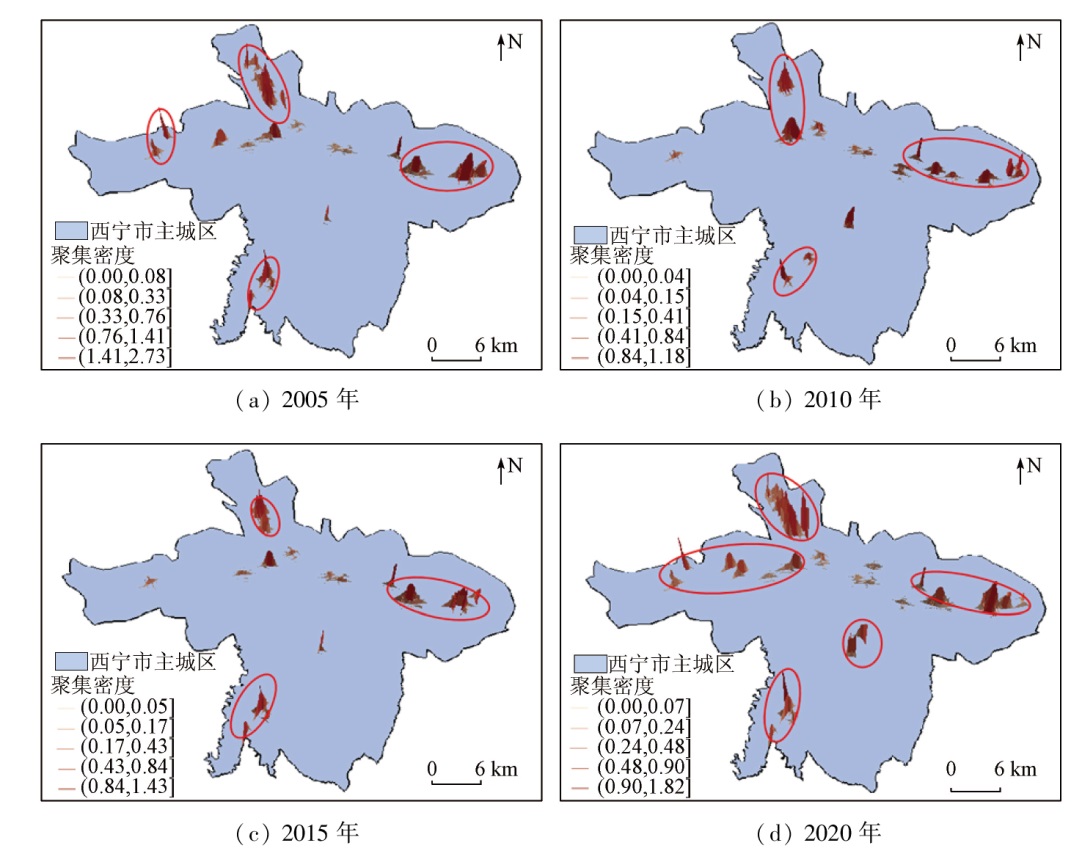
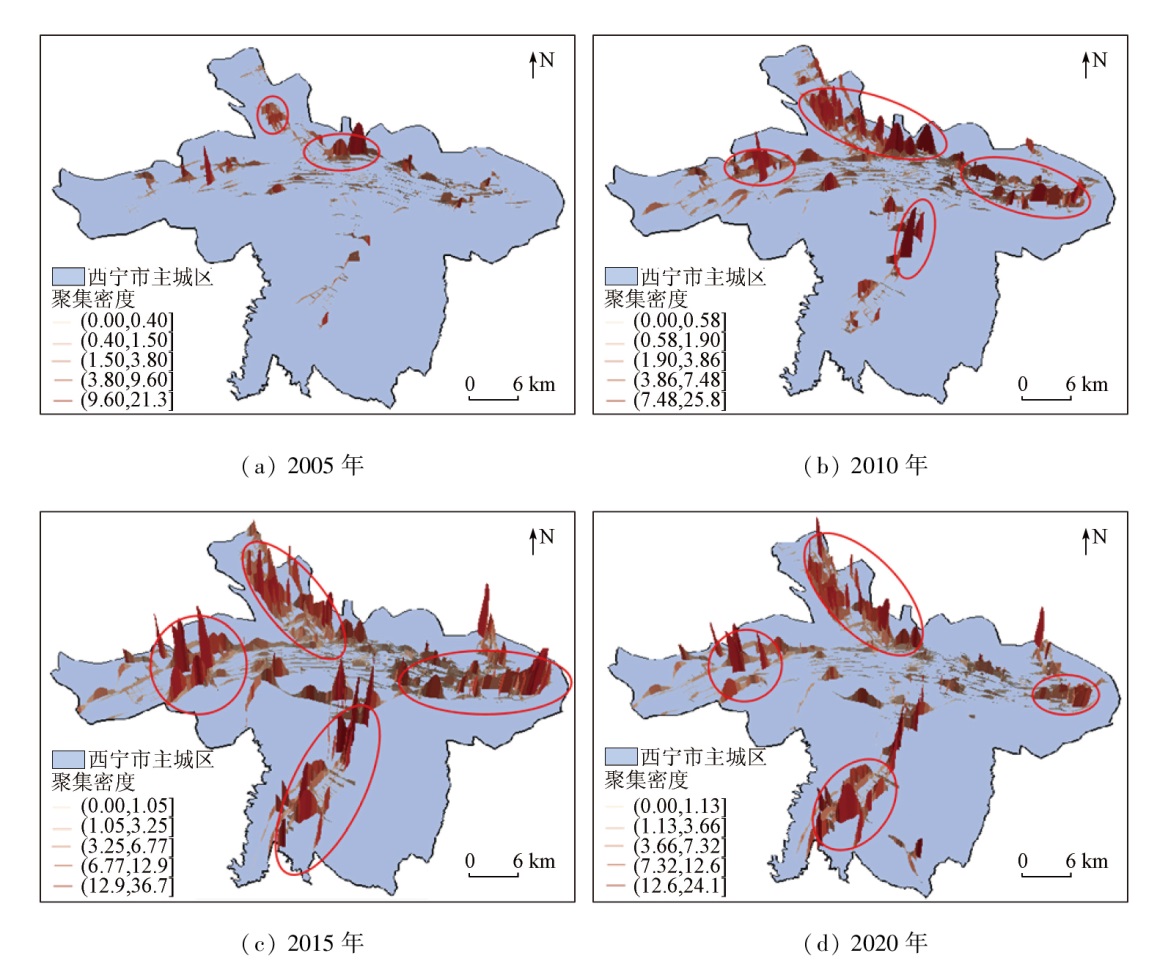
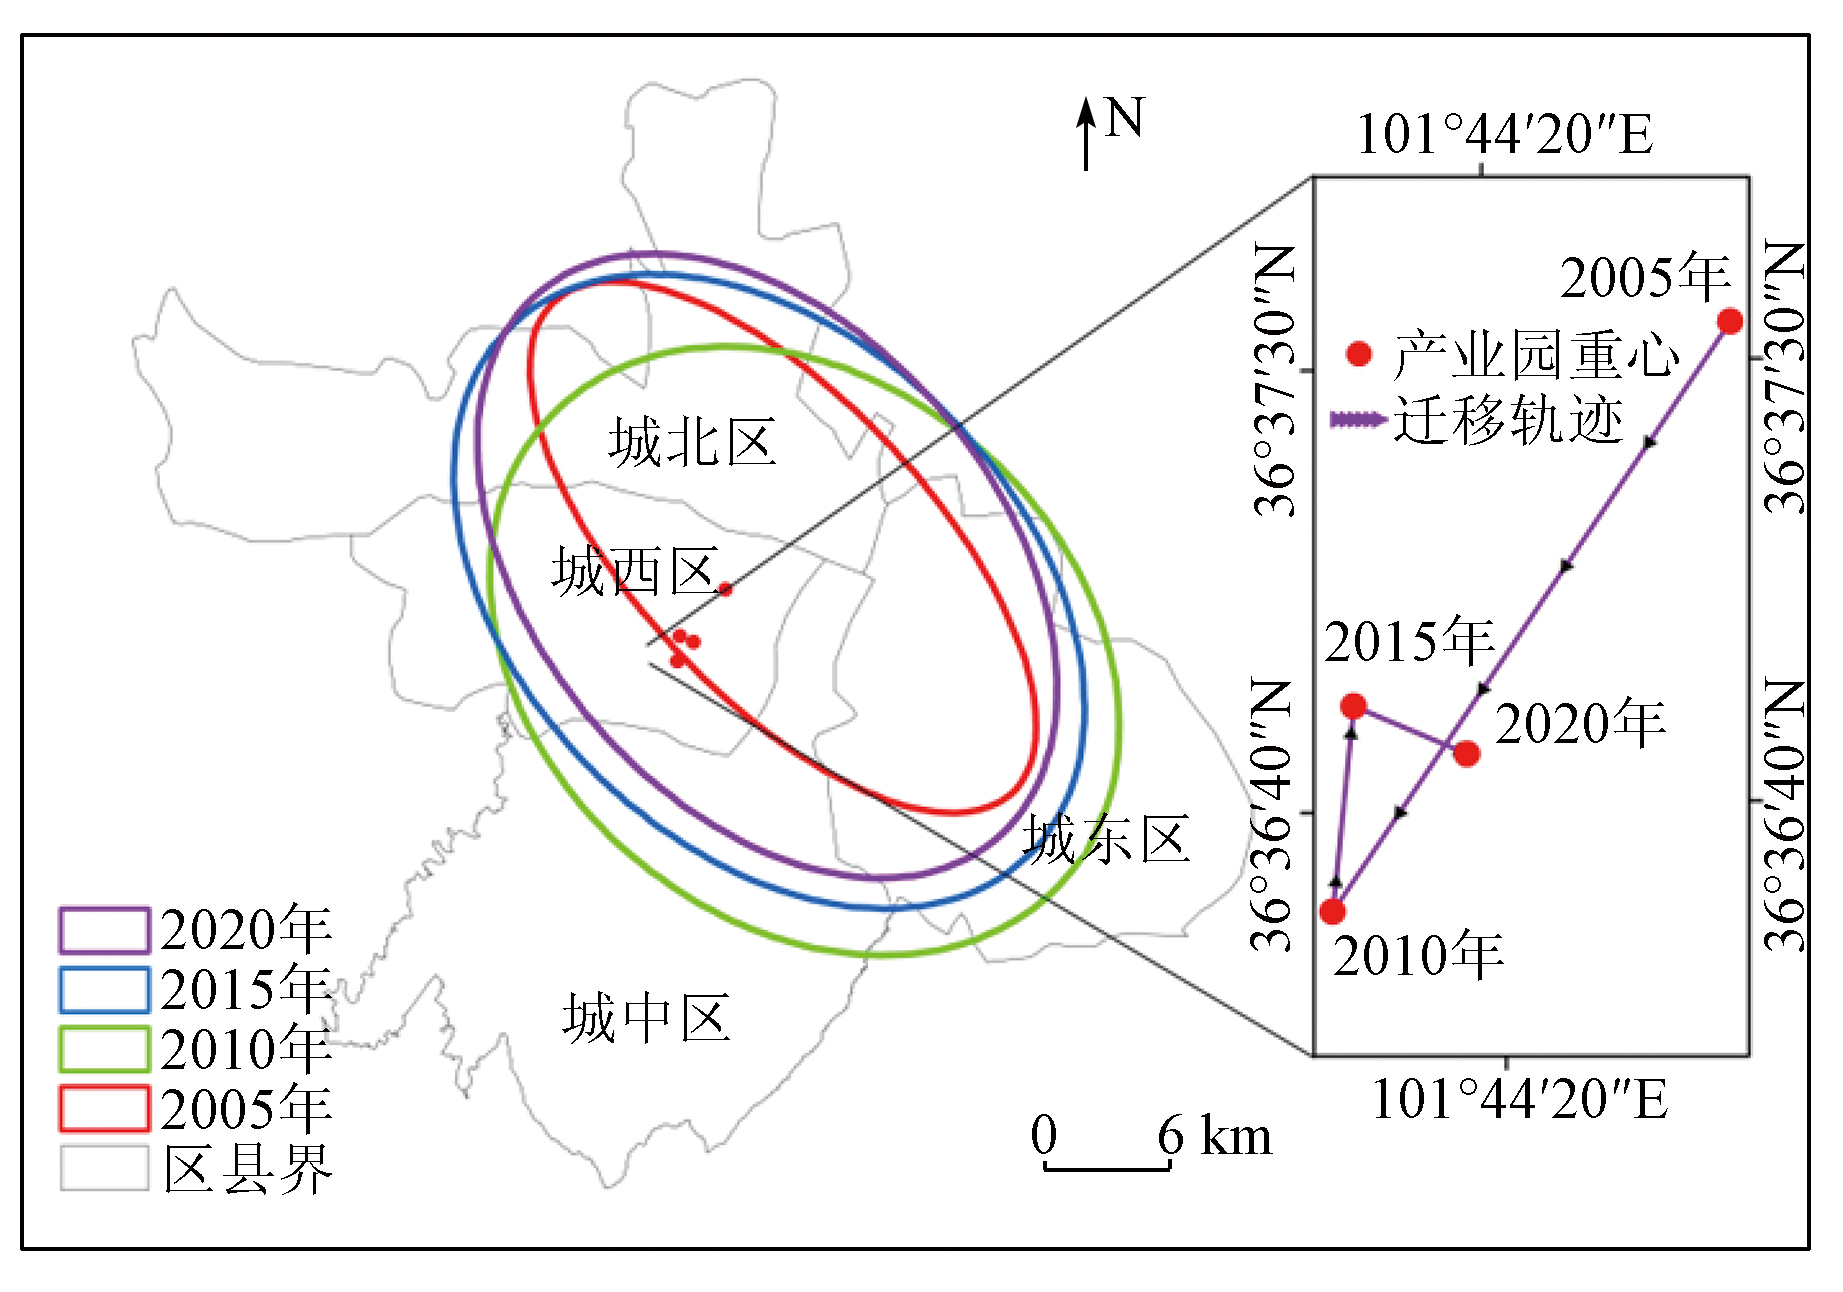
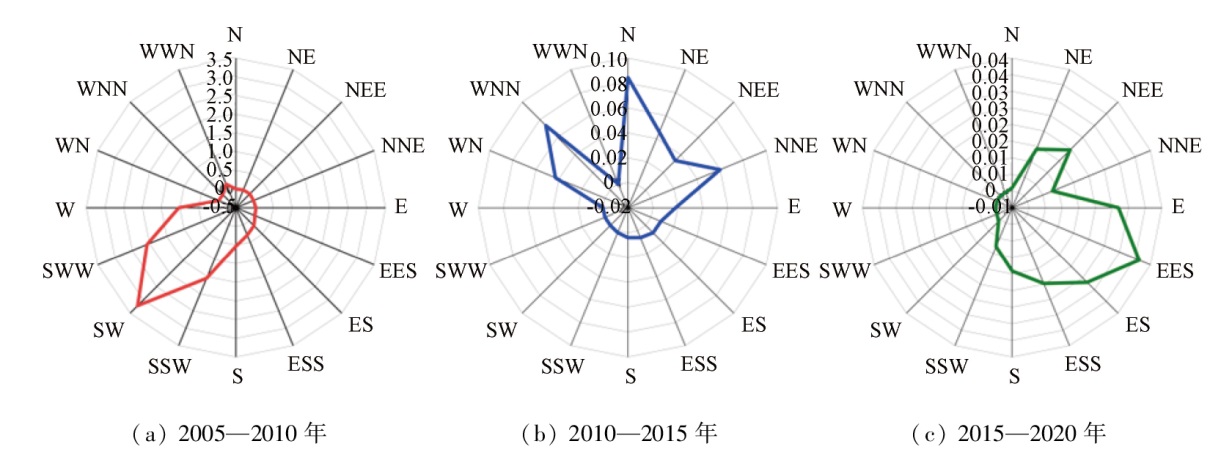
Abstract Industrial parks are like the engine of urban economic development. Exploring their spatio-temporal distributions holds critical significance for ascertaining urban spatial structures and sustaining the development of industrial parks. To objectively characterize the spatio-temporal distributions of industrial parks, this study employed the data of buildings made of color steel plates as auxiliary data for investigating industrial parks in Xining City, Qinghai Province. Combined with some information and road network data of industrial parks in the main urban area of Xining City from 2005 to 2020, this study delved into the spatio-temporal distributions of industrial parks over a long period in Xining City using network kernel density analysis, standard deviational ellipse, and equal sector analysis. The results show that: ① From 2005 to 2020, industrial parks in Xining City continued to increase at a growth rate of 73%, with the fastest growth rate observed in Chengbei District; ② Highly clustered industrial parks developed from single to multiple zones. Concerning the changes in the density of buildings made of color steel plates, newly built industrial parks were mostly distributed on the urban edge, and the cluster areas exhibited north-south crossing banded distributions, aligning with the urban spatial structure. Additionally, all industrial parks showed a northwest-southeast distribution and a less significant clustering trend from 2005 to 2020; ③ The expansion of industrial parks manifested phased and zonal development, with a gradually decreased expansion intensity, suggesting the tendency of stable development. The results of this study will provide objective spatio-temporal data support and methodology for the urbanization development research or structural transformation of industrial parks in Xining.
|
| Keywords
industrial park
buildings made of color steel plates
spatio-temporal distribution
network kernel density
|
|
|
|
Issue Date: 14 June 2024
|
|
|
| [1] |
Kang L, Ma L. Expansion of industrial parks in the Beijing-Tianjin-Hebei urban agglomeration: A spatial analysis[J]. Land, 2021(11):1118.
|
| [2] |
Bai Y, Li X W. Creative destruction path selection for industrial park transformation and upgrading under the concept of character town in the era of big data[J]. Security and Communication Networks, 2022,2022.
|
| [3] |
Dong Y, Guo B S, He D W, et al. Industrial transformation and urban economic efficiency evolution:An empirical study of the Yangtze River economic belt[J]. International Journal of Environmental Research and Public Health, 2022, 19(7):4154
|
| [4] |
Zeng D Z, Cheng L, Shi L, et al. China’s green transformation through eco-industrial parks[J]. World Development, 2021, 140:105249.
|
| [5] |
Wang M, Yuan X H, Yang S Q, et al. Research on spatial planning of petrochemical industrial parks from the perspective of symbiosis:Example of Yueyang green chemical industry park[J]. Sustainability, 2022, 14(8):1-17.
|
| [6] |
Hei W, Li X, Gao G, et al. Air Pollutants and CO2 emissions in industrial parks and evaluation of their green upgrade on regional air quality improvement:A case study of seven cities in Henan Province[J]. Atmosphere, 2022, 13(3):383.
|
| [7] |
Meng Q, Hu D, Zhang Y, et al. Do industrial parks generate intra-heat island effects in cities? New evidence,quantitative methods,and contributing factors from a spatiotemporal analysis of top steel plants in China[J]. Environmental Pollution, 2022, 292:118383.
|
| [8] |
Tang J X, Zhu Y L, Xiang B, et al. Multiple pollutants in groundwater near an abandoned Chinese fluorine chemical park:Concentrations,correlations,and health risk assessments[J]. Scientific Reports, 2022, 12(1):3370.
|
| [9] |
Chen Y F, Xu Y, Wang F Y. Air pollution effects of industrial transformation in the Yangtze River Delta from the perspective of spatial spillover[J]. Journal of Geographical Sciences, 2022, 32(1):156-176.
doi: 10.1007/s11442-021-1929-6
|
| [10] |
Xiao X D, Zhang L L, Xiong Y M, et al. Influence of spatial characteristics of green spaces on microclimate in Suzhou Industrial Park of China[J]. Scientific Reports, 2022, 12(1):9121.
doi: 10.1038/s41598-022-13108-1
pmid: 35650391
|
| [11] |
Xu Y Y, Liu M, Hu Y M, et al. Analysis of Three-Dimensional space expansion characteristics in old industrial area renewal using GIS and Barista:A case study of Tiexi district,Shenyang,China[J]. Sustainability, 2019, 11(7):1-22.
|
| [12] |
Park J I, Kim J O. Does industrial land sprawl matter in land productivity? A case study of industrial parks of South Korea[J]. Journal of Cleaner Production, 2022, 334:130209.
|
| [13] |
Zhuang L, Ye C. Changing imbalance:Spatial production of national high-tech industrial development zones in China (1988-2018)[J]. Land Use Policy, 2020, 94:104512.
|
| [14] |
Wang S S, Lu C Y, Gao Y, et al. Life cycle assessment of reduction of environmental impacts via industrial symbiosis in an energy-intensive industrial park in China[J]. Journal of Cleaner Production, 2019, 241:118358.
|
| [15] |
Vallentin C, Harfenmeister K, Itzerott S, et al. Suitability of satellite remote sensing data for yield estimation in northeast Germany[J]. Precision Agric ulture, 23(1),52-82.
|
| [16] |
马吉晶, 杨树文, 贾鑫, 等. 兰州市安宁区彩钢棚时空变化[J]. 测绘科学, 2018, 43(12):34-37,71.
|
| [16] |
Ma J J, Yang S W, Jia X, et al. Temporal and spatial change of color steel sheds in Anning district of Lanzhou City[J]. Science of Surveying and Mapping, 2018, 43(12):34-37,71.
|
| [17] |
宋郃. 银川市彩钢板建筑与产业园区时空格局演变关系研究[D]. 兰州: 兰州交通大学, 2021.
|
| [17] |
Song H. Research on spatial and temporal pattern evolution relationship of color steel building and industrial parks in Yinchuan[D]. Lanzhou: Lanzhou Jiatong University, 2021.
|
| [18] |
高丽雅, 李轶鲲, 杨树文, 等. 中国西北城市的彩钢板建筑群消防救援优化分析——以兰州市为例[J]. 测绘与空间地理信息, 2021, 44(11):31-35,39.
|
| [18] |
Gao L Y, Li Y K, Yang S W, et al. Analysis on fire rescue optimization of color steel building complexes in northwest China:A case study of Lanzhou[J]. Geomatics & Spatial Geographic Information, 2021, 44(11):31-35,39.
|
| [19] |
张乃心, 杨树文, 付昱凯, 等. 兰州市彩钢板建筑时空聚集特征及其对城市热岛效应影响分析[J]. 地理与地理信息科学, 2022, 38(3):43-49.
|
| [19] |
Zhang N X, Yang S W, Fu Y K, et al. Spatial-temporal aggregation characteristics of color steel plate buildings in Lanzhou and their influence on urban heat island effect[J]. Geography and Geo-Information Science, 2022, 38(3):43-49.
|
| [20] |
禹文豪, 艾廷华, 刘鹏程, 等. 设施POI分布热点分析的网络核密度估计方法[J]. 测绘学报, 2015, 44(12):1378-1383,1400.
doi: 10.11947/j.AGCS.2015.20140538
|
| [20] |
Yu W H, Ai T H, Liu P C, et al. Network kernel density estimation for the analysis of facility POI hotspots[J]. Acta Geodaetica et Cartographica Sinica, 2015, 44(12):1378-1383,1400.
doi: 10.11947/j.AGCS.2015.20140538
|
| [21] |
马晨, 王宏卫, 谈波, 等. 新疆典型绿洲城乡聚落规模体系特征及空间重构——以渭干河—库车河三角洲绿洲为例[J]. 地理学报 2022, 77(4):852-868.
doi: 10.11821/dlxb202204006
|
| [21] |
Ma C, Wang H W, Tan B, et al. Characteristics and spatial reconstruction of an urban-rural settlement scale system in a typical oasis in Xinjing:A case study of the Ugan-Kuqa River Delta oasis[J]. Acta Geographica Sinica, 2022, 77(4):852-868.
|
| [22] |
禹文豪, 艾廷华. 核密度估计法支持下的网络空间POI点可视化与分析[J]. 测绘学报, 2015, 44(1):82-90.
doi: 10.11947/j.AGCS.2015.20130538
|
| [22] |
Yu W H, Ai T H. The visualization and analysis of POI features under network space supported by kernel density estimation[J]. Acta Geodaetica et Cartographica Sinica, 2015, 44(1):82-90.
doi: 10.11947/j.AGCS.2015.20130538
|
| [23] |
Delso J, Martín B, Ortega E. A new procedure using network analysis and kernel density estimations to evaluate the effect of urban configurations on pedestrian mobility[J]. The Case Study of Vitoria-gasteiz.J.T Rasp.
|
| [24] |
Shen B X, Xu X, Li J, et al. Unfolding spatial-temporal patterns of taxi trip based on an improved network kernel density estimation[J]. ISPRS International Journal of Geo-Information, 2020, 9(11):683
|
| [25] |
周婷, 牛安逸, 马姣娇, 等. 国家湿地公园时空格局特征[J]. 自然资源学报, 2019, 34(1):26-39.
doi: 10.31497/zrzyxb.20190103
|
| [25] |
Zhou T, Niu A Y, MA J J, et al. Spatial-temporal pattern characteristics of national wetland park[J]. Journal of Natural Resources, 2019, 34(1):26-39.
|
| [26] |
田鹏, 李加林, 曹罗丹, 等. 中国渔业经济效率评价及发展趋势预测[J]. 中国农业资源与区划:1-15.
|
| [26] |
Tian P, Li J L, Cao L D, et al. Evaluation and development trend prediction of China’s fishery economy[J]. China’s Agricultural Resources and Regional Planning:1-15.
|
| [27] |
李留通, 张森森, 赵新正, 等. 文化产业成长对城市空间形态演变的影响——以西安市核心区为例[J]. 地理研究, 2021, 40(2):431-445.
doi: 10.11821/dlyj020200139
|
| [27] |
Li L T, Zhang S S, Zhao X Z, et al. The influence of spatial growth of cultural Industry on the evolution of urban spatial morphology:Taking the core region of Xi’an as a case study[J]. Geographical Research, 2021, 40(2):431-445.
|
| [28] |
王海军, 夏畅, 张安琪, 等. 基于空间句法的扩张强度指数及其在城镇扩展分析中的应用[J]. 地理学报, 2016, 71(8):1302-1314.
doi: 10.11821/dlxb201608002
|
| [28] |
Wang H J, Xia C, Zhang A Q, et al. Space syntax expand intensity index and its applications to quantitative analysis of urban expansion[J]. Acta Geographica Sinica, 2016, 71(8):1302-1314.
|
| [29] |
Wang H, Zhang B, Liu Y, et al. Urban expansion patterns and their driving forces based on the center of gravity-GTWR model:A case study of the Beijing-Tianjin-Hebei urban agglomeration[J]. Journal of Geographical Sciences, 2020, 30(2):297-318.
|
|
Viewed |
|
|
|
Full text
|
|
|
|
|
Abstract
|
|
|
|
|
Cited |
|
|
|
|
| |
Shared |
|
|
|
|
| |
Discussed |
|
|
|
|
 2024,
Vol. 36
2024,
Vol. 36