

0 引言
高时空分辨率遥感数据在监测土地变化、作物生长及物候参数反演等方面具有重要的作用[4],遥感数据的时空精细度成为了制约其在各领域应用的重要因素。高空间分辨率的遥感数据可以得到丰富的地表细节信息,但是其重访周期长,再加上地面气象因素(云、雨和雪等)对传感器成像的影响,造成了单个传感器有效数据重访周期的延长,使得监测具有很大程度上的“时空数据缺失”[5],即缺少同一区域范围内时间尺度上的连续监测数据或缺少同一时间上的空间连续监测数据,导致监测研究中基础观测数据出现“空窗”,在研究的关键期不能满足连续动态跟踪监测的要求; 且部分高空间分辨率数据较为昂贵,不适合大量推广使用。高时间分辨率的遥感数据具有较短的重访周期,但是其空间分辨率较低,一个像元范围内可能会包括几种不同的土地覆盖类型,限制了其在景观破碎和异质性较强区域的应用[6]。研究人员不得不在时间分辨率与空间分辨率之间进行取舍[7]。
为满足地表信息遥感动态监测同时对具有高空间分辨率和高时间分辨率特征遥感数据的需求,一些学者提出了一种能够综合高空间分辨率遥感数据的空间分辨率特征和高时间分辨率遥感数据的时间分辨率特征的技术,即遥感数据时空融合技术[8]。虽然近年来有关遥感数据时空融合模型的研究日益增多,但目前鲜有文献对已有的研究进行系统的梳理和归纳。本文对当前主流的时空融合模型进行汇总和分类,对各自模型的优缺点进行对比分析,并对卫星遥感数据时空融合模型的发展趋势进行了展望。
1 时空融合模型
遥感影像融合通常指采用特定的算法将2幅或多幅图像合成为一幅新的图像,是在光谱域和空间域进行的融合。用于融合高空间分辨率的影像(一般为全色影像)和较低空间分辨率多光谱影像,得到高空间分辨率多光谱影像。而遥感影像时空融合是在时间域和空间域进行的,利用高空间分辨率数据得到空间细节信息,利用高时间分辨率数据描述空间信息随时间的变化,通过对高空间低时间分辨率影像和高时间低空间分辨率数据有效处理来“预测”目标日期的高空间分辨率影像,即生成同时具有高空间分辨率与高时间分辨率特征的影像。
近年来,针对遥感数据时空融合方法,国内外学者进行了大量研究(表1)。根据算法原理的不同,遥感数据时空融合方法可以分为2类,即基于变换的模型和基于像元重构的模型。
表1 时空融合模型汇总
Tab.1
| 算法 类型 | 二级分类 | 名称 | 参考文献 | 至少所需中 高空间分辨率 数据个数/期 | 实验所 用数据 | 适用尺度 | 异质性较强 区域适用性 | 算法特点 | |
|---|---|---|---|---|---|---|---|---|---|
| 基 于 变 换 的 模 型 | 基于 小波 变换 的模 型 | 小波变换 | 顾晓鹤等[9] | 1 | MODIS归一化植 被指数(normalized difference vegetation index,NDVI), TM NDVI | 中、 大尺度 | 较差 | 所用MODIS NDVI数据为16 d产品,物候差异特征不够明显; 融合数据存在混合像元问题 | |
| 小波变换 | Acerbi-Junior等[10] | 1 | MODIS, TM | 中、 大尺度 | 较差 | 有效地提高了MODIS数据的空间分辨率,为最小失真情况下提高源图像的空间分辨率提供了一个概念框架 | |||
| 小波变换 | Wu等[11] | 1 | MODIS, TM | 中、 大尺度 | 较差 | 评价了小波变换在时空融合中的潜力,研究发现选择合适的小波函数和融合方法是小波变换的关键 | |||
| 基于主 成分分析 的模型 | 主成分 分析 | Shevyrnogov等[12] | 1 | NOAA NDVI, MSS | 中、 大尺度 | 较差 | 通过融合MSS亮度分量和NOAA NDVI数据得到高时空分辨率NDVI数据 | ||
| 基 于 像 元 重 构 的 模 型 | 基于 线性 混合 模型 | 线性回归 和决策树 | Hansen等[13] | 1 | MODIS, ETM+ | 尤其 大尺度 | 差 | 适用于地物单一且反射率呈线性变换的区域,大大减少时空融合所需时间,算法可移植 | |
| 线性回归 | Zhukov等[14] | 1 | AVHRR, TM | 中、 大尺度 | 差 | 考虑了像元反射率空间可变性的问题,引入窗口技术,为后续研究所采用 | |||
| 线性回归 | Maselli[15] | 1 | AVHRR NDVI, TM NDVI | 中、 大尺度 | 较差 | 提出了距离权重的概念,即认为距离目标像元越近,对目标像元的影响越大 | |||
| 线性回归 | Busetto等[16] | 1 | MODIS, TM | 中、 大尺度 | 较好 | 提出了光谱权重的概念,主要解决线性混合模型解算过程中像元反射率的空间可变性问题 | |||
| 基于 时空 自适 应融 合模 型 | 时空自适应 性反射率 融合模型 | Gao等[17] | 1 | MODIS, ETM+ | 中、 小尺度 | 较好 | 不仅考虑与目标像元的空间距离和光谱相似性,还考虑了时间上的差异,并且利用邻近光谱相似像元计算中心像元,大大提高了结果精度 | ||
| 针对反射率变 化的时空自适 应融合模型 | Hilker等[18] | 2 | MODIS, TM,ETM+ | 中、 小尺度 | 好 | 能够捕获比较短暂的地表变化 | |||
| 改进型时空自 适应融合模型 | Zhu等[19] | 2 | MODIS, TM | 中、 小尺度 | 好 | 根据空间和光谱相似性来估计中心像元,适用于异质性较强的非植被覆盖地区 | |||
| 不同时空分辨 率NDVI的时 空融合模型 | 蒙继华等[20,21] | 1 | MODIS, TM,HJ-1 CCD | 中、 小尺度 | 好 | 考虑了物候的影响,直接将算法用于植被指数 | |||
1.1 基于变换的模型
此类模型主要是基于小波变换的方法,也有部分研究是基于主成分分析的方法。如Shevyrnogov等[12]使用主成分分析的方法得到MSS数据的第一主成分分量,进而提取出亮度分量,通过融合MSS亮度分量数据和NOAA NDVI数据得到了高时空分辨率的NDVI数据。
Malenovský等[24]基于小波变换的方法融合了MODIS影像和TM数据,先从MODIS数据各波段中提取小波系数,然后利用系数整合的方法进行数据融合,融合数据具有MODIS数据的时间分辨率特征以及TM数据的部分空间细节信息; Acerbi-Junior等[10]基于小波变换3层分解的方法,对MODIS数据和TM数据进行融合,有效地提高了MODIS数据的空间分辨率,为最小失真情况下提高源图像的空间分辨率提供了一个概念框架,融合影像和TM影像的相关系数分别为0.72(Haar法)和0.82(拉普拉斯法),同时,利用融合数据对巴西稀树草原土地利用进行了分类; 何馨[25]利用小波变换的方法将时间序列MODIS NDVI与TM NDVI数据进行融合,获取30 m空间分辨率的NDVI时间变化信息,用于构建高空间分辨率的作物生长曲线; Wu等[11]基于小波变换的方法,利用现时的MODIS数据和前期的TM数据进行时空融合,生成目标日期的时空融合数据,该数据同时具有MODIS数据的时间特征以及TM数据的空间特征; 顾晓鹤等[9]在MODIS时序影像和TM影像支撑下,采用小波变换融合方法获取30 m空间分辨率的NDVI时间序列数据,并利用该数据有效地区分出各种秋季作物的空间分布。
虽然基于变换的时空融合方法取得了一些研究成果,但应用并不广泛。这是因为基于变换的时空融合方法精度并不是十分理想,而且该方法也不能很好地解决混合像元问题,融合数据“图斑”现象较为明显。但是基于变换的时空融合模型能够较好地保留光谱细节信息,这使该方法仍然有其用武之地。
1.2 基于像元重构的模型
国内外大部分遥感数据时空融合模型是基于像元分解重构技术的,其基本思想是通过一定的规则选择目标像元周边的像元参与目标像元的重构。像元分解重构技术是一种尺度下降技术,一般是基于线性混合模型的。根据像元分解重构技术,低空间分辨率影像的像元在某一光谱波段的反射率可以由其对应空间范围内高空间分辨率影像的像元反射率线性加权得到。
基于像元分解重构的时空融合模型中,有一部分研究是直接基于线性混合模型的像元分解技术,这类算法起源较早,原理简单、计算简便,但易出现异常值。Gao等[17]提出了一种时空自适应性反射率融合模型(spatial and temporal adaptive reflectance fusion model,STARFM),该模型可以从低空间分辨率影像直接解算出高空间分辨率影像,后续学者在其基础上对STARFM模型进行了大量的改进研究。
1.2.1 基于线性混合模型
Riλ=
式中: Riλ为遥感影像上像元i在λ波段的反射率值; n为i像元中的地物类型种类数; rkλ为组分k在λ波段的反射率值; fki为组分k在像元i中所占的百分比,0≤fki≤1; εiλ为误差。
Hansen等[13]和Potapov等[30]利用线性回归的方法进行时空融合,假设高空间分辨率影像和低空间分辨率影像随时间变化规律一致,并且2类影像从时间t1到t2的反射率变化是线性的,通过统计各个地物类别在原高空间分辨率与低空间分辨率数据中反射率均值计算尺度转换系数,与MODIS数据差值共同计算时间变化信息[32]。这种算法原理简单、计算便捷,生产融合数据时比其余融合算法所需时间短,且不需要高、低空间分辨率数据具有相同的波段,适用于大范围、长时间序列的大数据研究及快速动态监测研究。然而,该算法获得的类别反射率是局部区域的平均反射率,不能很好地体现地物光谱的空间差异性,而且会出现“图斑”现象,因此仅适用于地物单一且反射率呈线性变换的区域。
Zhukov等[14]基于像元反射率在邻近像元间不会剧烈变化的假设,提出了考虑像元反射率空间可变性的时空融合方法,该方法引入窗口技术,即只考虑目标像元周边像元的相关性,从而避免了整景影像中同类地物反射率相同的假设。但是该方法的前提仍然是假设目标像元与窗口内同类地物像元的反射率值一样,没有从根本上解决光谱在空间上变化的问题。Maselli[15]在此基础上提出了距离权重的概念,即认为距离目标像元越近,对目标像元的影响越大。但是,有时类内像元间反射率的差异也是十分明显的,导致邻近像元间的反射率也会明显变化。因此,Busetto等[16]在上述研究基础上进行了改进,在子集的选择上,不仅考虑与目标像元间的距离,还考虑了与目标像元间的光谱差异。该模型确定权重的基本思想是由于像元反射率的空间异质性不仅随距离的增加而增加,而且在像元反射率的光谱上也存在明显差异,因此通过距离权重和光谱相似性来确定每个参与线性混合模型解算的MODIS像元的权重。Zurita-Milla等[33]在Zhukov[14]等研究的基础上,使用一种高空间分辨率土地覆盖数据,对低空间分辨率影像序列进行降采样构建高空间分辨率影像,从而实现了时间序列低空间分辨率数据降尺度,即得到了同时具有高时间分辨率和高空间分辨率特征的数据。
邬明权等[34]基于类别反射率的时间变化特征与类内像元反射率的时间变化特征一致的假设,提出了一种利用预测日期前、后2期高空间分辨率影像和时序的低空间分辨率影像获得时序高空间分辨率影像的遥感数据时空融合方法(spatial and temporal data fusion approach,STDFA)。该方法从时序低空间分辨率影像中提取地物的时间变化信息,对2期高空间分辨率影像做差值和密度分割获得分类影像,从而获得类别平均反射率进行影像融合。在此基础上综合考虑像元反射率的空间可变性和时间变化规律,对该方法进行了改良[35],并且应用改良的STDFA模型得到的时空融合影像进行了我国南方水稻种植面积的提取[36],验证了该方法在解决遥感数据缺失问题上,以及高时空分辨率地物类型提取上的可行性与优势。谢登峰等[37]利用STDFA模型融合MODIS和OLI数据,以融合数据构建15种30 m空间分辨率的分类数据集,然后进行秋粮作物识别,水稻和玉米的总体识别精度达到了86.9%; Zhang等[4]也对STDFA方法进行了分类方法、滑动窗口和时间权重3个方面的改进,提出了改进的时空数据融合模型。
基于线性混合模型的时空融合模型在理论上能够很好地解释高、低空间分辨率影像像元之间的关系,能够较好地用于中低空间分辨率数据光谱特征的降尺度[38],且此类方法大多计算简便,适用于中大尺度、长时间序列的大数据研究及快速动态监测研究。但是此类时空融合模型早期算法是在高空间分辨率数据整景影像中同一种地物类型的像元反射率相同的假设上建立的,因此在异质性强的区域适用性较差。虽然后续研究逐步引入了窗口技术、距离权重和光谱差异等概念,提高了此类模型在异质性较强区域的适用性,但这仍然是制约其应用的一个因素。此外,此类模型解算2种不同空间分辨率影像像元之间关系时存在残差项,因此融合结果容易出现异常值。
1.2.2 时空自适应反射率融合模型
为提高时空融合精度,同时避免线性光谱模型解算时异常值的出现,Gao等[17]提出了STARFM,用于融合Landsat和MODIS影像来获得兼具Landsat的空间分辨率特征和MODIS的时间分辨率特征的反射率数据,并利用获得的数据与真实数据进行了初步的应用测评。该模型是在2个假设的前提下提出的:①当低空间分辨率影像的像元值没有发生变化时,高空间分辨率影像的像元值也不发生变化; ②在预测时间窗口内,如果t0时刻的低空间分辨率影像像元值与高空间分辨率影像的像元值相等,那么在tk时刻它们的值仍相等。虽然该模型是在线性混合模型的基础上发展的,但是该模型直接从低空间分辨率影像解算出高空间分辨率影像,而且综合考虑了空间距离、光谱距离及时间距离。
其算法思想为,在忽略几何误差和大气校正误差的情况下,高空间分辨率像元反射率和低空间分辨率像元反射率关系为
H(xi,yj,tk)=C(xi,yj,tk)+εk , (3)
式中: H(xi,yj,tk)和C(xi,yj,tk)分别为给定位置(xi,yj)处的高空间分辨率和低空间分辨率影像在tk时刻的反射率值; εk为两者反射率差异。
假设地表覆盖类型和系统误差在tk和t0时刻之间没发生变化,则εk=ε0,从而
H(xi,yj,t0)=C(xi,yj,t0)+H(xi,yj,tk)-C(xi,yj,tk) 。 (4)
引入邻近像元信息构建权重函数,即
H(xw/2,yw/2,t0)=
Wijk=
式中: (xw/2,yw/2)为中心像元; w为移动窗口的尺寸; n为不同时刻; W为权重矩阵; Sijk为高、低空间分辨率数据间的光谱距离; Tijk为高、低空间分辨率间的时间距离; Dijk为目标像元和中心像元间的空间距离。
尽管STARFM在遥感数据时空融合方面取得了较好的效果,但是其仍然存在几点局限性,很多学者针对其局限性进行了改进。
1)如果地表反射率的变化比较短暂且没有被任何一期Landsat影像所记录,那么STARFM也无法准确预测出该时段的反射率值。针对这一问题,Hilker等[18]提出了一种针对反射率变化的时空自适应融合模型(spatial temporal adaptive algorithm for mapping reflectance change,STAARCH)。该模型首先利用干扰因子来确定Landsat影像是否存在像元出现反射率短暂改变的情况,若发生该情况则使用时序MODIS数据和Landsat影像来确定发生变化的具体时相; 然后选择最佳时相的影像来进行时空融合,从而提高融合精度。STAARCH在确定像元反射率突变的时相时,需借助时序低空间分辨率数据及多期高空间分辨率数据,这在一定程度上限制了其应用范围。
2)为提高异质性较强区域的时空融合精度,Zhu等[19]提出了一种改进型时空自适应融合模型(enhanced spatial and temporal adaptive reflectance fusion model,ESTARFM),考虑了反射率的时间变化趋势,可以更好地预测反射率的变化。该方法使用搜索窗口在中心像元局部寻找相似像元,根据空间和光谱相似性来估计中心像元,通过权重来分配相似像元对中心像元的贡献率,而不依赖于对应像元,对不同地表具有更好的适应性。Fu等[39]在ESTARFM的基础上改进了搜索光谱相似性像元的算法,综合考虑了标准差和窗口内土地覆盖类型的数目,提高了ESTARFM模型的精度。然而,ESTARFM模型假设像元反射率随时间变化稳定且随时间的变化是线性的,此假设在估算长时间序列数据时会产生较大误差,这在一定程度上限制了其在反射率变化非线性的植被地区的应用。
3)STARFM没有明确处理方向对地物反射率的影响,Roy等[40]提出了一种半物理模型,该算法在假设MODIS影像和ETM+影像反射率随时间的变化规律一致的前提下,利用MODIS的双向反射分布函数(bidirectional reflectance distribution function,BRDF)产品来模拟其二向反射率,有效地削弱了卫星观测角度和太阳高度角的影响。Wang等[41]提出利用MODIS BRDF产品来削弱卫星观测角度的影响,并且在窗口内搜索相关性最大的像元来减弱MODIS和TM空间配准引入的误差。该类模型对近红外波段的预测精度最高,因而能够提供更准确的植被变化信息。但是,该模型需要较为精确的MODIS分类数据以及与之相应的BRDF模型参数,且算法较为复杂,在一定程度上限制了该模型的进一步推广应用。为了简化半物理融合模型冗繁的数据预处理流程并使其适用于更多的应用需求,李大成等[42]提出了一种在半物理融合模型基础上拓展的乘性调制融合机制。该模型借助邻近像元光谱信息对局部色调进行平衡处理,有效地消除半物理融合模型在预测结果图像中的块状效应,但这种拓展的半物理模型在预测精度以及模型的推广上还有待进一步的应用验证。
4)STARFM是针对地物反射率数据提出的,将其应用到其他数据还需要验证和改进。针对这一问题,蒙继华等[20,21]在STARFM的基础上发展了一套不同时空分辨率NDVI数据的时空融合模型(spatial and temporal adaptive vegetation index fusion model,STAVFM),直接将算法用于植被指数提取,更好地利用植被的时间变化特征,提高了模型效率和精度,并且根据指标的变化特点,对时间维权重进行了改进; Walker等[43]利用STARFM模型,使用生长季内TM和MODIS数据生成长时间序列高时间分辨率的TM模拟数据; Liu等[44]利用STARFM模型融合ASTER和MODIS数据,得到了模拟的高时间分辨率ASTER数据,并用其提取城市中的环境变量(NDVI和地表温度等)及定量评估西尼罗河流域病毒传播特点; Singh[45,46]基于STARFM模型对ETM+数据进行预测,利用时空融合预测的ETM+数据计算NDVI,在印度密鲁特北方邦的8 a(2002—2009年)NDVI计算中取得了较好的结果,8 a间的时空融合数据显示STARFM模型对于突然变化的NDVI值不敏感; 尹晓利等[47]利用STARFM融合MODIS和TM数据,然后将融合数据引入到草地的生物量估算模型中,并对比分析了融合反射率和融合NDVI作为输入数据的估算精度,发现直接融合NDVI数据能够获得更高的生物量估算精度。
时空自适应反射率融合模型在预测过程中使用滑动窗口的方法来减少低空间分辨率遥感数据像元边界的影响,计算滑动窗口中心像元时综合考虑了空间权重、光谱权重和距离权重,在时空融合领域取得了较好的成果,同时,国内外学者也针对其局限性进行了大量的改进研究。目前,时空自适应模型及其改进模型被广大学者所使用,但是,针对其局限性的改进算法仍然需要后续学者继续探索。基于像元重构的时空融合模型应用较为广泛,国内外学者针对其存在的问题不断改进,使此方法逐步成熟,是当前时空融合领域的主流模型,其融合结果在植被物候提取、作物分类和温度反演等方面得到了广泛应用[51,52,53,54,55,56,57,58]。然而,该类模型也有其限制性,例如需要高空间分辨率的地物覆盖数据作为辅助数据,并且假设土地覆盖类型不随时间发生变化,这在有些情况下会限制其应用。
而土地覆盖类型在很多情况下是随着时间变化的,为了解决这个问题,Wu等[59]提出了一种集合影像修复和控制核回归的时空融合模型(integrating image inpainting and steering kernel regression fusion model,ISKRFM),首先监测出土地覆盖类型发生变化的区域,然后通过影像修复的方法利用相似像元代替变化的像元; Zhu等[60]提出了一种灵活的时空融合模型(flexible spatiotemporal data fusion,FSDAF),利用薄板样条函数预测目标日期的高空间分辨率数据,该方法能够有效预测土地覆盖类型的变化,并且能够适用于异质性较强的区域。
2 时空融合模型研究展望
时空融合模型虽然得到了国内外学者的广泛关注和研究,但是目前,不管是基于变换的,还是基于像元重构的融合模型,都还存在着较大的提升空间,有待国内外学者进一步研究。本文在分析了现有时空融合模型的基础上,对卫星遥感数据时空融合模型分别从数据、应用和尺度3个方面进行展望。
2.1 数据展望
目前的时空融合算法大多是针对2种数据源的遥感数据进行融合,没有充分利用现有多源数据的优势,很多情况下2种数据时空融合得到的数据精细度仍无法满足各领域的应用需求。这就需要一种多源数据时空融合算法,综合利用多种遥感数据的优势,利用多种中高空间分辨率卫星数据在时间上的互补特性,使得更多数据源的中高空间分辨率数据参与到目标日期高空间分辨率数据的预测中,从而提升预测数据的质量。随着越来越多的卫星升空,卫星遥感数据量呈指数形式增加,迫切需要发展多源数据时空融合算法,利用多源遥感数据的优势提升时空融合模型的适用性和预测数据的质量。
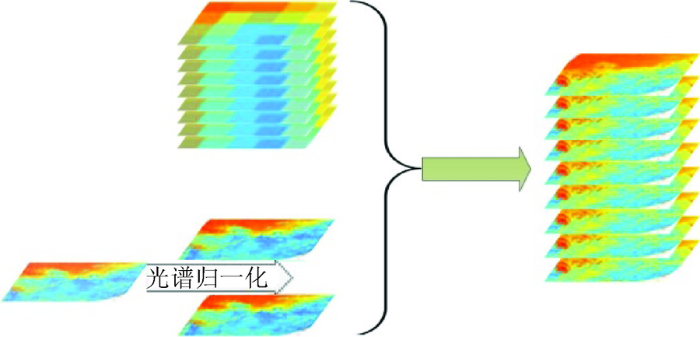
然而,由于多源数据时空融合算法需要利用多种高空间分辨率遥感数据,这些遥感数据来自不同的平台和传感器,不可避免地具有各自卫星和传感器的特点,产生了较大的不一致性。Teillet等[64]基于ETM+传感器,在相同条件下模拟计算了20个传感器,并且分析了光谱响应差异对传感器测量结果的影响,发现不同传感器间光谱响应差异导致的测量结果有明显的区别。这种区别给相关研究带来了一定的困难,为了综合利用多种数据的优势和特性,需要解决来自于不同传感器数据的一致性问题。因此,利用多源遥感数据进行时空融合,需要把多种高空间分辨率数据进行光谱归一化,使其具有相同的辐射尺度,在此基础上进行时空融合(图1)。光谱归一化技术旨在针对多源遥感数据集光谱响应特征的不同,进行相互之间的辐射或反射率转化技术[65],以提高多源遥感数据的可用性。
图1
光谱归一化方法可分为绝对光谱归一化和相对光谱归一化。绝对光谱归一化是将每幅影像的灰度值都转换成反射率或者辐射亮度来完成的。通常,绝对光谱归一化包含2个步骤[66]: ①将传感器测量的灰度值转换成卫星传感器测量的光谱辐射值; ②将传感器测得的辐射值转换成反射率。绝对光谱归一化方法精度较高,但在应用过程中需要收集大量的实时参数,存在一定的难度[67]。相对光谱归一化是先选定一种遥感数据作为参考数据,再将其他数据影像的灰度值逐波段地归一化到参考数据,使多源遥感数据具有相同的辐射尺度,使得不同数据影像中的同一地物具有相似的灰度值。Hong等[68]的研究发现,在对不同传感器的多时相高空间分辨率影像进行相对光谱归一化时,基于分布的相对光谱归一化方法(如直方图匹配法)要优于基于像元对的相对归一化方法。
2.2 应用展望
时空融合方法可以用来生产长时间序列反射率数据集。长时间序列反射率数据集具有广泛的应用空间,如全球或区域地表覆盖变化检测、环境变化、植被动态变化、土地覆盖变化和植物生物物理参数反演等[69]。构建NDVI数据集也是时空融合应用的一个重要领域,目前比较常用的时间序列NDVI数据大多是在MODIS,VIIRS和AVHRR等高时间分辨率数据基础上构建的[70,71],而以TM和SPOT等中高空间分辨率数据构建的时间序列数据集较少。这是因为受云、气溶胶、太阳高度角和地物二向反射等因素的影响,中高空间分辨率数据构建NDVI数据集时容易出现异常值,而其较低的时间分辨率使得没有邻近日期的数据对异常值进行修正。随着研究的逐步深入,越来越需要构建一种中高空间分辨率的时间序列NDVI数据集,而时空融合技术生产的高时空分辨率数据恰好可以满足构建此类数据集的要求。利用时空融合技术构建高空间分辨率时间序列数据集将为时空融合技术提供更广阔的应用空间。特别是当多源数据时空融合算法投入应用时,综合利用多种中高空间分辨率数据构建具有统一标准的长时间序列NDVI数据集,将弥补TM,MSS,ETM+和OLI等中高空间分辨率数据只存在一段时期的劣势。构建时间维度上更广泛的高空间分辨率时间序列数据集,对于地表覆盖时间域上的研究具有重要意义。
2.3 尺度展望
MODIS数据是较为常用的高时间分辨率数据,在地表监测研究中具有优势[72,73],但其空间分辨率较低,不适合小尺度的应用。TM数据是常用的中高空间分辨率数据,在各领域应用广泛[74,75,76,77,78],但该数据时间分辨率较低,易受云雨天气的影响,不利于长时间序列动态跟踪监测。传统的时空融合算法大多是在低空间分辨率数据和中高空间分辨率数据之间开展的(如MODIS数据和TM数据),利用MODIS数据的时间特性和TM数据的空间特性融合得到高时空分辨率数据。随着遥感技术的发展,越来越多的高空间分辨率卫星投入了应用,如中国的“高分”系列,俄罗斯的“Resurs”系列,法国的SPOT-6,美国的“QuickBird”和“GeoEye”等,这些卫星都可以提供m级甚至亚m级数据。然而空间分辨率直接与幅宽相关,一般情况下空间分辨率越高,影像幅宽越小,重访周期越长,例如高分一号PMS数据的重访周期(不测摆)为41 d,现实的天气状况还会延长有效数据的获取周期,无法满足动态监测的需求。由于m级、亚m级高空间分辨率数据和高时间分辨率数据空间尺度差异较大,传统时空融合模型在空间尺度相差较大时的适用性还有待研究,而目前针对高空间分辨率数据的时空融合研究较少,这在一定程度上限制了m级、亚m级高空间分辨率数据的应用。随着m级、亚m级高空间分辨率数据逐渐成为主流的遥感数据,针对高空间分辨率数据的时空融合研究急需开展。
3 结论
在当前单一传感器数据不能满足各领域动态监测对于高时空分辨率遥感数据需求的情况下,如何融合遥感数据综合利用多源数据的特性和优势,具有重要的理论意义和应用价值。本文将当前主流的遥感数据时空融合模型划分为基于变换的模型和基于像元重构的模型2类,其中,把基于像元重构的模型又分为线性混合模型和时空自适应模型,并概要分析了各自的优缺点。基于变换的方法早期用于光谱-空间融合,并且在融合光谱特征和空间特征上取得了较好的成果,引入时空融合领域后虽然使融合数据能够较好地保留光谱细节信息,但是其融合空间特征和时间特征的精度并不是十分理想,而且不能很好地解决混合像元问题,应用并不是十分广泛; 直接基于线性混合模型的方法原理简单,计算快捷,适合用于中、大尺度和长时间序列的大数据研究及快速动态监测研究,但是其在异质性较强的研究区域适用性较差,且融合结果容易出现异常值,这在一定程度上限制了其应用; 时空自适应融合模型综合考虑了空间距离、光谱距离及时间距离计算权重,国内外学者针对其局限性进行了大量研究,逐步改善其在各种情况下的适用性,使此类模型成为了目前使用最为广泛的模型之一。
本文在对时空融合模型归纳、总结的基础上,进行了3个方面的展望。①数据展望: 目前的时空融合算法大都是针对2种数据源的遥感数据进行融合,没有充分利用现有多源数据的优势,需要发展多源数据时空融合算法,综合利用多源遥感数据的特性,使更多数据源的中高空间分辨率数据作为原始数据参与到时空融合中,从而提高预测数据的质量; ②应用展望: 利用时空融合技术特别是多源数据时空融合技术构建具有统一标准的高空间分辨率时间序列数据集,对于高精度长时间序列地表覆盖研究具有重要意义; ③尺度展望: 随着遥感技术的发展,越来越多的m级、亚m级卫星数据投入应用,此类数据具有高空间分辨率低时间分辨率的特点,针对此类数据的时空融合算法有待开展。
综上所述,时空自适应融合模型及其改进模型是当前应用最为广泛的时空融合模型,但是不同的模型具有不同的优缺点,各自侧重领域不同,都有其继续研究、发展的价值。总体上说,时空融合模型能够较好地处理当前光学遥感数据空间分辨率和时间分辨率上相互制约的问题,其发展及应用前景十分广阔。
参考文献
农田农情参数遥感监测进展及应用展望
[J].
Research advances and outlook of crop monitoring with remote sensing at field level
[J].
Assessing the accuracy of blending Landsat-MODIS surface reflectances in two landscapes with contrasting spatial and temporal dynamics:A framework for algorithm selection
[J].
DOI:10.1016/j.rse.2013.02.007
URL
[本文引用: 1]

Blending algorithms model land cover change by using highly resolved spatial data from one sensor and highly resolved temporal data from another. Because the data are not usually observed concurrently, unaccounted spatial and temporal variances cause error in blending algorithms, yet, to date, there has been no definitive assessment of algorithm performance against spatial and temporal variances. Our objectives were to: (i) evaluate the accuracy of two advanced blending algorithms (STARFM and ESTARFM) and two simple benchmarking algorithms in two landscapes with contrasting spatial and temporal variances; and (ii) synthesise the spatial and temporal conditions under which the algorithms performed best. Landsat-like images were simulated on 27 dates in total using the nearest temporal cloud-free Landsat-MODIS pairs to the simulation date, one before and one after. RMSD, bias, and r(2) estimates between simulated and observed Landsat images were calculated, and overall variance of Landsat and MODIS datasets were partitioned into spatial and temporal components. Assessment was performed over the whole study site, and for specific land covers. Results addressing objective (i) were that: ESTARFM did not always produce lower errors than STARFM; STARFM and ESTARFM did not always produce lower errors than simple benchmarking algorithms; and land cover spatial and temporal variances were strongly associated with algorithm performance. Results addressing objective (ii) indicated ESTARFM was superior where/when spatial variance was dominant; and STARFM was superior where/when temporal variance was dominant. We proposed a framework for selecting blending algorithms based on partitioning variance into the spatial and temporal components and suggested that comparing Landsat and MODIS spatial and temporal variances was a practical method to determine if, and when, MODIS could add value for blending. Crown Copyright (c) 2013 Published by Elsevier Inc. All rights reserved.
How unique are spectral signatures?
[J].
DOI:10.1016/0034-4257(94)90013-2
URL
[本文引用: 1]
Recent improvements in instrumentation have made possible the acquisition of high spectral resolution image data corresponding to spectral reflectance signatures. It would seem that sufficiently high spectral resolution, of order 0.01 m, would be adequate to permit unique discrimination of virtually any soils, vegetation types, and rocks, but we show by example that this is not necessarily the case.
An enhanced spatial and temporal data fusion model for fusing Landsat and MODIS surface reflectance to generate high temporal Landsat-like data
[J].
DOI:10.3390/rs5105346
URL
[本文引用: 2]
Remotely sensed data, with high spatial and temporal resolutions, can hardly be provided by only one sensor due to the tradeoff in sensor designs that balance spatial resolutions and temporal coverage. However, they are urgently needed for improving the ability of monitoring rapid landscape changes at fine scales (e.g., 30 m). One approach to acquire them is by fusing observations from sensors with different characteristics (e.g., Enhanced Thematic Mapper Plus (ETM+) and Moderate Resolution Imaging Spectroradiometer (MODIS)). The existing data fusion algorithms, such as the Spatial and Temporal Data Fusion Model (STDFM), have achieved some significant progress in this field. This paper puts forward an Enhanced Spatial and Temporal Data Fusion Model (ESTDFM) based on the STDFM algorithm, by introducing a patch-based ISODATA classification method, the sliding window technology, and the temporal-weight concept. Time-series ETM+ and MODIS surface reflectance are used as test data for comparing the two algorithms. Results show that the prediction ability of the ESTDFM algorithm has been significantly improved, and is even more satisfactory in the near-infrared band (the contrasting average absolute difference [AAD]: 0.0167 vs. 0.0265). The enhanced algorithm will support subsequent research on monitoring land surface dynamic changes at finer scales.
中国陆面数据同化系统研究的进展与前瞻
[J].
DOI:10.3321/j.issn:1002-008X.2007.02.003
URL
[本文引用: 1]
陆面数据同化的核心思想是在陆面过程模型的动力框架内,融合不同来源和不同分辨率的直接与间接观测,准确一致地估计地表水分和能量循环的各个分量.作者已初步建立了中国陆面数据同化系统;同化方法采用了集合Kalman滤波,模型算子使用CoLM和SiB2等SiB2等陆面过程模型,观测算子采用针对土壤(包括融化和冻结)、积雪等不同地表状态的微波辐射传输模型.该系统同化被动微波遥感观测如SSM/I,TMI和AMSR以及土壤和积雪的常规观测,已计算得到中国西北干旱区和青藏高原的土壤水分、土壤温度、积雪和冻土的同化资料.文中阐述了在同化系统的构建、同化算法的研究、陆面过程模型和微波辐射传输模型的集成以及大气驱动数据制备等方面的进展,讨论了陆面数据同化的特点和面临的问题,展望了未来的研究重点和同化方法在陆地表层系统科学研究中的应用前景.
Development of a Chinese land data assimilation system:Its progress and prospects
[J].
Effect of foliage spatial heterogeneity in the MODIS LAI and FPAR algorithm over broadleaf forests
[J].
DOI:10.1016/S0034-4257(03)00017-8
URL
[本文引用: 1]
This paper presents the analysis of radiative transfer assumptions underlying moderate resolution imaging spectroradiometer (MODIS) leaf area index (LAI) and fraction of photosynthetically active radiation (FPAR) algorithm for the case of spatially heterogeneous broadleaf forests. Data collected by a Boston University research group during the July 2000 field campaign at the Earth Observing System (EOS) core validation site, Harvard Forest, MA, were used for this purpose. The analysis covers three themes. First, the assumption of wavelength independence of spectral invariants of transport equation, central to the parameterization of the MODIS LAI and FPAR algorithm, is evaluated. The physical interpretation of those parameters is given and an approach to minimize the uncertainties in its retrievals is proposed. Second, the theoretical basis of the algorithm was refined by introducing stochastic concepts which account for the effect of foliage clumping and discontinuities on LAI retrievals. Third, the effect of spatial heterogeneity in FPAR was analyzed and compared to FPAR variation due to diurnal changes in solar zenith angle (SZA) to asses the validity of its static approximation.
Generation of dense time series synthetic Landsat data through data blending with MODIS using a spatial and temporal adaptive reflectance fusion model
[J].
DOI:10.1016/j.rse.2009.05.011
URL
[本文引用: 1]
Landsat imagery with a 3002m spatial resolution is well suited for characterizing landscape-level forest structure and dynamics. While Landsat images have advantageous spatial and spectral characteristics for describing vegetation properties, the Landsat sensor's revisit rate, or the temporal resolution of the data, is 1602days. When considering that cloud cover may impact any given acquisition, this lengthy revisit rate often results in a dearth of imagery for a desired time interval (e.g., month, growing season, or year) especially for areas at higher latitudes with shorter growing seasons. In contrast, MODIS (MODerate-resolution Imaging Spectroradiometer) has a high temporal resolution, covering the Earth up to multiple times per day, and depending on the spectral characteristics of interest, MODIS data have spatial resolutions of 25002m, 50002m, and 100002m. By combining Landsat and MODIS data, we are able to capitalize on the spatial detail of Landsat and the temporal regularity of MODIS acquisitions. In this research, we apply and demonstrate a data fusion approach (Spatial and Temporal Adaptive Reflectance Fusion Model, STARFM) at a mainly coniferous study area in central British Columbia, Canada. Reflectance data for selected MODIS channels, all of which were resampled to 50002m, and Landsat (at 3002m) were combined to produce 18 synthetic Landsat images encompassing the 2001 growing season (May to October). We compared, on a channel-by-channel basis, the surface reflectance values (stratified by broad land cover types) of four real Landsat images with the corresponding closest date of synthetic Landsat imagery, and found no significant difference between real (observed) and synthetic (predicted) reflectance values (mean difference in reflectance: mixed forest x00 = 0.086, σ = 0.088, broadleaf x00 = 0.019, σ = 0.079, coniferous x00 = 0.039, σ = 0.093). Similarly, a pixel based analysis shows that predicted and observed reflectance values for the four Landsat dates were closely related (mean r 2 = 0.76 for the NIR band; r 2 = 0.54 for the red band; p < 0.01). Investigating the trend in NDVI values in synthetic Landsat values over a growing season revealed that phenological patterns were well captured; however, when seasonal differences lead to a change in land cover (i.e., disturbance, snow cover), the algorithm used to generate the synthetic Landsat images was, as expected, less effective at predicting reflectance.
Review article multisensor image fusion in remote sensing:Concepts,methods and applications
[J].
DOI:10.1080/014311698215748
URL
[本文引用: 1]
With the availability of multisensor, multitemporal, multiresolution and multifrequency image data from operational Earth observation satellites the fusion of digital image data has become a valuable tool in remote sensing image evaluation. Digital image fusion is a relatively new research field at the leading edge of available technology. It forms a rapidly developing area of research in remote sensing. This review paper describes and explains mainly pixel based image fusion of Earth observation satellite data as a contribution to multisensor integration oriented data processing.
中低分辨率小波融合的玉米种植面积遥感估算
[J].
DOI:10.3969/j.issn.1002-6819.2012.03.035
Magsci
[本文引用: 2]
采用中分辨率与低分辨率数据相结合的遥感估算方法是获取大范围作物种植面积的主要趋势之一。在MODIS时序影像和TM影像支持下,采用小波变换融合方法获取30 m分辨率的NDVI时间序列信息,构建主要秋季作物的NDVI标准生长曲线,以最小距离分类器进行分层分类,获得河南原阳县玉米种植面积总量信息和空间分布,并以野外实测地块样本进行精度评价。由于充分利用MODIS影像的时间序列优势和TM影像的空间分辨率优势,通过秋季作物之间的物候差异,有效地区分出各种秋季作物的空间分布,基于融合NDVI时间序列信息玉米种植面积遥感估算的位置和面积精度分别达到79%和89%,远高于常规的监督分类,为大范围玉米种植面积遥感估算提供了一种可行的方法。
Estimation of maize planting area based on wavelet fusion of multi-resolution images
[J].
The assessment of multi-sensor image fusion using wavelet transforms for mapping the Brazilian Savanna
[J].
DOI:10.1016/j.jag.2006.01.001
URL
[本文引用: 2]
Multi-sensor image fusion using the wavelet approach provides a conceptual framework for the improvement of the spatial resolution with minimal distortion of the spectral content of the source image. This paper assesses whether images with a large ratio of spatial resolution can be fused, and evaluates the potential of using such fused images for mapping the Brazilian Savanna. Three types of wavelet transforms were used to perform the fusion between MODIS and Landsat TM images. Five quality measures were defined to assess the quality of the fused images. The results showed that it was possible to perform the fusion of MODIS and TM images and the pyramidal in Fourier space wavelet transform provided the best quality measures for the fused images. Classification results showed that fused images could be used for mapping the Brazilian Savanna with an accuracy level comparable to the Landsat TM image.
Spatial and temporal fusion of remote sensing data using wavelet transform
[C]//
Multi-satellite data merge to combine NOAA AVHRR efficiency with Landsat-6 MSS spatial resolution to study vegetation dynamics
[J].
DOI:10.1016/S0273-1177(99)01130-8
URL
[本文引用: 2]
The resulting image features the color of NOAA NDVI and topographic details of MSS intensity. This work offers relevant techniques to extract information from satellite imagery to apply to plant dynamics investigation.
A method for integrating MODIS and Landsat data for systematic monitoring of forest cover and change in the Congo Basin
[J].
DOI:10.1016/j.rse.2007.11.012
URL
[本文引用: 2]
In this paper we demonstrate a new approach that uses regional/continental MODIS (MODerate Resolution Imaging Spectroradiometer) derived forest cover products to calibrate Landsat data for exhaustive high spatial resolution mapping of forest cover and clearing in the Congo River Basin. The approach employs multi-temporal Landsat acquisitions to account for cloud cover, a primary limiting factor in humid tropical forest mapping. A Basin-wide MODIS 250m Vegetation Continuous Field (VCF) percent tree cover product is used as a regionally consistent reference data set to train Landsat imagery. The approach is automated and greatly shortens mapping time. Results for approximately one third of the Congo Basin are shown. Derived high spatial resolution forest change estimates indicate that less than 1% of the forests were cleared from 1990 to 2000. However, forest clearing is spatially pervasive and fragmented in the landscapes studied to date, with implications for sustaining the region's biodiversity. The forest cover and change data are being used by the Central African Regional Program for the Environment (CARPE) program to study deforestation and biodiversity loss in the Congo Basin forest zone. Data from this study are available at http://carpe.umd.edu .
Unmixing-based multisensor multiresolution image fusion
[J].
DOI:10.1109/36.763276
URL
[本文引用: 3]
Constrained and unconstrained algorithms of the multisensor multiresolution technique (MMT) are discussed. They can be applied to unmix low-resolution images using the information about their pixel composition from co-registered high-resolution images. This makes it possible to fuse the low- and high-resolution images for a synergetic interpretation. The constrained unmixing preserves all the available radiometric information of the low-resolution image. On the other hand, the unconstrained unmixing may be preferable in case of noisy data. An analysis of the MMT sensitivity to sensor errors showed that the strongest requirement is the accuracy of geometric co-registration of the data; the co-registration errors should not exceed 0.1-0.2 of the low-resolution pixel size. Applications of the constrained and unconstrained algorithms are illustrated on examples of unmixing and fusion of the multiresolution reflective and thermal bands of a real TM/LANDSAT image as well as of a simulated image of the future ASTER/EOS-AMI sensor.
Definition of spatially variable spectral endmembers by locally calibrated multivariate regression analyses
[J].
DOI:10.1016/S0034-4257(00)00153-X
URL
[本文引用: 2]
Linear regression procedures can be applied to derive spectral endmembers using satellite images and superimposed abundance estimates of known components. A common problem, however, is represented by the spatial variability of the spectral endmembers to estimate, which may be caused by variations in several environmental factors (topography, water availability, soil type, etc.). This problem is currently addressed by a modified multivariate regression procedure that can define spatially variable spectral endmembers. The procedure is based on a local calibration of the regression statistics (mean vectors and variance/covariance matrices), which is obtained by weighting the values of the training pixels according to their distance from each pixel examined. The locally found regression statistics are then used to extrapolate pure class spectral endmembers, which are therefore different for each image pixel. An experiment was carried out using multitemporal NOAA-AVHRR NDVI profiles and class abundance estimates of Tuscany region in central Italy. The results show that the spatially variable spectral endmembers are far more accurate than conventional fixed endmembers to recompose the original NDVI imagery. Finally, it is discussed how these spatially variable pure class NDVI values can serve for data integration and as input for agro-meteorological applications and ecosystem simulation modeling.
Combining medium and coarse spatial resolution satellite data to improve the estimation of sub-pixel NDVI time series
[J].
DOI:10.1016/j.rse.2007.04.004
URL
[本文引用: 2]
The potential of multitemporal coarse spatial resolution remotely sensed images for vegetation monitoring is reduced in fragmented landscapes, where most of the pixels are composed of a mixture of different surfaces. Several approaches have been proposed for the estimation of reflectance or NDVI values of the different land-cover classes included in a low resolution mixed pixel. In this paper, we propose a novel approach for the estimation of sub-pixel NDVI values from multitemporal coarse resolution satellite data. Sub-pixel NDVIs for the different land-cover classes are calculated by solving a weighted linear system of equations for each pixel of a coarse resolution image, exploiting information about within-pixel fractional cover derived from a high resolution land-use map. The weights assigned to the different pixels of the image for the estimation of sub-pixel NDVIs of a target pixel i are calculated taking into account both the spatial distance between each pixel and the target and their spectral dissimilarity estimated on medium-resolution remote-sensing images acquired in different periods of the year. The algorithm was applied to daily and 16-day composite MODIS NDVI images, using Landsat-5 TM images for calculation of weights and accuracy evaluation. Results showed that application of the algorithm provided good estimates of sub-pixel NDVIs even for poorly represented land-cover classes (i.e., with a low total cover in the test area). No significant accuracy differences were found between results obtained on daily and composite MODIS images. The main advantage of the proposed technique with respect to others is that the inclusion of the spectral term in weight calculation allows an accurate estimate of sub-pixel NDVI time series even for land-cover classes characterized by large and rapid spatial variations in their spectral properties.
On the blending of the Landsat and MODIS surface reflectance:Predicting daily Landsat surface reflectance
[J].
DOI:10.1109/TGRS.2006.872081
URL
[本文引用: 3]
The 16-day revisit cycle of Landsat has long limited its use for studying global biophysical processes, which evolve rapidly during the growing season. In cloudy areas of the Earth, the problem is compounded, and researchers are fortunate to get two to three clear images per year. At the same time, the coarse resolution of sensors such as the Advanced Very High Resolution Radiometer and Moderate Resolution Imaging Spectroradiometer (MODIS) limits the sensors' ability to quantify biophysical processes in heterogeneous landscapes. In this paper, the authors present a new spatial and temporal adaptive reflectance fusion model (STARFM) algorithm to blend Landsat and MODIS surface reflectance. Using this approach, high-frequency temporal information from MODIS and high-resolution spatial information from Landsat can be blended for applications that require high resolution in both time and space. The MODIS daily 500-m surface reflectance and the 16-day repeat cycle Landsat Enhanced Thematic Mapper Plus (ETM+) 30-m surface reflectance are used to produce a synthetic "daily" surface reflectance product at ETM+ spatial resolution. The authors present results both with simulated (model) data and actual Landsat/MODIS acquisitions. In general, the STARFM accurately predicts surface reflectance at an effective resolution close to that of the ETM+. However, the performance depends on the characteristic patch size of the landscape and degrades somewhat when used on extremely heterogeneous fine-grained landscapes.
A new data fusion model for high spatial-and temporal-resolution mapping of forest disturbance based on Landsat and MODIS
[J].
DOI:10.1016/j.rse.2009.03.007
URL
[本文引用: 2]
Investigating the temporal and spatial pattern of landscape disturbances is an important requirement for modeling ecosystem characteristics, including understanding changes in the terrestrial carbon cycle or mapping the quality and abundance of wildlife habitats. Data from the Landsat series of satellites have been successfully applied to map a range of biophysical vegetation parameters at a 30 m spatial resolution; the Landsat 16 day revisit cycle, however, which is often extended due to cloud cover, can be a major obstacle for monitoring short term disturbances and changes in vegetation characteristics through time. The development of data fusion techniques has helped to improve the temporal resolution of fine spatial resolution data by blending observations from sensors with differing spatial and temporal characteristics. This study introduces a new data fusion model for producing synthetic imagery and the detection of changes termed Spatial Temporal Adaptive Algorithm for mapping Reflectance Change (STAARCH). The algorithm is designed to detect changes in reflectance, denoting disturbance, using Tasseled Cap transformations of both Landsat TM/ETM and MODIS reflectance data. The algorithm has been tested over a 185 185 km study area in west-central Alberta, Canada. Results show that STAARCH was able to identify spatial and temporal changes in the landscape with a high level of detail. The spatial accuracy of the disturbed area was 93% when compared to the validation data set, while temporal changes in the landscape were correctly estimated for 87% to 89% of instances for the total disturbed area. The change sequence derived from STAARCH was also used to produce synthetic Landsat images for the study period for each available date of MODIS imagery. Comparison to existing Landsat observations showed that the change sequence derived from STAARCH helped to improve the prediction results when compared to previously published data fusion techniques.
An enhanced spatial and temporal adaptive reflectance fusion model for complex heterogeneous regions
[J].
DOI:10.1016/j.rse.2010.05.032
URL
[本文引用: 2]
Due to technical and budget limitations, remote sensing instruments trade spatial resolution and swath width. As a result not one sensor provides both high spatial resolution and high temporal resolution. However, the ability to monitor seasonal landscape changes at fine resolution is urgently needed for global change science. One approach is to lend the radiometry from daily, global data (e.g. MODIS, MERIS, SPOT-Vegetation) with data from high-resolution sensors with less frequent coverage (e.g. Landsat, CBERS, ResourceSat). Unfortunately, existing algorithms for blending multi-source data have some shortcomings, particularly in accurately predicting the surface reflectance of heterogeneous landscapes. This study has developed an enhanced spatial and temporal adaptive reflectance fusion model (ESTARFM) based on the existing STARFM algorithm, and has tested it with both simulated and actual satellite data. Results show that ESTARFM improves the accuracy of predicted fine-resolution reflectance, especially for heterogeneous landscapes, and preserves spatial details. Taking the NIR band as an example, for homogeneous regions the prediction of the ESTARFM is slightly better than the STARFM (average absolute difference [ AAD] 0.0106 vs. 0.0129 reflectance units). But for a complex, heterogeneous landscape, the prediction accuracy of ESTARFM is improved even more compared with STARFM ( AAD 0.0135 vs. 0.0194). This improved fusion algorithm will support new investigations into how global landscapes are changing across both seasonal and interannual timescales.
高时空分辨率NDVI数据集构建方法
[J].
DOI:10.11834/jrs.20110104
URL
Magsci
[本文引用: 2]
针对ETM 空间分辨率高和MODIS 时间分辨率高的特点, 选择官厅水库上游为实验区, 基于对STARFM方法的改进, 构建不同时空分辨率NDVI 的时空融合模型-STAVFM, 使用该模型对ETM NDVI 与MODIS NDVI 融合, 构建了高时空分辨率NDVI 数据集。研究结果表明, STAVFM 根据植被变化特点定义了有效时间窗口, 在考虑物候影响的同时改进了时间维的加权方式, 通过MODIS NDVI 时间变化信息与ETM NDVI 空间差异信息的有机结合, 实现缺失高空间分辨率NDVI 的有效预测(3 景预测NDVI 与实际NDVI 的相关系数分别达到了0.82、0.90 和0.91), 从而构建高时空分辨率NDVI 数据集, 其时间上保留了高时间分辨率数据的时间变化趋势, 空间上又反映高空间分辨率数据的空间细节差异。
Method to construct high spatial and temporal resolution NDVI dataset-STAVFM
[J].
Generation of high spatial and temporal resolution NDVI and its application in crop biomass estimation
[J].
DOI:10.1080/17538947.2011.623189
URL
[本文引用: 2]
While data like HJ-1 CCD images have advantageous spatial characteristics for describing crop properties, the temporal resolution of the data is rather low, which can be easily made worse by cloud contamination. In contrast, although Moderate Resolution Imaging Spectroradiometer (MODIS) can only achieve a spatial resolution of 250 m in its normalised difference vegetation index (NDVI) product, it has a high temporal resolution, covering the Earth up to multiple times per day. To combine the high spatial resolution and high temporal resolution of different data sources, a new method (Spatial and Temporal Adaptive Vegetation index Fusion Model [STAVFM]) for blending NDVI of different spatial and temporal resolutions to produce high spatial temporal resolution NDVI datasets was developed based on Spatial and Temporal Adaptive Reflectance Fusion Model (STARFM). STAVFM defines a time window according to the temporal variation of crops, takes crop phenophase into consideration and improves the temporal weighting algorithm. The result showed that the new method can combine the temporal information of MODIS NDVI and spatial difference information of HJ-1 CCD NDVI to generate an NDVI dataset with both high spatial and high temporal resolution. An application of the generated NDVI dataset in crop biomass estimation was provided. An average absolute error of 17.2% was achieved. The estimated winter wheat biomass correlated well with observed biomass (R2 of 0.876). We conclude that the new dataset will improve the application of crop biomass estimation by describing the crop biomass accumulation in detail. There is potential to apply the approach in many other studies, including crop production estimation, crop growth monitoring and agricultural ecosystem carbon cycle research, which will contribute to the implementation of Digital Earth by describing land surface processes in detail.
Wavelet based image fusion techniques:An introduction,review and comparison
[J].
DOI:10.1016/j.isprsjprs.2007.05.009
URL
[本文引用: 1]
Image fusion involves merging two or more images in such a way as to retain the most desirable characteristics of each. When a panchromatic image is fused with multispectral imagery, the desired result is an image with the spatial resolution and quality of the panchromatic imagery and the spectral resolution and quality of the multispectral imagery. Standard image fusion methods are often successful at injecting spatial detail into the multispectral imagery but distort the colour information in the process. Over the past decade, a significant amount of research has been conducted concerning the application of wavelet transforms in image fusion. In this paper, an introduction to wavelet transform theory and an overview of image fusion technique are given, and the results from a number of wavelet-based image fusion schemes are compared. It has been found that, in general, wavelet-based schemes perform better than standard schemes, particularly in terms of minimizing colour distortion. Schemes that combine standard methods with wavelet transforms produce superior results than either standard methods or simple wavelet-based methods alone. The results from wavelet-based methods can also be improved by applying more sophisticated models for injecting detail information; however, these schemes often have greater set-up requirements.
Synjournal of multispectral images to high spatial resolution:A critical review of fusion methods based on remote sensing physics
[J].
DOI:10.1109/TGRS.2007.912448
URL
[本文引用: 1]
Our framework is the synthesis of multispectral images (MS) at higher spatial resolution, which should be as close as possible to those that would have been acquired by the corresponding sensors if they had this high resolution. This synthesis is performed with the help of a high spatial but low spectral resolution image: the panchromatic (Pan) image. The fusion of the Pan and MS images is classically referred as pan-sharpening. A fused product reaches good quality only if the characteristics and differences between input images are taken into account. Dissimilarities existing between these two data sets originate from two causes-different times and different spectral bands of acquisition. Remote sensing physics should be carefully considered while designing the fusion process. Because of the complexity of physics and the large number of unknowns, authors are led to make assumptions to drive their development. Weaknesses and strengths of each reported method are raised and confronted to these physical constraints. The conclusion of this critical survey of literature is that the choice in the assumptions for the development of a method is crucial, with the risk to drastically weaken fusion performance. It is also shown that the Amelioration de la Resolution Spatiale par Injection de Structures concept prevents from introducing spectral distortion into fused products and offers a reliable framework for further developments.
Acerbi-Junior F W,et al.Scaling dimensions in spectroscopy of soil and vegetation
[J].
DOI:10.1016/j.jag.2006.08.003
URL
[本文引用: 1]
All three described scaling techniques can be integrated as the relevant methodological steps within a complex multi-source approach. We present this concept of combining numerous optical remote sensing data and methods to generate inputs for ecosystem process models.
基于多源数据融合的玉米种植面积遥感提取研究
[D].
Study on Extraction of Maize Planting Area Based on Multi Source Remote Sensing Fusion Data
[D].
Retrieval of temporal profiles of reflectances from simulated and real NOAA-AVHRR data over heterogeneous landscapes
[J].
DOI:10.1080/014311600210551
URL
[本文引用: 1]
To carry out functioning and dynamic vegetation studies, a temporal analysis is needed. So far, only data provided by the National Oceanic and Atmospheric Administration (NOAA) satellites with Advanced Very High Resolution Radiometer (AVHRR) sensors offer the required temporal resolution, but their spatial resolution is coarse (1.1 km). But, in many situations, the vegetation cover is heterogeneous and the 1.1 km AVHRR pixel contains several types of land use radiometrically different and is, in fact, a mixed pixel. Thus, the reflectance and consequently deduced parameters (NDVI, LAI, etc.) measured by AVHRR is actually average value and does not represent a value for each vegetation class present in the pixel. The objective is to extract the reflectance of each vegetation class from the mixed pixel using NOAA-AVHRR data and SPOT-HRV data simultaneously which give the proportions of each type of vegetation inside the mixed pixel through a classification map. The paper presents a method for radiometrically unmixing coarse resolution signals through the inversion of linear mixture modelling on heterogeneous regions of natural vegetation (Bidi-Bahn) in Burkina-Faso and in Niger (Hapex site). In a first step, simulated coarse resolution data (NOAA-AVHRR) obtained from the degradation of SPOT images are used to assess the method. In a second step, real NOAA-AVHRR data are used and some elements of validation are given by comparing the results to airborne reflectance measurements.
Spectral linear mixing model in low spatial resolution image data
[J].
DOI:10.1109/IGARSS.2004.1369815
URL
Different ways to estimate the spectral reflectance for the component classes in a mixture problem have been proposed in the literature (pure pixels, spectral library, field measurements). One of the most common approaches consists in the use of pure pixels, i.e., pixels that are covered by a single component class. This approach presents the advantage of allowing the extraction of the components' reflectance directly from the image data. This approach, however, is generally not feasible in the case of low spatial resolution image data, due to the large ground area covered by a single pixel. In this paper, a methodology aiming to overcome this limitation is proposed. The proposed approach makes use of the spectral linear mixing model. In the proposed methodology, the components' proportions in image data are estimated using a medium spatial resolution image as auxiliary data. The linear mixing model is then solved for the unknown spectral reflectances. Experiments are presented, using Terra Moderate Resolution Imaging Spectroradiometer (MODIS) and Landsat Enhanced Thematic Mapper Plus, as low and medium spatial resolution image data, respectively, acquired on the same date over the Tapajos study site, Brazilian Amazon. Three component classes or endmembers are present in the scene covered by the experiment, namely vegetation, exposed soil, and shade. The components' spectral reflectance for the Terra MODIS spectral bands were then estimated by applying the proposed methodology. The reliability of these estimates is appraised by analyzing scatter diagrams produced by the Terra MODIS spectral bands and also by comparing the fraction images produced using both image datasets. This methodology appears appropriate for up-scaling information for regional and global studies.
Estimation of Surface Variables at the Sub-Pixel Level for Use As Input to Climate and Hydrological Models[R].Québec:
Integration of high and low resolution NDVI data for monitoring vegetation in Mediterranean environments
[J].
DOI:10.1016/S0034-4257(97)00131-4
URL
The integration of the useful features of high and low spatial and temporal resolution satellite data is a major issue in remote sensing studies. The current work presents the development and testing of a procedure based on classification and regression analysis techniques for generating an NDVI data set with the spatial resolution of Landsat TM images and the temporal resolution of NOAA AVHRR maximum-value composites. The procedure begins with a classification of the high resolution TM data which yields land use references. These are degraded to low spatial resolution in order to produce abundance images comparable with the AVHRR data. Linear regressions are then applied between the AVHRR NDVI data and the abundance images to estimate the profiles of the pure classes, which are then merged to the high spatial resolution classification outputs to generate an integrated data set. Experiments carried out in an area of Tuscany (Central Italy) intercomparing different strategies for each methodological step (hard and fuzzy classification, mean and Gaussian degradation, uni- and multivariate regression) identified an optimum methodology composed of fuzzy classification, mean degradation, and multivariate regression procedures.
Combining MODIS and Landsat imagery to estimate and map boreal forest cover loss
[J].
DOI:10.1016/j.rse.2008.05.006
URL
[本文引用: 1]
Estimation of forest cover change is important for boreal forests, one of the most extensive forested biomes, due to its unique role in global timber stock, carbon sequestration and deposition, and high vulnerability to the effects of global climate change. We used time-series data from the MODerate Resolution Imaging Spectroradiometer (MODIS) to produce annual forest cover loss hotspot maps. These maps were used to assign all blocks (18.5 by 18.5 km) partitioning the boreal biome into strata of high, medium and low likelihood of forest cover loss. A stratified random sample of 118 blocks was interpreted for forest cover and forest cover loss using high spatial resolution Landsat imagery from 2000 and 2005. Area of forest cover gross loss from 2000 to 2005 within the boreal biome is estimated to be 1.63% (standard error 0.10%) of the total biome area, and represents a 4.02% reduction in year 2000 forest cover. The proportion of identified forest cover loss relative to regional forest area is much higher in North America than in Eurasia (5.63% to 3.00%). Of the total forest cover loss identified, 58.9% is attributable to wildfires. The MODIS pan-boreal change hotspot estimates reveal significant increases in forest cover loss due to wildfires in 2002 and 2003, with 2003 being the peak year of loss within the 5-year study period. Overall, the precision of the aggregate forest cover loss estimates derived from the Landsat data and the value of the MODIS-derived map displaying the spatial and temporal patterns of forest loss demonstrate the efficacy of this protocol for operational, cost-effective, and timely biome-wide monitoring of gross forest cover loss.
Spatio-temporal reflectance fusion via unmixing:Accounting for both phenological and land-cover changes
[J].
DOI:10.1080/01431161.2014.951097
URL
[本文引用: 1]
Owing to technical limitations the acquisition of fine spatial resolution images (e.g. Landsat data) with frequent (e.g. daily) coverage remains a challenge. One approach is to generate frequent Landsat surface reflectances through blending with coarse spatial resolution images (e.g. Moderate Resolution Imaging Spectroradiometer, MODIS). Existing implementations for data blending, such as the Spatial and Temporal Adaptive Reflectance Fusion Model (STARFM) and Enhanced STARFM (ESTARFM), have their shortcomings, particularly in predicting the surface reflectance characterized by land-cover-type changes. This article proposes a novel blending model, namely the Unmixing-based Spatio-Temporal Reflectance Fusion Model (U-STFM), to estimate the reflectance change trend without reference to the change type, i.e. phenological change (e.g. seasonal change in vegetation) or land-cover change (e.g. conversion of a vegetated area to a built-up area). It is based on homogeneous change regions (HCRs) that are delineated by segmenting the Landsat reflectance difference images. The proposed model was tested on both simulated and actual data sets featuring phenological and land-cover changes. It proved more capable of capturing both types of change compared to STARFM and ESTARFM. The improvement was particularly observed on those areas characterized by land-cover-type changes. This improved fusion algorithm will thereby open new avenues for the application of spatio-temporal reflectance fusion.
融合多源遥感数据生成高时空分辨率数据的方法对比
[J].融合多源遥感数据生成高时空分辨率数据具有重要的应用价值.对目前常用的3种时空融合方法进行对比分析, 即基于时序数据(STIFM)、基于混合像元分解(STDFM)和增强型自适应遥感图像(ESTATFM)的时空融合方法.以盈科灌区为例, 由多时相的MODIS数据提取地物的时间变化信息, 结合初期的ASTER/TM影像的空间信息, 融合生成30m具有MODIS时间分辨率的数据.以真实的ASTER数据为基准, 从光谱特征和地物类别的角度定量评价结果, 表明STDFM和ESTATFM分别在红波段和近红外波段取得效果最优, 相关系数分别为0.91和0.71, 3种方法融合的NDVI效果基本相当, 相关系数均高于0.84.在地物类别空间信息的表达方面, ESTATFM方法在异质性较强的玉米和小麦区域具有较好的适用性.
Intercomparison of the different fusion methods for generating high spatial-temporal resolution data
[J].
Downscaling time series of MERIS full resolution data to monitor vegetation seasonal dynamics
[J].
DOI:10.1016/j.rse.2009.04.011
URL
[本文引用: 1]
Monitoring vegetation dynamics is fundamental for improving Earth system models and for increasing our understanding of the terrestrial carbon cycle and the interactions between biosphere and climate. Medium spatial resolution sensors, like MERIS, exhibit a significant potential to study these dynamics over large areas because of their spatial, spectral and temporal resolution. However, the spatial resolution provided by MERIS (300m in full resolution mode) is not appropriate to monitor heterogeneous landscapes, where typical length scales of these dynamics rarely reach 300m. We, therefore, motivate the use of data fusion techniques to downscale medium spatial resolution data (MERIS full resolution, FR) to a Landsat-like spatial resolution (25m). An unmixing-based data fusion approach was applied to a time series of MERIS FR images acquired over The Netherlands. The selected data fusion approach is based on the linear mixing model and uses a high spatial resolution land use database to produce images having the spectral and temporal resolution as provided by MERIS, but a Landsat-like spatial resolution. A quantitative assessment of the quality of the fused images was done in order to test the validity of the proposed method and to evaluate the radiometric characteristics of the MERIS fused images. The resulting series of fused images was subsequently used to compute two vegetation indices specifically designed for MERIS: the MERIS terrestrial chlorophyll index (MTCI) and the MERIS global vegetation index (MGVI). These indices represent continuous fields of canopy chlorophyll (MTCI) and of the fraction of photosynthetically active radiation absorbed by the canopy (MGVI). Results indicate that the selected data fusion approach can be successfully used to downscale MERIS data and, therefore, to monitor vegetation dynamics at Landsat-like spatial, and MERIS-like spectral and temporal resolution.
融合MODIS与Landsat数据生成高时间分辨率Landsat数据
[J].遥感数据时空融合技术是一种低空间分辨率影像与中空间分辨率影像在时间域和空间域的融合技术,利用遥感数据时空融合技术获得的融合影像既具备低空间分辨率影像的高时间分辨率特征,又具备中空间分辨率影像的高空间分辨率特征.提出了一种新的遥感数据时空融合方法(STDFA).该方法从时序MODIS数据中提取地物的时间变化信息,结合早期Landsat-TM影像的纹理信息,融合出具有MODIS时间分辨率和TM空间分辨率的影像.以江苏省南京市江宁区为研究区,以Landsat红波段和近红外波段为融合波段,对该方法进行了测试.结果显示,该方法能够产生高精度的中空间分辨率影像,融合影像与真实影像间的相关系数达到0.939.融合影像计算的NDVI与真实中空间分辨率影像计算的NDVI间的相关性达到0.938.
A model for spatial and temporal data fusion
[J].
Use of MODIS and Landsat time series data to generate high-resolution temporal synthetic Landsat data using a spatial and temporal reflectance fusion model
[J].
DOI:10.1117/1.JRS.6.063507
URL
[本文引用: 1]
中国科学院机构知识库(中国科学院机构知识库网格(CAS IR GRID))以发展机构知识能力和知识管理能力为目标,快速实现对本机构知识资产的收集、长期保存、合理传播利用,积极建设对知识内容进行捕获、转化、传播、利用和审计的能力,逐步建设包括知识内容分析、关系分析和能力审计在内的知识服务能力,开展综合知识管理。
利用遥感数据时空融合技术提取水稻种植面积
[J].
DOI:10.3969/j.issn.1002-6819.2010.z2.010
URL
Magsci
[本文引用: 1]
蒸渗仪是用来研究营养元素在农田中的运移的系统,本文系统描述了一种大型蒸渗仪的设计,建造与安装。试验采用湖北地区典型土壤类型黄棕壤与潮土,在华中农业大学校园内每种土壤安装16个大型蒸渗仪。蒸渗仪采用减少土柱的扰动的方法建造,并填充凡士林减少土壤水分的边缘流动。蒸渗仪采用外径630 mm高700 mm厚10 mm的PVC管作材料。土柱建成后安装在预制PVC底座上,底座中间有一圆孔外接淋失液收集装置。淋失液收集后用来测定淋失液离子含量。试验结果表明,相同土壤土柱之间淋失量差异不显著,没有检测到水分的边缘流动;同时建设效率高,费用低。
Mapping paddy fields by using spatial and temporal remote sensing data fusion technology
[J].
Landsat8和MODIS融合构建高时空分辨率数据识别秋粮作物
[J].
DOI:10.11834/jrs.20154213
URL
[本文引用: 1]
本文利用Wu等人提出的遥感数据时空融合方法 STDFA(Spatial Temporal Data Fusion Approach)以Landsat 8和MODIS为数据源构建高时间、空间分辨率的遥感影像数据。以此为基础,构建15种30 m分辨率分类数据集,然后利用支持向量机SVM(Support Vector Machine)进行秋粮作物识别,验证不同维度分类数据集进行秋粮作物识别的适用性。实验结果显示,不同分类数据集的秋粮作物分类结果均达到了较高的识别精度。综合各项精度指标分析,Red+Phenology数据组合对秋粮识别效果最好,水稻识别的制图精度和用户精度分别达到91.76%和82.49%,玉米识别的制图精度和用户精度分别达到85.80%和74.97%,水稻和玉米识别的总体精度达到86.90%。
Fusion of MODIS and Landsat8 images to generate high spatial-temporal resolution data for mapping autumn crop distribution
[J].
A comparison of STARFM and an unmixing-based algorithm for Landsat and MODIS data fusion
[J].
DOI:10.1016/j.rse.2014.09.012
URL
[本文引用: 1]
The focus of the current study is to compare data fusion methods applied to sensors with medium- and high-spatial resolutions. Two documented methods are applied, the spatial and temporal adaptive reflectance fusion model (STARFM) and an unmixing-based method which proposes a Bayesian formulation to incorporate prior spectral information. Furthermore, the strengths of both algorithms are combined in a novel data fusion method: the Spatial and Temporal Reflectance Unmixing Model (STRUM). The potential of each method is demonstrated using simulation imagery and Landsat and MODIS imagery. The theoretical basis of the algorithms causes STARFM and STRUM to produce Landsat-like reflectances while preserving the spatial patterns found in Landsat images, and the unmixing-based method to produce MODIS-like reflectances. The ability of fused images to capture phenological variations is also assessed using temporal NDVI profiles. Temporal profiles of STARFM NDVI closely resembled Landsat NDVI profiles. However, the unmixing-based method and STRUM produced a more accurate reconstruction of the NDVI trajectory in experiments simulating situations where few input high-resolution images are available. STRUM had the best performance as it produced surface reflectances which had the highest correlations to reference Landsat images. The results of this study indicate that STRUM is more suitable for data fusion applications requiring Landsat-like surface reflectances, such as gap-filling and cloud masking, especially in situations where few high-resolution images are available. Unmixing-based data fusion is recommended in situations which downscale the spectral characteristics of the medium-resolution input imagery and the STARFM method is recommended for constructing temporal profiles in applications containing many input high-resolution images.
An improved image fusion approach based on enhanced spatial and temporal the adaptive reflectance fusion model
[J].
DOI:10.3390/rs5126346
URL
[本文引用: 1]
中国科学院机构知识库(CAS IR GRID)以发展机构知识能力和知识管理能力为目标,快速实现对本机构知识资产的收集、长期保存、合理传播利用,积极建设对知识内容进行捕获、转化、传播、利用和审计的能力,逐步建设包括知识内容分析、关系分析和能力审计在内的知识服务能力,开展综合知识管理。
Multi-temporal MODIS-Landsat data fusion for relative radiometric normalization,gap filling, and prediction of Landsat data
[J].
DOI:10.1016/j.rse.2008.03.009
URL
[本文引用: 1]
A semi-physical fusion approach that uses the MODIS BRDF/Albedo land surface characterization product and Landsat ETM+ data to predict ETM+ reflectance on the same, an antecedent, or subsequent date is presented. The method may be used for ETM+ cloud/cloud shadow and SLC-off gap filling and for relative radiometric normalization. It is demonstrated over three study sites, one in Africa and two in the U.S. (Oregon and Idaho) that were selected to encompass a range of land cover land use types and temporal variations in solar illumination, land cover, land use, and phenology. Specifically, the 30 m ETM+ spectral reflectance is predicted for a desired date as the product of observed ETM+ reflectance and the ratio of the 500 m surface reflectance modeled using the MODIS BRDF spectral model parameters and the sun-sensor geometry on the predicted and observed Landsat dates. The difference between the predicted and observed ETM+ reflectance (prediction residual) is compared with the difference between the ETM+ reflectance observed on the two dates (temporal residual) and with respect to the MODIS BRDF model parameter quality. For all three scenes, and all but the shortest wavelength band, the mean prediction residual is smaller than the mean temporal residual, by up to a factor of three. The accuracy is typically higher at ETM+ pixel locations where the MODIS BRDF model parameters are derived using the best quality inversions. The method is most accurate for the ETM+ near-infrared (NIR) band; mean NIR prediction residuals are 9%, 12% and 14% of the mean NIR scene reflectance of the African, Oregon and Idaho sites respectively. The developed fusion approach may be applied to any high spatial resolution satellite data, does not require any tuning parameters and so may be automated, is applied on a per-pixel basis and is unaffected by the presence of missing or contaminated neighboring Landsat pixels, accommodates for temporal variations due to surface changes (e.g., phenological, land cover/land use variations) observable at the 500 m MODIS BRDF/Albedo product resolution, and allows for future improvements through BRDF model refinement and error assessment.
Operational data fusion framework for building frequent landsat-like imagery
[J].
DOI:10.1109/TGRS.2014.2311445
URL
[本文引用: 1]
An operational data fusion framework was built to generate dense time-series Landsat-like images by fusing MODIS data products and Landsat imagery. The spatial and temporal adaptive reflectance fusion model (STARFM) was integrated in the framework. Compared with earlier implementations of the STARFM, several improvements have been incorporated in the operational data fusion framework. These include viewing angular correction on the MODIS daily bidirectional reflectance, precise and automated coregistration on MODIS and Landsat paired images, and automatic selection of Landsat and MODIS paired dates. Three tests that use MODIS and Landsat data pairs from the same season of the same year, the same season of two different years, and different seasons from adjacent years were performed over a Landsat scene in northern India using the integrated STARFM operational framework. The results show that the accuracy of the predicted results depends on the data consistency between the MODIS nadir bidirectional-reflectance-distribution-function-adjusted reflectance and Landsat surface reflectance on both the paired dates and the prediction dates. When MODIS and Landsat reflectances were consistent, the maximum difference of the predicted results for all Landsat spectral bands, except the blue band, was about 0.007 (or 5.1% relatively). However, differences were larger (0.026 in absolute and 13.8% in relative, except the blue band) when two data sources were inconsistent. In an extreme case, the difference for blue-band reflectance was as large as 0.029 (or 39.1% relatively). Case studies focused on monitoring vegetation condition in central India and the Hindu Kush Himalayan region. In general, spatial and temporal landscape variation could be identified with a high level of detail from the fused data. Vegetation index trajectories derived from the fused products could be associated with specific land cover types that occur in the study regions. The operational data fusion framework provides a feasible and cost-effective way to build dense time-series images at Landsat spatial resolution for cloudy regions.
一种拓展的半物理时空融合算法及其初步应用
[J].
DOI:10.11834/jrs.20143213
URL
Magsci
[本文引用: 1]
Landsat 5卫星较低的时间分辨率(16天)使得其很难获得大区域的、时相一致的清晰影像数据集。本文发展了一种基于半物理模型的时空融合算法-即乘性调制融合算法,并借助多时序的MODIS反射率数据来生成多时相的Landsat TM/ETM+反射率合成影像,经镶嵌后得到区域尺度的高时空分辨率地表反射率数据集(Landsat TM/ETM+)。本文利用吉林省2006年―2011年的Landsat 5 TM地表反射率数据以及500 m的MOD09A1反射率产品来生成3个时相的Landsat 5 TM反射率合成数据,从而获得研究区在上述时相下地表反射率数据的镶嵌图。初步分析表明,所生成的Landsat 5 TM反射率数据的光谱分布特征与MOD09A1反射率数据较为一致,且图像在整体上光谱特征的连续性较好。
Spatial-temporal fusion algorithm based on an extended semi-physical model and its preliminary application
[J].
Evaluation of Landsat and MODIS data fusion products for analysis of dryland forest phenology
[J].
DOI:10.1016/j.rse.2011.10.014
URL
[本文引用: 1]
Current satellite sensors provide data of insufficient spatial and temporal resolutions to fully characterize the patchy phenology patterns of dryland forests. The spatial and temporal adaptive reflectance fusion model (STARFM) is an algorithm that fuses Landsat 30 m data with MODIS 500 m data to produce synthetic imagery at Landsat spatial resolution and MODIS time steps. In this study, we evaluated the feasibility of using STARFM to produce synthetic imagery over a dryland vegetation study site for the purpose of tracking phenological changes. We assembled subsets of six Landsat-5 TM scenes and temporally-coincident MODIS datasets spanning the 2006 April ctober growing season in central-northern Arizona, which is characterized by large tracts of dryland forest. To investigate the effects of temporal compositing, BRDF-adjustment, and base pair timing on the accuracy of the resulting synthetic imagery, we employed a range of MODIS 500 m surface reflectance datasets (daily, 8-day composite, and 16-day Nadir BRDF-Adjusted Reflectance (NBAR)) as well as initial Landsat/MODIS imagery pairs from opposite ends of the growing season. The STARFM algorithm was applied to each MODIS data series to produce up to twelve synthetic images corresponding to each Landsat image. We evaluated the accuracy of the synthetic images by comparing the reflectance values of a random sample of the vegetation pixels with the corresponding pixel values of the reference Landsat image on a band-by-band basis. Our results indicate that the NBAR imagery is the optimal dataset for use with Landsat-5 TM data in this area. The NBAR dataset consistently returned the lowest absolute difference values and the highest correlations. A comparison of landscape-scale maps of the timing and value of the peak NDVI derived from STARFM, Landsat, and MODIS (NBAR) time series across the full 2006 growing season shows the effect of the heightened spatial and temporal resolution offered by a STARFM-based dataset. This work demonstrates the feasibility of using the STARFM algorithm to assemble an imagery time series at Landsat spatial resolution and MODIS temporal resolution in vegetated dryland ecosystems.
Enhancing temporal resolution of satellite imagery for public health studies:A case study of West Nile Virus outbreak in Los Angeles in 2007
[J].
DOI:10.1016/j.rse.2011.06.023
URL
[本文引用: 1]
Although remotely sensed data have been used in public health studies, these studies are often limited by the critical choice that has to be made in data selection: either using data with high spatial but low temporal resolution, or data with high temporal but low spatial resolution. This choice creates significant limitations for time-dependent epidemiological studies, since it is often essential to have datasets with high spatial and temporal resolution. Effectively synthesizing high temporal resolution imagery with high spatial resolution imagery can potentially ease this limitation. To this end, we conducted an experiment by creating a series of simulated ASTER datasets by fusing ASTER and MODIS data with the STARFM image fusion model. These simulated datasets are then used to derive the following urban environmental variables: normalized difference vegetation index, normalized difference water index, and land surface temperature. These variables are used to quantitatively examine the effects of urban environmental characteristics on West Nile Virus dissemination in Los Angeles County, California, where the epidemic was most prevalent in the United States in 2007. Mosquito surveillance data were collected from the weekly summary reports published in the California West Nile Virus website. A spatial–temporal analysis of WNV dissemination was conducted by synthesizing remote sensing variables and mosquito surveillance records. We focused on assessment of WNV risk areas in July through September due to data sufficiency of tested-positive mosquito pools. Moderate- and high-risk areas of WNV infections in mosquitoes were identified for five selected time windows, i.e., epidemiological weeks 30–31, 32–33, 34–35, 36–37, and 38–39. The results show that elevation and urban built-up conditions were negatively associated with the WNV propagation, while LST positively correlated with viral transmission. NDVI was not significantly associated with WNV transmission during the studied time intervals. San Fernando Valley was found to be the most vulnerable to mosquito infections of WNV within the City of Los Angeles. With the complementation of high-spatial resolution ASTER and high-temporal resolution MODIS images, the fused image datasets allow for estimating environmental parameters at desired epidemiological weeks. This paper provides important insights into how high temporal resolution remote sensing imagery might be used to study time-dependant events in public health, especially in the operational surveillance and control of vector-borne or other epidemic diseases.
Generation and evaluation of gross primary productivity using Landsat data through blending with MODIS data
[J].
DOI:10.1016/j.jag.2010.06.007
URL
[本文引用: 1]
Spatial and Temporal Adaptive Reflectance Fusion Model (STARFM) has been used for the blending of Landsat and MODIS data. Specifically, the 3002m Landsat-7 ETM+ (Enhanced Thematic Mapper plus) surface reflectance was predicted for a period of 10 years (2000–2009) as the product of observed ETM+ and MODIS surface reflectance (MOD09A1) on the predicted and observed ETM+ dates. A pixel based analysis for six observed ETM+ dates covering winter and summer crops showed that the prediction method was more accurate for NIR band (mean r 2 02=020.71, p 02≤020.01) compared to green band (mean r 2 02=020.53; p 02≤020.01). A recently proposed chlorophyll index (CI), which involves NIR and green spectral bands, was used to retrieve gross primary productivity (GPP) as the product of CI and photosynthetic active radiation (PAR). The regression analysis of GPP derived from closet observed and synthetic ETM+ showed a good agreement ( r 2 02=020.85, p 02≤020.01 and r 2 02=020.86, p 02≤020.01) for wheat and sugarcane crops, respectively. The difference between the GPP derived from synthetic and observed ETM+ (prediction residual) was compared with the difference in GPP values from observed ETM+ on the two dates (temporal residual). The prediction residuals (mean value of 1.9702g02C/m 2 in 8 days) was found to be significantly lower than the temporal residuals (mean value of 4.4602g02C/m 2 in 8 days) that correspondence to 12% and 27%, respectively, of GPP values (mean value of 16.5302g02C/m 2 in 8 days) from observed ETM+ data, implying that the prediction method was better than temporal pixel substitution. Investigating the trend in synthetic ETM+ GPP values over a growing season revealed that phenological patterns were well captured for wheat and sugarcane crops. A direct comparison between the GPP values derived from MODIS and synthetic ETM+ data showed a good consistency of the temporal dynamics but a systematic error that can be read as bias (MODIS GPP over estimation). Further, the regression analysis between observed evapotranspiration and synthetic ETM+ GPP showed good agreement ( r 2 02=020.66, p 02≤020.01).
Evaluation of long-term NDVI time series derived from Landsat data through blending with MODIS data
[J].
融合数据在草地生物量估算中的应用
[J].为实现草地生物量的实时高精度监测,将时空适应性反射率融合模型(spatial and temporal adaptive reflectance fusion model,STARFM)融合后的数据引入到草地生物量估算模型中,以提高该模型的精度。以内蒙古锡林浩特市为研究区,首先采用STARFM融合MODIS和Landsat TM数据,同时对比分析反射率和NDVI输入数据的融合效果,认为直接融合NDVI数据得到的高分辨率NDVI产品的精度更高; 然后,基于融合后高精度的NDVI数据与实测生物量建立多种生物量估算模型; 通过统计比较得到最优生物量估算模型——指数模型; 最后,基于融合后NDVI与原始MODIS NDVI数据分别作为自变量建立指数模型,以验证融合数据提高生物量估算模型精度的能力。研究表明,基于融合后NDVI的生物量估算模型决定系数<em>R</em><sup>2</sup>由0.761提高到0.832, 均方根误差由32.521 g/m<sup>2</sup>降低到28.653 g/m<sup>2</sup>,证明融合NDVI数据提高了生物量估算模型的精度。
Application of fused data to grassland biomass estimation
[J].
MODIS-Landsat data fusion for estimating vegetation dynamics:A case study for two ranches in west texas
[C]//
基于局部空间自相关分析的时空数据融合
[J].
DOI:10.11873/j.issn.1004-0323.2015.6.1176
URL
Magsci
[本文引用: 1]
<p>由于受到16 d重访周期与云等对数据质量的影响,具有时间与空间连续性的Landsat 8 OLI观测数据难以直接获取。考虑地物分布的空间自相关性,提出一种基于STARFM模型改进的局部自相关时空数据融合模型(LASTARFM),以新疆维吾尔族自治区喀什地区叶城县为研究区,利用Landsat 8 OLI数据和MODIS数据的红光波段和近红外波段进行融合方法测试。结果表明:利用LASTARFM模型得到的融合影像,与真实影像NDVI相关系数达到0.92;在局部空间自相关性低的区域比STARFM模型影像反映出更多地物细节,具有更高的融合精度;在土地利用类型发生显著变化的区域与真实影像具有一定差异。</p>
A spatial and temporal fusion model using local spatial association analysis method
[J].
A spatial and temporal reflectance fusion model considering sensor observation differences
[J].
DOI:10.1080/01431161.2013.777488
URL
[本文引用: 1]
This article proposes a spatialtemporal expansion method for remote-sensing reflectance by blending observations from sensors with different spatial and temporal characteristics. Compared with the methods used in the past, the main characteristic of the proposed method is consideration of sensor observation differences between different cover types when calculating the weight function of the fusion model. The necessity of the temporal difference factor commonly used in spatialtemporal fusion is also analysed in this article. The method was tested and quantitatively assessed under different landscape situations. The results indicate that the proposed fusion method improves the prediction accuracy of fine-resolution reflectance.
Generating daily land surface temperature at Landsat resolution by fusing Landsat and MODIS data
[J].
DOI:10.1016/j.rse.2014.02.003
URL
[本文引用: 1]
Land surface temperature (LST) is a crucial parameter in investigating environmental, ecological processes and climate change at various scales, and is also valuable in the studies of evapotranspiration, soil moisture conditions, surface energy balance, and urban heat islands. These studies require thermal infrared (TIR) images at both high temporal and spatial resolution to retrieve LST. However, currently, no single satellite sensors can deliver TIR data at both high temporal and spatial resolution. Thus, various algorithms/models have been developed to enhance the spatial or the temporal resolution of TIR data, but rare of those can enhance both spatial and temporal details. This paper presents a new data fusion algorithm for producing Landsat-like LST data by blending daily MODIS and periodic Landsat TM datasets. The original Spatial and Temporal Adaptive Reflectance Fusion Model (STARFM) was improved and modified for predicting thermal radiance and LST data by considering annual temperature cycle (ATC) and urban thermal landscape heterogeneity. The technique of linear spectral mixture analysis was employed to relate the Landsat radiance with the MODIS one, so that the temporal changes in radiance can be incorporated in the fusion model. This paper details the theoretical basis and the implementation procedures of the proposed data fusion algorithm, Spatio-temporal Adaptive Data Fusion Algorithm for Temperature mapping (SADFAT). A case study was conducted that predicted LSTs of five dates in 2005 from July to October in Los Angeles County, California. The results indicate that the prediction accuracy for the whole study area ranged from 1.3 K to 2 K. Like existing spatio-temporal data fusion models, the SADFAT method has a limitation in predicting LST changes that were not recorded in the MODIS and/or Landsat pixels due to the model assumption.
Reconstruction of daily 30 m data from HJ CCD,GF-1 WFV,landsat,and MODIS data for crop monitoring
[J].
DOI:10.3390/rs71215826
URL
[本文引用: 1]
With the recent launch of new satellites and the developments of spatiotemporal data fusion methods, we are entering an era of high spatiotemporal resolution remote-sensing analysis. This study proposed a method to reconstruct daily 30 m remote-sensing data for monitoring crop types and phenology in two study areas located in Xinjiang Province, China. First, the Spatial and Temporal Data Fusion Approach (STDFA) was used to reconstruct the time series high spatiotemporal resolution data from the Huanjing satellite charge coupled device (HJ CCD), Gaofen satellite no. 1 wide field-of-view camera (GF-1 WFV), Landsat, and Moderate Resolution Imaging Spectroradiometer (MODIS) data. Then, the reconstructed time series were applied to extract crop phenology using a Hybrid Piecewise Logistic Model (HPLM). In addition, the onset date of greenness increase (OGI) and greenness decrease (OGD) were also calculated using the simulated phenology. Finally, crop types were mapped using the phenology information. The results show that the reconstructed high spatiotemporal data had a high quality with a proportion of good observations (PGQ) higher than 0.95 and the HPLM approach can simulate time series Normalized Different Vegetation Index (NDVI) very well with R ranging from 0.635 to 0.952 in Luntai and 0.719 to 0.991 in Bole, respectively. The reconstructed high spatiotemporal data were able to extract crop phenology in single crop fields, which provided a very detailed pattern relative to that from time series MODIS data. Moreover, the crop types can be classified using the reconstructed time series high spatiotemporal data with overall accuracy equal to 0.91 in Luntai and 0.95 in Bole, which is 0.028 and 0.046 higher than those obtained by using multi-temporal Landsat NDVI data.
Spatiotemporal reflectance blending in a wetland environment
[J].
DOI:10.1080/17538947.2014.894146
URL
[本文引用: 1]
To understand the mechanism of wetland cover change with both moderate spatial resolution and high temporal frequency, this research evaluates the applicability of a spatiotemporal reflectance blending model in the Poyang Lake area, China, using 9 time-series Landsat-5 Thematic Mapper images and 18 time-series Terra Moderate Resolution Imaging Spectroradiometer images acquired between July 2004 and November 2005. The customized blending model was developed based on the enhanced spatial and temporal adaptive reflectance fusion model (ESTARFM). Reflectance of the moderate-resolution image pixels on the target dates can be predicted more accurately by the proposed customized model than the original ESTARFM. Water level on the input image acquisition dates strongly affected the accuracy of the blended reflectance. It was found that either of the image sets used as prior or posterior inputs are required when the difference of water level between the prior or posterior date and target date at Poyang Hydrological Station is <2.68 m to achieve blending accuracy with a mean average absolute difference of 4% between the observed and blended reflectance in all spectral bands.
Blending MODIS and Landsat images for urban flood mapping
[J].
DOI:10.1080/01431161.2014.903351
URL
[本文引用: 1]
Satellite images provide important data sources for monitoring flood disasters. However, the trade-off between spatial and temporal resolutions of current satellite sensors limits their uses in urban flooding studies. This study applied and compared two data fusion models, the Spatial and Temporal Adaptive Reflectance Fusion Model (STARFM) and Enhanced Spatial and Temporal Adaptive Reflectance Fusion Model (ESTARFM), in generating synthetic flooding images with improved temporal and spatial resolution for flood mapping. The synthetic images are produced in two scenarios: (1) for real-time prediction based on Landsat and MODIS images acquired before the investigated flooding; and (2) for post-disaster prediction based on images acquired after the flooding. The 2005 Hurricane Katrina in New Orleans was selected as a case study. The result shows that the Landsat-like images generated can be successfully applied in flood mapping. Particularly, ESTARFM surpasses STARFM in predicting surface reflectance in both real-time and post-flooding predictions. However, the flood mapping results from the Landsat-like images produced by both STARFM and ESTARFM are similar with overall accuracy around 0.9. Only for the flooding maps of real-time predictions does ESTARFM get a slightly higher overall accuracy than STARFM, indicating that the lower quality of the Landsat-like image generated by STARFM may not affect flood mapping accuracy, due to the marked contrast between land and water. This study suggests great potential of both STARFM and ESTARFM in urban flooding research. Blending multi-sources images could also support other disaster studies that require remotely sensed data with both high spatial and temporal resolution.
Dryland vegetation phenology across an elevation gradient in Arizona,USA,investigated with fused MODIS and Landsat data
[J].
DOI:10.1016/j.rse.2014.01.007
URL
[本文引用: 1]
61Landsat and MODIS data fusion via STARFM can reveal dryland phenology complexity.61Land cover characteristics influence the accuracy of STARFM imagery.61Fused 30m imagery captures phenology variations obscured within 500m MODIS pixels.61Synchronicity of peak EVI and NDVI greenness dates varies by land cover class.
Integrated fusion of multi-scale polar-orbiting and geostationary satellite observations for the mapping of high spatial and temporal resolution land surface temperature
[J].
DOI:10.1016/j.rse.2014.09.013
URL
[本文引用: 1]
Land surface temperature (LST) and its diurnal variation are important when evaluating climate change, the land鈥揳tmosphere energy budget, and the global hydrological cycle. However, the available satellite LST products have either a coarse spatial resolution or a low temporal resolution, which constrains their potential applications. This paper proposes a spatio-temporal integrated temperature fusion model (STITFM) for the retrieval of high temporal and spatial resolution LST from multi-scale polar-orbiting and geostationary satellite observations. Compared with the traditional fusion methods for LST with two different sensors, the proposed method is able to fuse the LST from arbitrary sensors in a unified framework. The model was tested using LST with fine, moderate, and coarse-resolutions. Data from the Landsat Thematic Mapper (TM) and Enhanced Thematic Mapper Plus (ETM +) sensors, the Moderate Resolution Imaging Spectroradiometer (MODIS), the Geostationary Operational Environmental Satellite (GOES) Imager, and the Meteosat Second Generation (MSG) Spinning Enhanced Visible and Infrared Imager (SEVIRI) were used. The fused LST values were evaluated with in situ LST obtained from the Surface Radiation Budget Network (SURFRAD) and the Land Surface Analysis Satellite Application Facility (LSA SAF) project. The final validation results indicate that the STITFM is accurate to within about 2.5 K.
Application of synthetic NDVI time series blended from Landsat and MODIS data for grassland biomass estimation
[J].
DOI:10.3390/rs8010010
URL
[本文引用: 1]
Accurate monitoring of grassland biomass at high spatial and temporal resolutions is important for the effective utilization of grasslands in ecological and agricultural applications. However, current remote sensing data cannot simultaneously provide accurate monitoring of vegetation changes with fine temporal and spatial resolutions. We used a data-fusion approach, namely the spatial and temporal adaptive reflectance fusion model (STARFM), to generate synthetic normalized difference vegetation index (NDVI) data from Moderate-Resolution Imaging Spectroradiometer (MODIS) and Landsat data sets. This provided observations at fine temporal (8-d) and medium spatial (30 m) resolutions. Based on field-sampled aboveground biomass (AGB), synthetic NDVI and support vector machine (SVM) techniques were integrated to develop an AGB estimation model (SVM-AGB) for Xilinhot in Inner Mongolia, China. Compared with model generated from MODIS-NDVI (R2 = 0.73, root-mean-square error (RMSE) = 30.61 g/m2), the SVM-AGB model we developed can not only ensure the accuracy of estimation (R2 = 0.77, RMSE = 17.22 g/m2), but also produce higher spatial (30 m) and temporal resolution (8-d) biomass maps. We then generated the time-series biomass to detect biomass anomalies for grassland regions. We found that the synthetic NDVI-derived estimations contained more details on the distribution and severity of vegetation anomalies compared with MODIS NDVI-derived AGB estimations. This is the first time that we have generated time series of grassland biomass with 30-m and 8-d intervals data through combined use of a data-fusion method and the SVM-AGB model. Our study will be useful for near real-time and accurate (improved resolutions) monitoring of grassland conditions, and the data have implications for arid and semi-arid grasslands management.
Estimating winter wheat biomass by assimilating leaf area index derived from fusion of Landsat-8 and MODIS data
[J].
DOI:10.1016/j.jag.2016.02.001
URL
[本文引用: 1]
A sufficient number of satellite acquisitions in a growing season are essential for deriving agronomic indicators, such as green leaf area index (GLAI), to be assimilated into crop models for crop productivity estimation. However, for most high resolution orbital optical satellites, it is often difficult to obtain images frequently due to their long revisit cycles and unfavorable weather conditions. Data fusion algorithms, such as the Spatial and Temporal Adaptive Reflectance Fusion Model (STARFM) and the Enhanced STARFM (ESTARFM), have been developed to generate synthetic data with high spatial and temporal resolution to address this issue. In this study, we evaluated the approach of assimilating GLAI into the Simple Algorithm for Yield Estimation model (SAFY) for winter wheat biomass estimation. GLAI was estimated using the two-band Enhanced Vegetation Index (EVI2) derived from data acquired by the Operational Land Imager (OLI) onboard the Landsat-8 and a fusion dataset generated by blending the Moderate-Resolution Imaging Spectroradiometer (MODIS) data and the OLI data using the STARFM and ESTARFM models. The fusion dataset had the temporal resolution of the MODIS data and the spatial resolution of the OLI data. Key parameters of the SAFY model were optimised through assimilation of the estimated GLAI into the crop model using the Shuffled Complex Evolution-University of Arizona (SCE-UA) algorithm. A good agreement was achieved between the estimated and field measured biomass by assimilating the GLAI derived from the OLI data (GLAIL) alone (R2=0.77 and RMSE=231gm 2). Assimilation of GLAI derived from the fusion dataset (GLAIF) resulted in aR2of 0.71 and RMSE of 193gm 2while assimilating the combination of GLAILand GLAIFled to further improvements (R2=0.76 and RMSE=176gm鈭2). Our results demonstrated the potential of using the fusion algorithms to improve crop growth monitoring and crop productivity estimation when the number of high resolution remote sensing data acquisitions is limited.
Improving spatiotemporal reflectance fusion using image inpainting and steering kernel regression techniques
[J].
DOI:10.1080/01431161.2016.1271471
URL
[本文引用: 1]
A novel spatiotemporal reflectance fusion method integrating image inpainting and steering kernel regression fusion model (ISKRFM) is proposed to improve the fusion accuracy for remote-sensing images with different temporal and spatial characteristics in this article. This method first detects the land-cover changed regions and then fills them with unchanged similar pixels by an exemplar-based inpainting technique. Furthermore, a steering kernel regression (SKR) is used to adaptively determine the weightings of local neighbouring pixels to predict high spatial resolution image. Accordingly, the main contributions of this method are twofold. One is to address the land-cover change issues in the spatiotemporal fusion, and the other is to establish an adaptive weighting assignment according to the pixel locations and the radiometric properties of the local neighbours to account for the effect of neighbouring pixels. To validate the proposed method, two actual Enhanced Thematic Mapper Plus (ETM+) and Moderate Resolution Imaging Spectroradiometer (MODIS) acquisitions at southeast China were implemented and compared with the baseline spatial and temporal adaptive reflectance fusion model (STARFM). The experimental results demonstrate that addressing the land-cover changes in spatiotemporal fusion has positive effects on the fused image, and the proposed ISKRFM method significantly outperforms STARFM in terms of both visual and quantitative measurements.
A flexible spatiotemporal method for fusing satellite images with different resolutions
[J].
DOI:10.1016/j.rse.2015.11.016
URL
[本文引用: 1]
61FSDAF is developed to fuse multi-sensor images, e.g., Landsat and MODIS.61FSDAF needs minimum input data and is suitable for heterogeneous landscapes.61FSDAF can predict both phenological change and land cover change.61FSDAF can get more accurate fused images than existing methods.61FSDAF can support studies of rapid land surface dynamics.
Image super-resolution via sparse representation
[J].
DOI:10.1109/TIP.2010.2050625
URL
PMID:20483687
[本文引用: 1]
This paper presents a new approach to single-image superresolution, based upon sparse signal representation. Research on image statistics suggests that image patches can be well-represented as a sparse linear combination of elements from an appropriately chosen over-complete dictionary. Inspired by this observation, we seek a sparse representation for each patch of the low-resolution input, and then use the coefficients of this representation to generate the high-resolution output. Theoretical results from compressed sensing suggest that under mild conditions, the sparse representation can be correctly recovered from the downsampled signals. By jointly training two dictionaries for the low- and high-resolution image patches, we can enforce the similarity of sparse representations between the low-resolution and high-resolution image patch pair with respect to their own dictionaries. Therefore, the sparse representation of a low-resolution image patch can be applied with the high-resolution image patch dictionary to generate a high-resolution image patch. The learned dictionary pair is a more compact representation of the patch pairs, compared to previous approaches, which simply sample a large amount of image patch pairs , reducing the computational cost substantially. The effectiveness of such a sparsity prior is demonstrated for both general image super-resolution (SR) and the special case of face hallucination. In both cases, our algorithm generates high-resolution images that are competitive or even superior in quality to images produced by other similar SR methods. In addition, the local sparse modeling of our approach is naturally robust to noise, and therefore the proposed algorithm can handle SR with noisy inputs in a more unified framework.
Spatiotemporal reflectance fusion via sparse representation
[J].
DOI:10.1109/TGRS.2012.2186638
URL
[本文引用: 1]
This paper presents a novel model for blending remote sensing data of high spatial resolution (HSR), taken at infrequent intervals, with those available frequently but at low spatial resolution (LSR) in the context of monitoring and predicting changes in land usage and phenology. Named Parse-representation-based SpatioTemporal reflectance Fusion Model (SPSTFM), the model has been developed for predicting HSR surface reflectances through data blending with LSR scenes. Remarkably, this model forms a unified framework for fusing remote sensing images with temporal reflectance changes, phenology change (e.g., seasonal change of vegetation), or type change (e.g., conversion of farmland to built-up area), by establishing correspondences between structures within HSR images of given areas and their corresponding LSR images. Such corresponding relationship is achieved by means of the sparse representation, specifically by jointly training two dictionaries generated from HSR and LSR difference image patches and sparse coding at the reconstruction stage. SPSTFM was tested using both a simulated data set and an actual data set of Landsat Enhanced Thematic Mapper Plus-Moderate Resolution Imaging Spectroradiometer acquisitions. It was also compared with other related algorithms on two types of data: images primarily with phenology change and images primarily with land-cover type change. Experimental results demonstrate the superiority of SPSTFM in capturing surface reflectance changes on both categories of images.
Spatiotemporal satellite image fusion through one-pair image learning
[J].
DOI:10.1109/TGRS.2012.2213095
URL
[本文引用: 1]
This paper proposes a novel spatiotemporal fusion model for generating images with high-spatial and high-temporal resolution (HSHT) through learning with only one pair of prior images. For this purpose, this method establishes correspondence between low-spatial-resolution but high-temporal-resolution (LSHT) data and high-spatial-resolution but low-temporal-resolution (HSLT) data through the superresolution of LSHT data and further fusion by using high-pass modulation. Specifically, this method is implemented in two stages. In the first stage, the spatial resolution of LSHT data on prior and prediction dates is improved simultaneously by means of sparse representation; in the second stage, the known HSLT and the superresolved LSHTs are fused via high-pass modulation to generate the HSHT data on the prediction date. Remarkably, this method forms a unified framework for blending remote sensing images with temporal reflectance changes, whether phenology change (e.g., seasonal change of vegetation) or land-cover-type change (e.g., conversion of farmland to built-up area) based on a two-layer spatiotemporal fusion strategy due to the large spatial resolution difference between HSLT and LSHT data. This method was tested on both a simulated data set and two actual data sets of Landsat Enhanced Thematic Mapper Plus-Moderate Resolution Imaging Spectroradiometer acquisitions. It was also compared with other well-known spatiotemporal fusion algorithms on two types of data: images primarily with phenology changes and images primarily with land-cover-type changes. Experimental results demonstrated that our method performed better in capturing surface reflectance changes on both types of images.
Impacts of spectral band difference effects on radiometric cross-calibration between satellite sensors in the solar-reflective spectral domain
[J].
DOI:10.1016/j.rse.2007.03.003
URL
[本文引用: 1]
In order for quantitative applications to make full use of the ever-increasing number of Earth observation satellite systems, data from the various imaging sensors involved must be on a consistent radiometric scale. This paper reports on an investigation of radiometric calibration errors due to differences in spectral response functions between satellite sensors when attempting cross-calibration based on near-simultaneous imaging of common ground targets in analogous spectral bands, a commonly used post-launch calibration methodology. Twenty Earth observation imaging sensors (including coarser and higher spatial resolution sensors) were considered, using the Landsat solar reflective spectral domain as a framework. Scene content was simulated using spectra for four ground target types (Railroad Valley Playa, snow, sand and rangeland), together with various combinations of atmospheric states and illumination geometries. Results were obtained as a function of ground target type, satellite sensor comparison, spectral region, and scene content. Overall, if spectral band difference effects (SBDEs) are not taken into account, the Railroad Valley Playa site is a “good” ground target for cross calibration between most but not all satellite sensors in most but not all spectral regions investigated. “Good” is defined as SBDEs within ± 3%. The other three ground target types considered (snow, sand and rangeland) proved to be more sensitive to uncorrected SBDEs than the RVPN site overall. The spectral characteristics of the scene content (solar irradiance, surface reflectance and atmosphere) are examined in detail to clarify why spectral difference effects arise and why they can be significant when comparing different imaging sensor systems. Atmospheric gas absorption features are identified as being the main source of spectral variability in most spectral regions. The paper concludes with recommendations on spectral data and tools that would facilitate cross-calibration between multiple satellite sensors.
A simple and effective radiometric correction method to improve landscape change detection across sensors and across time
[J].DOI:10.1016/j.rse.2005.05.021 URL [本文引用: 1]
多时相遥感影像辐射归一化方法综述
[J].
DOI:10.3969/j.issn.1672-5867.2012.06.003
URL
[本文引用: 1]
多时相遥感影像的辐射归一化是进行变化检测或拼接不可缺少的步骤。本文从绝对辐射归一化和相对辐射归一化两个方面对现有的多时相遥感影像辐射归一化方法进行了总结。对各种辐射归一化方法进行了剖析,并指出了这些方法的优缺点和适应性。最后对多时相遥感影像辐射归一化方法未来的发展进行了展望。
Methods of radiometric normalization for multi-temporal remote sensing images:A review
[J].
A comparative study on radiometric normalization using high resolution satellite images
[J].
DOI:10.1080/01431160601086019
URL
[本文引用: 1]
Remotely sensed multitemporal, multisensor data are often required in Earth observation applications. A common problem associated with the use of multisource image data is the grey value differences caused by non鈥恠urface factors such as different illumination, atmospheric, or sensor conditions. Such differences make it difficult to compare images using the same colour metric system. Image normalization is required to reduce the radiometric influences caused by non鈥恠urface factors and to ensure that the grey value differences between temporal images reflect actual changes on the surface of the Earth.A variety of image normalization methods, such as pseudoinvariant features (PIF), dark and bright set (DB), simple regression (SR), no hange set determined from scattergrams (NC), and histogram matching (HM), have been published in scientific journals. These methods have been tested with either Landsat TM data, MSS data or both, and test results differ from author to author. However, whether or not existing methods could be adopted for normalizing high resolution multispectral satellite images, such as IKONOS and QuickBird, is still open for discussion because of the dramatic change in spatial resolution and the difference of available multispectral bands. In this research, the existing methods are introduced and employed to normalize the radiometric difference between IKONOS and QuickBird multispectral images taken in different years. Some improvements are introduced to the existing methods to overcome problems caused by band difference and to achieve more stable and better results. The normalized results are compared in terms of visual inspection and statistical analysis. This paper examined whether or not existing methods can be directly adopted for image normalization with high resolution satellite images, and showed how these methods can be modified for use with such images.
长时间序列NDVI数据重建方法比较研究进展
[J].
DOI:10.11873/j.issn.1004-0323.2014.2.0362
URL
Magsci
[本文引用: 1]
<p>长时间序列遥感数据集被广泛应用于全球或区域环境变化、植被动态变化、土地覆盖变化和植物生物物理参数反演等研究,受云、气溶胶、太阳高度角和地物二向反射等因素的影响,这些数据集本身存在很多噪声,限制了数据的深入分析和应用,因此,数据重建是应用前的重要工作。在总结归纳现有时间序列重建方法的基础上,综述了重建方法比较研究的成果,深入比较了常用重建方法对参数的设置要求,分析了目前对重建效果的评价方法以及存在的问题,同时对时间序列数据重建通用软件及其发展作了详细介绍。最后提出了时间序列重建以后的研究重点和发展方向,以期为长时间数据重建研究和应用提供帮助。</p>
Advance in method comparison of reconstructing remote sensing time series data sets
[J].
Multi-platform comparisons of MODIS and AVHRR normalized difference vegetation index data
[J].
DOI:10.1016/j.rse.2005.08.014
URL
[本文引用: 1]
The relationship between AVHRR-derived normalized difference vegetation index (NDVI) values and those of future sensors is critical to continued long-term monitoring of land surface properties. The follow-on operational sensor to the AVHRR, the Visible/Infrared Imager/Radiometer Suite (VIIRS), will be very similar to the NASA Earth Observing System's Moderate Resolution Imaging Spectroradiometer (MODIS) sensor. NDVI data derived from visible and near-infrared data acquired by the MODIS (Terra and Aqua platforms) and AVHRR (NOAA-16 and NOAA-17) sensors were compared over the same time periods and a variety of land cover classes within the conterminous United States. The results indicate that the 16-day composite NDVI values are quite similar over the composite intervals of 2002 and 2003, and linear relationships exist between the NDVI values from the various sensors. The composite AVHRR NDVI data included water and cloud masks and adjustments for water vapor as did the MODIS NDVI data. When analyzed over a variety of land cover types and composite intervals, the AVHRR derived NDVI data were associated with 89% or more of the variation in the MODIS NDVI values. The results suggest that it may be possible to successfully reprocess historical AVHRR data sets to provide continuity of NDVI products through future sensor systems.
Multi-sensor NDVI data continuity:Uncertainties and implications for vegetation monitoring applications
[J].
DOI:10.1016/j.rse.2005.10.002
URL
[本文引用: 1]
Consistent NDVI time series are paramount in monitoring ecological resources that are being altered by climate and human impacts. An increasing number of natural resource managers use web-based geospatial decision support tools that integrate time series of both historical and current NDVI data derived from multiple sensors to make better informed planning and management decisions. Representative canopy reflectance and NDVI data were simulated for historical, current and future AVHRR, MODIS and VIIRS land surface monitoring satellites to quantify the differences due to sensor-specific characteristics. Cross-sensor NDVI translation equations were developed for surface conditions. The effect of a range of atmospheric conditions (Rayleigh scattering, ozone, aerosol optical thickness, and water vapor content) on the sensor-specific reflectance and NDVI values were evaluated to quantify the uncertainty in the apparent NDVI for each sensor. MODIS and VIIRS NDVI data are minimally affected by the atmospheric water vapor, while AVHRR NDVI data are substantially reduced by water vapor. Although multi-sensor NDVI continuity can be obtained by using the developed cross-sensor translation equations, the interactions between the spectral characteristics of surface vegetation and soil components, sensor-specific spectral band characteristics and atmospheric scattering and absorption windows will introduce uncertainty due to insufficient knowledge about the atmospheric conditions that affect the signal of the Earth's pixels at the time of data acquisitions. Processing strategies and algorithm preferences among data streams are also hindering cross-sensor NDVI continuity.
Mapping paddy rice agriculture in South and Southeast Asia using multi-temporal MODIS images
[J].
DOI:10.1016/j.rse.2005.10.004
URL
[本文引用: 1]
In this paper, we developed a new geospatial database of paddy rice agriculture for 13 countries in South and Southeast Asia. These countries have 30% of the world population and 2/3 of the total rice land area in the world. We used 8-day composite images (500-m spatial resolution) in 2002 from the Moderate Resolution Imaging Spectroradiometer (MODIS) sensor onboard the NASA EOS Terra satellite. Paddy rice fields are characterized by an initial period of flooding and transplanting, during which period a mixture of surface water and rice seedlings exists. We applied a paddy rice mapping algorithm that uses a time series of MODIS-derived vegetation indices to identify the initial period of flooding and transplanting in paddy rice fields, based on the increased surface moisture. The resultant MODIS-derived paddy rice map was compared to national agricultural statistical data at national and subnational levels. Area estimates of paddy rice were highly correlated at the national level and positively correlated at the subnational levels, although the agreement at the national level was much stronger. Discrepancies in rice area between the MODIS-derived and statistical datasets in some countries can be largely attributed to: (1) the statistical dataset is a sown area estimate (includes multiple cropping practices); (2) failure of the 500-m resolution MODIS-based algorithm in identifying small patches of paddy rice fields, primarily in areas where topography restricts field sizes; and (3) contamination by cloud. While further testing is needed, these results demonstrate the potential of the MODIS-based algorithm to generate updated datasets of paddy rice agriculture on a timely basis. The resultant geospatial database on the area and spatial distribution of paddy rice is useful for irrigation, food security, and trace gas emission estimates in those countries.
Classifying multiyear agricultural land use data from Mato Grosso using time-series MODIS vegetation index data
[J].
DOI:10.1016/j.rse.2012.11.009
URL
[本文引用: 1]
MODIS 250-m NDVI and EVI datasets are now regularly used to classify regional-scale agricultural land-use practices in many different regions of the globe, especially in the state of Mato Grosso, Brazil, where rapid land-use change due to agricultural development has attracted considerable interest from researchers and policy makers. Variation exists in which MODIS datasets are used, how they are processed for analysis, and what ground reference data are used. Moreover, various land-use/land-cover classes are ultimately resolved, and as yet, crop-specific classifications (e.g. soy-corn vs. soy-cotton double crop) have not been reported in the literature, favoring instead generalized classes such as single vs. double crop. The objective of this study is to present a rigorous multiyear evaluation of the applicability of time-series MODIS 250-m VI data for crop classification in Mato Grosso, Brazil. This study shows progress toward more refined crop-specific classification, but some grouping of crop classes remains necessary. It employs a farm field polygon-based ground reference dataset that is unprecedented in spatial and temporal coverage for the state, consisting of 2003 annual field site samples representing 415 unique field sites and five crop years (2005-2009). This allows for creation of a dataset containing "best-case" or "pure" pixels, which we used to test class separability in a multiyear cross validation framework applied to boosted decision tree classifiers trained on MODIS data subjected to different pre-processing treatments. Reflecting the agricultural landscape of Mato Grosso as a whole, cropping practices represented in the ground reference dataset largely involved soybeans, and soy-based classes (primarily double crop 'soy-commercial' and single crop 'soy-cover') dominated the analysis along with cotton and pasture. With respect to the MODIS data treatments, the best results were obtained using date-of-acquisition interpolation of the 16-day composite VI time series and outlier point screening, for which five-year out-of-sample accuracies were consistently near or above 80% and Kappa values were above 0.60. It is evident that while much additional research is required to fully and reliably differentiate more specific crop classes, particular groupings of cropping strategies are separable and useful for a number of applications, including studies of agricultural intensification and extensification in this region of the world. (C) 2012 Elsevier Inc. All rights reserved.
Estimating crop water deficit using the relation between surface-air temperature and spectral vegetation index
[J].
DOI:10.1016/0034-4257(94)90020-5
URL
[本文引用: 1]
; ; ; ; USDA, water conservation lab., Phoenix, ETATS-UNISCEMAGREF-ENGREF, remote sensing lab., Montpellier, FRANCE02 0202 02 0202RSEEA702 CongrèsRemote sensing of soils and vegetation. Symposium, Tempe AZ , ETATS-UNIS (1993) 1994,02vol.0249,02n02302(1 p.1/2),02pp.02246-263AnglaisElsevier, New York, NY, ETATS-UNIS02 (1969) (Revue); ; ; ; ; ; ; ; ; ; ; ; ; ; ; ; ; ; ; ; ; ; ; ; ; ; ; ; ; ; ; ; ; ; ; ; ; ; ; ; ; ; ; ; ; ; ; ; ; ; ; INIST-CNRS, Cote INIST : 14287,0235400004199403.0090
农业遥感研究与应用进展
[J].
DOI:10.6041/j.issn.1000-1298.2014.12.041
URL
[本文引用: 1]
农业是遥感技术应用最重要和广泛的领域之一,本文回顾了遥感技术在国内外农业研究与应用中的进展,概括和总结了农田辐射传输机理及作物参量遥感反演、作物遥感分类与识别、农田养分遥感与变量施肥决策、作物产量与品质预测、农情遥感监测与预报、农业遥感监测空间决策支持系统6个主要研究与应用方面。在此基础上,针对农业遥感技术面临的问题与发展趋势,指出了农业遥感技术今后的重点发展方向。
Advances of research and application in remote sensing for agriculture
[J].
Integrated narrow-band vegetation indices for prediction of crop chlorophyll content for application to precision agriculture
[J].
DOI:10.1016/S0034-4257(02)00018-4
URL
[本文引用: 1]
Recent studies have demonstrated the usefulness of optical indices from hyperspectral remote sensing in the assessment of vegetation biophysical variables both in forestry and agriculture. Those indices are, however, the combined response to variations of several vegetation and environmental properties, such as Leaf Area Index (LAI), leaf chlorophyll content, canopy shadows, and background soil reflectance. Of particular significance to precision agriculture is chlorophyll content, an indicator of photosynthesis activity, which is related to the nitrogen concentration in green vegetation and serves as a measure of the crop response to nitrogen application. This paper presents a combined modeling and indices-based approach to predicting the crop chlorophyll content from remote sensing data while minimizing LAI (vegetation parameter) influence and underlying soil (background) effects. This combined method has been developed first using simulated data and followed by evaluation in terms of quantitative predictive capability using real hyperspectral airborne data. Simulations consisted of leaf and canopy reflectance modeling with PROSPECT and SAILH radiative transfer models. In this modeling study, we developed an index that integrates advantages of indices minimizing soil background effects and indices that are sensitive to chlorophyll concentration. Simulated data have shown that the proposed index Transformed Chlorophyll Absorption in Reflectance Index/Optimized Soil-Adjusted Vegetation Index (TCARI/OSAVI) is both very sensitive to chlorophyll content variations and very resistant to the variations of LAI and solar zenith angle. It was therefore possible to generate a predictive equation to estimate leaf chlorophyll content from the combined optical index derived from above-canopy reflectance. This relationship was evaluated by application to hyperspectral CASI imagery collected over corn crops in three experimental farms from Ontario and Quebec, Canada. The results presented here are from the L'Acadie, Quebec, Agriculture and Agri-Food Canada research site. Images of predicted leaf chlorophyll content were generated. Evaluation showed chlorophyll variability over crop plots with various levels of nitrogen, and revealed an excellent agreement with ground truth, with a correlation of r 2=.81 between estimated and field measured chlorophyll content data.
Predicting winter wheat condition,grain yield and protein content using multi-temporal EnviSat-ASAR and Landsat TM satellite images
[J].
DOI:10.1080/01431160500296867
URL
[本文引用: 1]
Since optical and microwave sensors respond to very different target characteristics, their role in crop monitoring can be viewed as complementary. In particular, the all‐weather capability of Synthetic Aperture Radar (SAR) sensors can ensure that data gaps that often exist during monitoring with optical sensors are filled. There were three Landsat Thematic Mapper (TM) satellite images and three Envisat Advanced Synthetic Aperture Radar (ASAR) satellite images acquired from reviving stage to milking stage of winter wheat. These data were successfully used to monitor crop condition and forecast grain yield and protein content. Results from this study indicated that both multi‐temporal Envisat ASAR and Landsat TM imagery could provide accurate information about crop conditions. First, bivariate correlation results based on the linear regression of crop variables against backscatter suggested that the sensitivity of ASAR C‐HH backscatter image to crop or soil condition variation depends on growth stage and time of image acquisition. At the reviving stage, crop variables, such as biomass, Leaf Area Index (LAI) and plant water content (PWC), were significantly positively correlated with C‐HH backscatter (r02=020.65, 0.67 and 0.70, respectively), and soil water content at 502cm, 1002cm and 2002cm depths were correlated significantly with C‐VV backscatter (r02=020.44, 0.49 and 0.46, respectively). At booting stage, only a significant and negative correlation was observed between biomass and C‐HH backscatter (r02=02610.44), and a saturation of the SAR signal to canopy LAI could explain the poor correlation between crop variables and C‐HH backscatter. Furthermore, C‐HH backscatter was correlated significantly with soil water content at booting and milking stage. Compared with ASAR backscatter data, the multi‐spectral Landsat TM images were more sensitive to crop variables. Secondly, a significant and negative correlation between grain yield and ASAR C‐HH & C‐VV backscatter at winter wheat booting stage was observed (r02=02610.73 and 610.55, respectively) and a yield prediction model with a correlation coefficient of 0.91 was built based on the Normalized Difference Water Index (NDWI) data from Landsat TM on 17 April and ASAR C‐HH backscatter on 27 April. Finally, grain protein content was found to be correlated significantly with ASAR C‐HH backscatter at milking stage (r02=02610.61) and with Structure Insensitive Pigment Index (SIPI) data from Landsat TM at grain‐filling stage (r02=020.53), and a grain protein content prediction model with a correlation coefficient of 0.75 was built based on the C‐HH backscatter and SIPI data.
Efficient corn and soybean mapping with temporal extendability:A multi-year experiment using Landsat imagery
[J].
DOI:10.1016/j.rse.2013.08.023
URL
[本文引用: 1]
The classification method was tested in mapping corn and soybean, which are two dominant summer crop types in the central United States, and the experiment was carried out for Doniphan County, Kansas during years 2006鈥2010. Over 100 Landsat TM and ETM + images in this period were utilized and phenological metrics were calculated from Enhanced Vegetation Index time series using techniques including image segmentation and curve-fitting. Several sets of input variables, ranging from multi-spectral features of selected dates, which are widely used in traditional mapping efforts, to phenological metrics and derived measurements such as accumulated temperature, were tested using a random forest classifier. When the classifier was trained by reference data collected in the same year as that of remotely sensed data, most sets of input variables yielded accuracies higher than 88%. However, when the training data used by the classifier were obtained in a year different from the mapping years, only input sets containing phenological metrics were able to achieve acceptable accuracies greater than 80%. The use of phenological metrics as classification inputs avoids the restrictive requirements of a large ground reference dataset, enabling frequent and routine crop mapping without repeated collection of reference data.
