

0 引言
本文以山西省潞城市为研究区,基于RS与GIS技术,利用1995—2015年间5期遥感影像数据对研究区20 a间的土地利用动态变化情况进行分析研究,并采用灰度预测法GM(1,1)模型对2020年的土地利用情况进行预测,进而为该区的可持续发展提供依据。
1 研究区概况及数据源
潞城市位于山西省的东南部,太行山西麓,地理坐标在E112°59'36″~113°25'40″,N36°14'00″~36°29'30″之间。作为国家园林城市、国家卫生城市及山西省造林绿化先进市,研究区历史悠久、自然资源丰富。
本文所用的数据为山西省潞城市1995年、2000年、2005年和2010年4期TM影像、2015年OLI影像、行政区划图以及其他文字资料。
2 数据预处理
利用行政边界矢量数据对遥感影像进行裁剪,提取出研究区范围。根据土地分类系统原则与潞城市的区域特点将研究区内的土地利用类型分为5类: 林地、耕地、居民地、水域及未利用地。采用决策树分类算法(classification and regression tree,CART)进行分类,提取土地利用信息,并对已分类的图像进行后处理得到最终的结果。
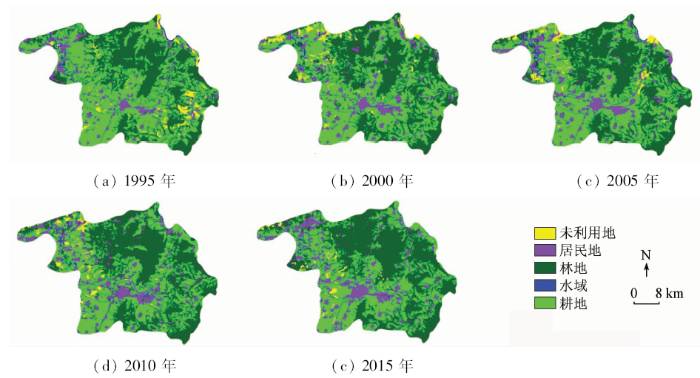
CART算法是把数据集中最小的Gini值作为节点将数据集分为2个子数据集,最后根据验证数据进行剪枝。Gini指数[15]是判断收入分配公平程度的指标,也被用来度量任何不均匀分布,其范围在[0,1]之间,值越小说明数据对象为同一类的概率越高。所以,基于CART获取规则的决策树是结构简单的二叉树。CART算法不适用于有多个离散特征的情况,因此若要使用此方法,最好先将离散特征取值缩减。基于CART获取规则的决策树分类法的步骤为: ①构建多源数据集,包括: Landsat5 TM和Landsat8 OLI影像的多光谱波段、归一化差值植被指数(normalized difference vegetation index,NDVI)和迭代自组织数据分析技术(iterative self-organizing data analysis technique,ISODATA)非监督分类结果; ②获取规则,通过选择训练样本获取规则; ③土地覆盖信息提取,在Decision Tree中选择决策树txt文件,提取出土地覆盖信息。最终分类结果如图1所示。对结果进行精度评定,评价结果如表1所示。从图1和表1中可以看出,分类结果可以满足本文对数据质量的精度要求。
表1 分类结果精度
Tab.1
| 精度评价指标 | 1995年 | 2000年 | 2005年 | 2010年 | 2015年 |
|---|---|---|---|---|---|
| 分类精度/% | 93.00 | 94.00 | 95.00 | 92.00 | 97.00 |
| Kappa系数 | 0.88 | 0.90 | 0.92 | 0.87 | 0.95 |
图1
3 土地利用动态变化分析
研究区总面积为61 235.77 hm2,其在1995年、2000年、2005年、2010年和2015年5个时期各类土地利用类型面积的大小及其对于研究区总面积的占比情况如表2所示。
表2 潞城市各类土地利用类型面积及占比
Tab.2
| 年份 | 林地 | 耕地 | 居民地 | 水域 | 未利用地 | |||||
|---|---|---|---|---|---|---|---|---|---|---|
| 面积/hm2 | 比例/% | 面积/hm2 | 比例/% | 面积/hm2 | 比例/% | 面积/hm2 | 比例/% | 面积/hm2 | 比例/% | |
| 1995年 | 23 301.90 | 38.05 | 29 464.50 | 48.12 | 5 629.86 | 9.19 | 446.95 | 0.73 | 2 392.56 | 3.91 |
| 2000年 | 24 295.00 | 39.68 | 27 790.70 | 45.38 | 6 632.28 | 10.83 | 445.41 | 0.73 | 2 072.38 | 3.38 |
| 2005年 | 25 610.20 | 41.82 | 26 294.70 | 42.94 | 7 116.24 | 11.62 | 449.73 | 0.74 | 1 764.90 | 2.88 |
| 2010年 | 26 736.70 | 43.66 | 24 948.20 | 40.74 | 7 626.96 | 12.46 | 454.66 | 0.74 | 1 469.25 | 2.40 |
| 2015年 | 27 471.00 | 44.86 | 24 046.30 | 39.27 | 8 256.78 | 13.48 | 420.93 | 0.69 | 1 040.76 | 1.70 |
由表2可知,林地和耕地是研究区主要土地利用类型,约占研究区总面积的85%。耕地占地面积最大,主要分布在西部与南部; 其次是林地,主要在研究区东南部和北部地区; 居民地主要集中在中南部与西北部。在1995—2015年的20 a间,耕地面积变化最大,约减少了10%; 水域面积基本保持不变; 林地面积有少量持续增加; 未利用地面积逐期减少; 居民地面积不断增加。
3.1 土地利用变化量
3.1.1 土地利用变化幅度
土地利用变化幅度为土地利用类别面积的变化[9],即
S=
式中: S为研究区某一土地利用类型的土地利用变化幅度,正值表示增加的幅度,负值表示减少的幅度; Ui和Uj分别表示研究初期和研究末期的某一土地利用类型面积。
把研究区1995—2015年间土地利用类别的面积导入式(1)中进行计算,可以得到研究区1995—2015年每5 a间的土地利用类型的变化幅度,其结果见表3。
表3 潞城市1995年、2000年、2005年、2010年和2015年土地利用变化幅度
Tab.3
| 土地利用类型 | 1995—2000年 | 2000—2005年 | 2005—2010年 | 2010—2015年 | ||||
|---|---|---|---|---|---|---|---|---|
| 变化面积/hm2 | 变化幅度/% | 变化面积/hm2 | 变化幅度/% | 变化面积/hm2 | 变化幅度/% | 变化面积/hm2 | 变化幅度/% | |
| 林地 | 993.10 | 4.26 | 1 315.20 | 5.41 | 1 126.50 | 4.40 | 734.30 | 2.75 |
| 耕地 | -1 673.80 | -5.68 | -1 496.00 | -5.38 | -1 346.50 | -5.12 | -901.90 | -3.62 |
| 居民地 | 1 002.42 | 17.81 | 483.96 | 7.30 | 510.72 | 7.18 | 629.82 | 8.26 |
| 水域 | -1.54 | -0.34 | 4.32 | 0.97 | 4.93 | 1.10 | -33.73 | -7.42 |
| 未利用地 | -320.18 | -13.38 | -307.48 | -14.84 | -295.65 | -16.75 | -428.49 | -29.16 |
由表3可知,在1995—2000年5 a间,研究区土地利用类型中面积呈正增长的为林地和居民地2类,其中面积增加最多同时变化幅度最大的是居民地,增加面积为1 002.42 hm2,增加幅度为17.81%; 土地利用类型中面积呈负增长的有耕地、水域和未利用地3类,耕地面积减少最多,为1 673.80 hm2,水域面积虽有所减少但是幅度很小可忽略不计,而未利用地减少幅度最大,为13.38%。在2000—2005年5 a间,研究区土地利用类型中面积呈正增长的有林地、居民地和水域3类,其中面积增加最多的是林地,为1 315.20 hm2,增加幅度最大的是居民地,为7.30%,水域面积虽有小幅度增加但可忽略不计; 土地利用类型中面积呈负增长的有耕地和未利用地2类,耕地面积减少最多,为1 496.00 hm2,未利用地减少幅度最大,为14.84%。在2005—2010年5 a间,研究区土地利用类型中面积呈正增长的有林地、居民地和水域3类,面积增加最多的是林地,为1 126.50 hm2,增加幅度最大的是居民地,为7.18%,水域面积虽有小幅度增加但可忽略不计; 土地利用类型中面积呈负增长的有耕地和未利用地2类,面积减少最多的是耕地,为1 346.50 hm2,减少幅度最大的是未利用地,为16.75%。在2010—2015年5 a间,研究区土地利用类型中面积呈正增长的有林地和居民地2类,其中面积增加最多的是林地,为734.30 hm2,增加幅度最大的是居民地,为8.26%; 土地利用类型中面积呈负增长的有耕地、水域和未利用地3类,其中面积减少最多的是耕地,为901.90 hm2,减少幅度最大的是未利用地,为29.16%。
3.1.2 单一土地利用动态度
单一土地利用动态度为研究区某一土地利用类型的年均变化情况[9],即
K=S/T , (2)
式中: K为研究区某一土地利用类型的单一土地利用动态度; T为研究初期与末期的间隔年数。
将研究区5个年份的土地利用变化幅度导入式(2)中进行计算,得到研究期间潞城市的单一土地利用动态度,其结果见表4。
表4 潞城市1995年、2000年、2005年、2010年和2015年单一土地利用动态度
Tab.4
| 土地利用类型 | 1995—2000年 | 2000—2005年 | 2005—2010年 | 2010—2015年 | 1995—2005年 | 2000—2010年 | 2005—2015年 | 1995—2015年 |
|---|---|---|---|---|---|---|---|---|
| 林地 | 0.85 | 1.08 | 0.88 | 0.54 | 0.99 | 1.01 | 0.73 | 0.89 |
| 耕地 | -1.14 | -1.08 | -1.02 | -0.72 | -1.08 | -1.02 | -0.86 | -0.92 |
| 居民地 | 3.56 | 1.46 | 1.44 | 1.66 | 2.64 | 1.50 | 1.60 | 2.33 |
| 水域 | -0.07 | 0.19 | 0.22 | -1.48 | 0.06 | 0.21 | -0.64 | -0.29 |
| 未利用地 | -2.68 | -2.97 | -3.35 | -5.84 | -2.62 | -2.91 | -4.03 | -2.83 |
根据表4对潞城市1995年、2000年、2005年、2010年和2015年的土地利用动态变化情况进行详细分析。近20 a间,潞城市林地面积有所增加,且其单一土地利用动态度始终为正,截止到2015年研究区林地面积呈增加状态,且年均增长0.89%; 耕地面积有所减少,其单一土地利用动态度始终为负,截止到2015年研究区耕地面积呈减少状态,且年均减少0.92%; 居民地面积有所增加,其单一土地利用动态度始终为正,截止到2015年研究区居民地面积呈增加状态,年均增长2.33%; 水域面积有所减少,其单一土地利用动态度有正有负,截止到2015年研究区水域面积呈减少状态,年均减少0.29%; 未利用地面积有所减少,其单一土地利用动态度始终为负,截止到2015年研究区未利用地面积呈减少状态,年均减少2.83%。
3.2 土地利用变化程度
土地的属性是人与自然的总体反应效果,体现了人类对土地利用的特点。本文结合土地利用现状分类标准(GBT21010—1007)与研究区土地利用的特点以及人类对土地的开发利用程度将该研究区土地利用类型分为4个等级,见表5。
表5 土地利用类型分级指数
Tab.5
| 分级 | 城镇聚落 用地级 | 农业用 地级 | 林草水 用地级 | 未利用 地级 |
|---|---|---|---|---|
| 土地利用类型 | 居民地 | 耕地 | 林地、水域 | 未利用地 |
| 分级指数 | 4 | 3 | 2 | 1 |
土地利用程度变化综合指数为研究区内土地利用的程度[16],即
L=100
式中: L为研究区内土地利用程度变化的综合指数; Ai为第i类土地利用类别的分级指数; Ci为第i类土地利用类别的面积占比; n为土地利用类别总数。
把研究区5个年份的土地利用类别的面积占比与相应的分级指数带入式(3)中进行计算,得到研究期间研究区土地利用程度变化综合指数,其结果见表6。
表6 潞城市土地利用程度变化综合指数
Tab.6
| 年份 | 1995年 | 2000年 | 2005年 | 2010年 | 2015年 |
|---|---|---|---|---|---|
| 综合指数 | 262.59 | 263.66 | 263.30 | 263.26 | 264.53 |
由表6可知,研究区土地利用程度在1995—2015年间无显著变化。从土地利用程度变化综合指数的范围(100~400)来看,潞城市的开发程度已达到中等程度,土地利用还有很大的发展空间,政府可以在可持续利用的前提下开发土地资源发展经济,提高居民的生活质量。
3.3 土地利用变化结构
通过研究区各土地利用类型的面积占比可以得到研究区土地利用结构情况,其结果如图2所示。
图2
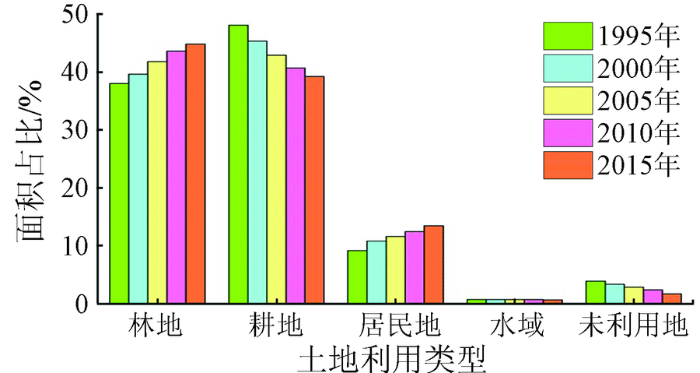
从类别角度分析数据,研究区面积占比最大的2类土地利用类型是林地与耕地,这2类在各时期所占研究区总面积均在80%以上; 其次,居民地在各时期所占研究区总面积介于9%~14%之间; 而其他各类在各时期所占研究区总面积都不足5%。
从时间角度分析数据,①林地的变化在1995—2015年间面积占比逐渐增大,尤其在2000—2005年间的变化幅度最大,为2.14%,2010—2015年间的变化幅度最小,为1.20%; ②耕地的变化在1995—2015年间面积占比逐渐减少,在1995—2000年间的变化幅度最大,为2.74%,2010—2015年间的变化幅度最小,为1.47%; ③居民地的变化在1995—2015年间面积占比逐渐增大,在1995—2000年间的变化幅度最大,为1.64%,2000—2005年间的变化幅度最小,为0.79%; ④水域的变化在1995—2015年面积占比有增有减,最终呈减少趋势,在2010—2015年间的变化幅度最大,为0.05%,在1995—2000年与2005—2010年间无变化,变化幅度为0; ⑤未利用地的变化在1995—2015年间面积占比逐渐减少,在2010—2015年间的变化幅度最大,为0.70%,在2005—2010年间的变化幅度最小,为0.48%。
4 土地利用预测
科学有效地对土地利用进行预测能够为研究区的可持续发展提供相应的技术支持[17]。灰色预测法是一种对含有不确定因素的系统进行预测的方法。首先,通过关联分析来鉴别系统各因素之间的发展趋势的相异程度; 然后,生成处理原始数据寻找出系统的变化规律,即生成一组具有较强规律性的数据序列; 最后,通过建立相应的微分方程模型预测出事物未来的发展状况。
本文利用GM(1,1)模型,首先利用1995年、2000年、2005年和2010年4期的遥感数据对研究区2015年的居民地面积进行预测并与实际数据进行对比,再利用1995年、2000年、2005年、2010年和2015年5期的数据对研究区2020年的耕地与居民地进行预测。
GM(1,1)模型中建立的微分方程为
X(t+1)=
式中: X(t+1)表示预测年份的相应预测结果; a为发展系数,表示行为序列估计值的发展态势; b为灰色作用量,是从行为序列中挖掘出来的数据,反映了数据变化的关系。此模型使用均方差比值C与小误差概率P作为检验模型预测精度的标准。具体指标如表7所示。
表7 精度预测等级
Tab.7
| 精度评价指标 | 好 | 良 | 合格 | 不合格 |
|---|---|---|---|---|
| C | < 0.35 | < 0.50 | < 0.65 | ≥ 0.65 |
| P | > 0.95 | > 0.80 | > 0.70 | ≤ 0.70 |
4.1 2015年土地利用预测
将研究区1995年、2000年、2005年和2010年4期的居民地面积带入GM(1,1)模型中,得到
X(t+1)=91 700.248 281
式中: 参数a=-0.069 816; b=6 009.080 448。
根据GM(1,1)模型得到的式(5)对2000年、2005年和2010年居民地拟合结果如表8所示。
表8 2000年、2005年和2010年居民地拟合结果
Tab.8
| 年份 | 观察值 | 拟合值 | 绝对误差 | 相对误差/% |
|---|---|---|---|---|
| 2000年 | 6 632.280 0 | 6 630.912 4 | 1.367 6 | 0.020 6 |
| 2005年 | 7 116.240 0 | 7 110.398 6 | 5.841 4 | 0.082 1 |
| 2010年 | 7 626.960 0 | 7 624.556 8 | 2.403 2 | 0.031 5 |
评价结果: C=0.002 8,P=1.000 0,表明当前模型的评价效果很好。计算得到2015年预测值为8 175.894 08 hm2,而实际面积为8 256.78 hm2,相差80.885 92 hm2,仅占总面积的0.013 2%,误差很小,满足精度要求。
4.2 2020年土地利用预测
4.2.1 耕地预测
将研究区5期的耕地面积数值带入GM(1,1)模型中,得到
X(t+1)=-578 846.731 18e-0.049017t+608 311.231 118 , (6)
式中: 参数a=0.049 017; b=29 817.656 301。
利用式(6)对2000年、2005年、2010年和2015年耕地拟合结果如表9所示。
表9 2000年、2005年和2010年和2015年耕地拟合结果
Tab.9
| 年份 | 观察值 | 拟合值 | 绝对误差 | 相对误差/% |
|---|---|---|---|---|
| 2000年 | 27 790.700 0 | 27 689.225 1 | 101.474 9 | 0.365 1 |
| 2005年 | 26 294.700 0 | 26 364.706 7 | -70.006 7 | -0.266 2 |
| 2010年 | 24 948.200 0 | 25 103.546 7 | -155.346 7 | -0.622 7 |
| 2015年 | 24 046.300 0 | 23 902.714 6 | 143.585 4 | 0.597 1 |
评价结果: C=0.062 9,P=1.000 0,表明当前模型的评价效果较好。2020年耕地面积的预测值为22 759.324 45 hm2,耕地持续减少的趋势保持不变。由于城市有更多的就业机会、更好的教育资源和居住环境,这些因素使得大量的农村劳动力涌入城市,而缺乏劳动力的农村使得部分耕地退化为荒地,面积减少。
4.2.2 居民地预测
将研究区域5期的居民地面积数值带入GM(1,1)模型中,得到
X(t+1)=87 488.284 157e0.072892t-81 858.424 157 , (7)
式中: 参数a=-0.072 892 ,b=5 966.783 952。
利用式(7)对2000年、2005年、2010年和2015年居民地拟合结果如表10所示。
表10 2000年、2005年和2010年和2015年居民地拟合结果
Tab.10
| 年份 | 观察值 | 拟合值 | 绝对误差 | 相对误差/% |
|---|---|---|---|---|
| 2000年 | 6 632.280 0 | 6 615.324 7 | 16.955 3 | 0.255 6 |
| 2005年 | 7 116.240 0 | 7 115.534 7 | 0.705 3 | 0.009 9 |
| 2010年 | 7 626.960 0 | 7 653.567 6 | -26.607 6 | -0.348 9 |
| 2015年 | 8 256.780 0 | 8 232.283 2 | 24.496 8 | 0.296 7 |
评价结果: C=0.022 0,P=1.000 0,表明当前模型的评价效果很好。2020年居民地面积的预测值为8 854.757 69 hm2,居民地持续增加的趋势保持不变。城镇化的加速发展使得更多的农村人口涌入城市,城市常住人口的增加使得城市不断扩张,居民地面积增加。
5 结论
1)1995—2015年间,研究区林地和居民地所占用地逐渐增加,耕地和未利用地所占用地逐渐减少,水域所占用地基本保持不变。
2)1995年、2000年、2005年、2010年和2015年该区土地利用程度变化综合指数分别为262.59,263.66,263.30,263.26和264.53。从土地利用程度变化综合指数的范围来看,研究区开发程度已达到中等水平,近20 a间研究区处于发展时期。
3)在土地利用结构方面,从类别角度看,林地与耕地是研究区2大土地利用类型; 从时间角度看,截止到2015年研究区面积增加的有林地和居民地; 面积减少的有耕地、水域和未利用地。
4)应用GM(1,1)模型,采用1995年、2000年、2005年和2010年4期数据预测2015年居民地面积为8 175.89 hm2,实际面积为8 256.78 hm2,相差80.89 hm2; 应用该模型,采用1995年、2000年、2005年、2010年和2015年5期数据预测2020年耕地面积为22 759.32 hm2,居民地面积为8 854.76 hm2。
参考文献
县域土地利用动态变化研究——以山西省怀仁县为例
[D].
Study on Dynamic Change of County-Level Land Use:A Case Study of Huairen Country in Shanxi Province
[D].
A method for monitoring building construction in urban sprawl areas using object-based analysis of SPOT5 images and existing GIS data
[J].
DOI:10.1016/j.isprsjprs.2008.01.005
URL
[本文引用: 1]

Urban sprawl has been identified as one of the most negative effects of global population growth on the environment and biodiversity. Frequent monitoring of urban sprawl is needed to limit the impact of this ongoing phenomenon. This paper proposes precise monitoring of building construction using an object-based classification methodology applied to Spot 5 images with a 2.5 m resolution. An application at a regional scale on Reunion Island in the Indian Ocean shows that this building extraction methodology has limitations in the production of reference urban maps because of difficulties in defining the shape and the number of buildings compared to classical photo-interpretation of aerial photography. However, these results are of great value for planning in urban sprawl areas where up-to-date information is lacking because of the rapid pace of house construction and residential development.
A GIS technology and method to assess environmental problems from land use/cover changes: Conakry,Coyah and Dubreka region case study
[J].
DOI:10.1016/j.ejrs.2011.12.002
URL
[本文引用: 1]
This study is the result of investigating the land use/cover surrounding Conakry city and its two neighboring cities from the past to the present periods which are herein after referred to as this egion and the impact of numerous changes during that time. These changes have become a major concern for the Guinean government and scientific community. Using map interpretation with integration of remote sensing, GIS technology and a GIS method we investigated the land use/cover and a population dynamism model with the aims of promoting a sustainable recovery and future judicious utilization. We found out that these three cities are on the verge of being unified, as a result of the expansion of urban residential areas and the changing economic realities causing significant influences on this land use/cover change. The pattern of land cover 59years ago presented a landscape relatively pristine, while that in the present period presents a landscape that is markedly in a degrading decline. During the past 59years, land use/cover has been influenced by key factors that revolve around socio-economic development, climatic patterns, topography manipulation, and policy implementation influences. The level of degradation of the land use/cover has increased and will oblige the political, scientific and local communities to take note of the environmental changes and set up urgent, rigorous and coherent policies for the rational development and management of the land use/cover resources of this region. That can be part of a model for other countries to reclaim the past sustainable environment.
Using GIS and multi-criteria decision analysis for conflict resolution in land use planning
[J].
DOI:10.1016/j.proenv.2012.01.215
URL
[本文引用: 1]
Based on the principles of sustainable development, land use planning often requires the compromise between economic development and environmental conservation while advocating social justice. Given that ideas, values, and attitudes vary among the stakeholders involved, land use planning inevitably incurs a variety of conflicts. The conflicts in land use planning can be described from the perspective of the conflicts among land use types and the conflicts among stakeholders. Accordingly, land use planning can be conceived as the process of dealing with conflicts among different land use types through resolving the conflicts among stakeholders. This study centers around two important issues in land use planning: land use allocation and specific land use proposal deliberation. A Conflict Resolution Framework was proposed based on GIS and Multi-criteria Decision Analysis techniques. A Consensus Building Model was established to address the conflicts among different stakeholders with competing interests in the process of land use allocation. A Spatial Conflict Resolution Strategy was developed to help stakeholders and planners formulate specific land use proposals through an iterative modification process. The both models were tested and evaluated in the context of Lantau, Island Hong Kong. Moreover, the challenges of this research and future work are also covered in this paper.
GIS and multi-criteria decision analysis for land use resource planning
[J].
DOI:10.4236/jgis.2012.44039
URL
[本文引用: 1]
Natural resources management is indispensable in ensuring environmental sustainability and reducing the risk associated with climate change and increasing demand for ecological goods and services. Natural resources planners need to have at their disposal tools that can objectively help in prioritizing land use allocation. Traditional application of land use change model based on economic model, trend analysis, and or scenario analysis present some challenges of data availability and reliability necessary for implementation of the models. However, with the advent of information technology, GIS and remote sensing, biophysical data known for having influence on land use allocation can easily be accessed. The current study explores the application of GIS-Multi-criteria analysis in modeling future land use scenarios for resources planning and management using easy to construct biophysical parameters known for influencing future land use allocation. The decision problems in this study are to find the best spatial allocation of land to future agriculture and forest development, which are considered to present critical land use change in the study area. The afforestation scenarios are meant to offset the pressure on the native forest resources due to the increased demand for fuel and timber and also to contribute to the environmental protection and the agricultural land use scenarios are meant to increase productivity and ensure environmental protection. The land use scenarios did not consider hen in the future the land use pattern may develop. The analyses of scenarios indicate that afforestation extent in the basin can be increased from 4.6% to 42.9% of the total basin area. However, the afforestation extent of 42.9% may be considered unrealistic, since in practice, it may not be possible to realize up to 42.9% afforestation, nevertheless, the spatial pattern of the afforestation may provide crucial insight into spatial afforestation policies and it future consequences. The agricultural land use can increase from 6.2% to 53.7% of the basin area. The agricultural land use expansion can be realised since the expansion of farm land is primarily the main option to achieve food production increase in the near future. The findings indicate potential use of the methodology in land use planning.
土地利用规划在城市郊区历史遗迹保护中的应用——以无锡市新区为例
[J].
Application of land use planning in historic sites protection in urban fringe: Example the studies of the new district of Wuxi
[J].
土地利用回归模型在大气污染时空分异研究中的应用
[J].
DOI:10.13227/j.hjkx.2016.02.002
URL
[本文引用: 1]
随着城市化、工业化、机动化进程的加快,大气污染已成为我国最严重的环境问题之一,对公众健康和生态环境造成了诸多负面影响.土地利用回归,即Land-use Regression(LUR)模型是目前模拟城市尺度大气污染时空分异的常用方法之一,其在欧洲和北美得到广泛的应用,而在国内,相关研究却不多.本文在整理国内外文献的基础上,从构建LUR模型的主要步骤入手,包括监测数据获取、模型自变量生成、模型构建、模型检验和回归映射等方面,对LUR模型在大气污染时空分异研究中的进展进行归纳总结,进而展望了未来的研究重点与方向,即突出时空分异、扩展模型变量类别和改进模型构建方法.本文旨在普及LUR模型在我国的应用,为人口暴露、流行病学研究和健康风险评价等提供方法论基础.
Application of land-use regression models in spatial-temporal differentiation of air pollution
[J].
基于土地利用和人为热修正的城市夏季高温数值试验
[J].
DOI:10.16032/j.issn.1004-4965.2015.03.008
URL
[本文引用: 1]
为了评估土地利用变化和人为热对区域气象环境产生的影响,同时针对WRF模式对城市土地利用和人为热刻画不够准确的现状,以上海为例,选用GLC2009对WRF中上海地区原有数据进行修正。通过楼层信息将上海市分为三类(商业区、高强度区、低强度区),同时重新估算了人为热通量和人为热释放日变化系数。利用WRF/UCM对2010年8月11-17日的一次高温过程进行了模拟试验。与观测资料的对比表明:新的土地利用数据较真实地反映了上海地区下垫面的变化,尤其是大规模建设导致的城市功能区变化;使用新的土地利用和人为热数据,温度和比湿模拟的平均偏差分别改善了1.95℃和0.713g/kg;高温范围和比湿对土地利用的改变最敏感,高温强度对人为热最敏感。
A numerical simulation experiment of an urban summer heat wave based on modified data of land-use and anthropogenic heat
[J].
基于J48决策树算法的遥感土地利用变化分析
[J].
DOI:10.3969/j.issn.1000-3177.2014.01.016
URL
[本文引用: 3]
在遥感和GIS技术的支持下,运用WEKA的J48决策树算法和监督分类的最大似然法对肥东县3期ETM+影像进行分类,提取土地利用信息,构建了土地利用类型转换矩阵,从主地利用类型的数量、结构和程度3个方面对肥东县土地利用变化进行分析.研究表明,前一种分类方法的精度较高;肥东县2000年~2011年建设用地面积呈上升趋势且变化最大,耕地、林地、草地、水域、未利用地均呈减少趋势,土地利用变化速度和综合程度越来越快.
Land use change of remote sensing based on J48 decision tree algorithm
[J].
辅以纹理特征的面向对象遥感影像土地分类研究——以南通市港闸区为例
[D].
Research on Land Classification of Object Oriented Remote Sensing Image Based on Texture Features :A Case Study of Gangzha District of Nantong City
[D].
基于eCognition面向对象技术的高分辨率遥感影像土地利用分类——以福州琅岐岛为例
[J].
High resolution remote sensing image classification of land use based on eCognition object-oriented technology:Setting Langqi Island of Fuzhou as an example
[J].
基于决策树的凉城县土地利用分类研究
[J].本文利用凉城县2009年07月20日获取的ALOS多光谱数据和2009年07月09日获取的Landsat5 TM数据,进行影像预处理,计算归一化植被指数,以DEM、坡度及NDVI作为辅助数据,结合这些辅助特征值建立决策树分类提取规则,对凉城县土地利用现状进行分类研究。结果显示:总体分类精度达73.67%,kapaa系数0.696 4。为提高地类的分类准确性将分类结果进行分类后处理,其中裸地面积最大49.71%,林地、耕地、草地总面积为37.77%,其它地类总面积为12.52%,得到与研究区实际土地利用面积相符的地类面积。
Research of land use classification based on decision tree in Liangcheng
[J].
基于QUEST决策树的遥感影像土地利用分类——以云南省丽江市为例
[J].
DOI:10.11821/yj2012110005
URL
[本文引用: 1]
土地利用分类精度直接决定土地利用/土地覆被变化相关研究的准确性,而基于决策树的遥感影像分类是近年来提高土地利用分类精度的重要方法。QUEST决策树在影像解译和空间表达方面,运算速度和分类精度均优于普通CART等决策树方法。本文以云南丽江地区为例,应用QUEST决策树分类方法,对该地区的LandsatTM5影像图进行分类,同时将地形因素、植被指数作为地学辅助数据的因子添加到分类波段中,进行不同特征融合,来处理目标类别间的非线性关系,该方法在处理图像理解知识方面具有更大的灵活性;同时与普通决策树分类法的遥感影像分类的结果相比较,Kappa系数值从原来的0.789提高到0.849。在地形复杂的山地地区,针对TM影像数据,选择基于QUEST决策树分类能够有效提高土地利用分类结果精度。
Research on the accuracy of TM images land-use classification based on QUEST decision tree:A case study of Lijiang in Yunnan
[J].
基于Relief F和PSO混合特征选择的面向对象土地利用分类
[J].
DOI:10.11975/j.issn.1002-6819.2016.04.030
URL
[本文引用: 1]
针对面向对象土地利用分类存在特征维数过高的问题,提出了一种结合Relief F和粒子群优化算法(particle swarm optimization,PSO)的混合特征选择方法,即首先利用Relief F作为特征预选器滤除相关性小的特征,然后以PSO作为搜索算法,以支持向量机(support vector machine,SVM)的分类精度作为评估函数在剩余特征中选择出最优特征子集。该文以吉林省长春市部分区域为研究区,采用Landsat8遥感影像为数据源,首先对其进行多尺度分割,然后提取影像对象的光谱、纹理、形状和空间关系特征,利用提出的混合特征选择方法选取最优特征子集,最后使用SVM分类器对研究区进行土地利用分类,总体分类精度和Kappa系数分别为85.88%和0.8036,与基于4种其他特征选择方法的土地利用分类结果进行比较,基于Relief F和PSO的混合特征选择方法利用最少的特征获得最高的分类精度,能够有效地用于面向对象土地利用分类。
Object based land-use classification based on hybrid feature selection method of combining Relief F and PSO
[J].
C4.5算法的优化
[J].
Optimization of C4.5 algorithm
[J].
年以来北洛河流域土地利用变化对人类活动程度的响应
[J].
DOI:10.11821/dlxb201401005
URL
[本文引用: 1]
土地利用变化是反映人类活动程度的重要因子,分析土地利用时空变化规律,是揭示人类活动程度的有效方式。在遥感和地理信息系统技术的支持下,采用人机交互图像处理方法获取北洛河流域1976年、1998年和2010年土地利用数据;从土地利用变化速度、转移方向和土地利用程度方面,全面分析1976年以来北洛河流域人类活动作用下的土地利用时空变化规律。结果表明:①1976.1998年和1998-2010年间北洛河流域综合土地利用动态度从0.61增加到6.66;耕地和草地面积减少,减小速度分别从2.00%和2.69%增加到26.20%和23.33%,林地和城乡工矿居民用地面积增加,前者增加速度从5.93%增到59.68%,后者增加速度从6.59%减小到3.52%。②两个时段土地利用类型转移方向都呈现出耕地和草地主要转化为林地,少部分耕地转化为城乡工矿居民用地的特点;③流域各县土地利用程度综合变化指数从-2-1之间,扩大为.27~4之间。证明流域内人类活动对自然环境的影响逐渐增大;主要表现为耕地、草地、林地和城乡工矿居民用地的相互转化;影响区域主要分布在流域上游吴旗县、富县、甘泉、黄陵县和洛川县;而人类活动作用导致的林地面积增大程度远远大于耕地和草地面积减小和城乡工矿居民用地面积增加程度。
Acta Geographica Sinica
