

0 引言
当前,全世界正在经历最为迅猛的城市化过程。城市热岛是城市生态系统所特有的一种现象,世界上的城市,无论其规模大小、地处位置不同,都会发生热岛效应[1]。城市热环境是城市空间环境中热力场的综合表现,深入探讨城市扩张对城市热场和绿地空间特征及其动态变化的影响,对于指导城市绿化建设、优化景观布局、改善城市生态环境质量具有重要的理论和实践意义。城市群是指在城市发展到一定阶段后,出现的以一个或几个大城市为核心,以圈域内若干中小城市为次中心或节点,辐射至周边腹地区域,依托便利的交通网络,经济联系紧密,具有较高城市化水平和一体化特征的社会经济活动空间组织形态[2]。兰州—西宁城市群(下文简称兰西城市群)作为黄河上游产业和经济实力最集中的核心区,已经进入了城市化的高速发展期,未来一段时间内仍是区域城市化发展的主体和重点。快速推进的城市化进展改变了原有的生态环境和下垫面类型,促使区域生态系统格局、过程和功能遭受不利影响或产生不可逆的改变。加之兰西城市群的城市主体位于黄河和湟水谷地,受地形因子的制约,空气流动差,城市热岛效应突出。
目前,国内外学者就城市热岛现象展开了大量研究。从研究内容来看,主要集中于地表温度(land surface temperature,LST)反演方法[3]、城市热岛效应时空分布与变化特征[4]、形成机制与影响因素[5]、热环境模拟与预测[6]、生态效应[7]、热岛缓解与调控措施[8]等方面。从研究方法来看,可分为气象资料分析法、遥感监测法和数值模拟法[9]。气象资料分析法由于站点数量少,空间展示粗放,缺乏直观视觉效果。热红外波段遥感影像反演的LST可以全空间化覆盖研究区域,且时间上同步,大大弥补了传统观测方法的不足。但目前最常用的热红外遥感数据源Landsat系列和ASTER数据,都因受时间和空间分辨率的制约,反演的LST仅能显示空间分布,不能揭示演变过程; 即使采用多期遥感数据,也存在月份不一致的问题,难以保证结果的科学性[10]。而时间分辨率高的MODIS数据又存在空间分辨率低的问题,在1 km甚至更低的空间分辨率下研究城市内部的热环境格局显然远远不够。基于以上考虑,本文在大尺度上采用MODIS数据研究整个兰西城市群的热时空环境格局,在小尺度上采用Landsat影像分析兰州、西宁等中心城区的热场空间格局,旨在为兰西城市群人居环境建设提供科学参考。
1 研究区概况及数据源
1.1 研究区概况
分别采用兰西城市群全域(大尺度)和兰西城市群的核心城市化地区——兰州市、西宁市和海东市的中心城区(小尺度)2种尺度研究城市热岛的整体空间格局和城市内部热环境的空间差异。
1.1.1 兰西城市群
关于兰西城市群的范围,目前尚未有统一的界定。本文大尺度上的兰西城市群研究区范围是参考了《甘肃省城镇体系规划(2003—2020年)》和《青海省东部城市群体系规划(2011—2020年)》而确定的。该区位于N34°50'~38°05',E99°00'~105°31'之间,行政上包括甘肃省兰州市5区3县、白银市的1区3县、定西市的1区2县、临夏回族自治州1市1县、西宁市的4区3县、海东市的2区4县以及海南藏族自治州的2县(图1)。
图1
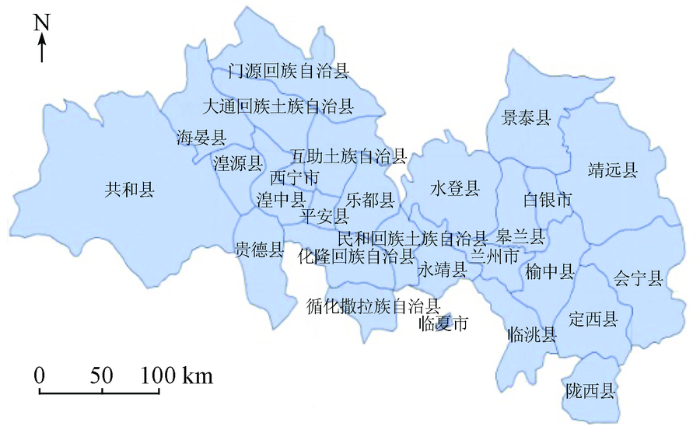
研究区地处青藏高原和黄土高原交汇处,地势西北高、东南低; 属大陆性干旱气候和高原半干旱气候区,年降雨量为180~450 mm,年蒸发量为1 300~1 500 mm,年平均温度为3.2℃~9.3℃; 黄河及其支流湟水河、大通河和庄浪河流贯境内。
1.1.2 兰西城市群的中心城区
兰西城市群的核心是2大省会城市兰州市、西宁市及2城市之间的节点城市海东市。在小尺度上,重点研究兰西城市群3个中心城区城市扩张的热岛响应,3个中心城区研究范围分别取自《兰州市城市总体规划(2011—2020年)》、《西宁市城市总体规划(2001—2020年)》和《海东市城市总体规划(2015—2030年)》。其中,兰州中心城区包括主城区和兰州新区,面积共计2 271.73 km2,常住人口276万人,黄河自西向东穿过; 西宁与海东中心城区面积共计792.20 km2,常住人口164万人,湟水河自西向东横贯境内。1.2 数据源
采用数据源包括: 遥感影像、基础地理信息数据、纸质地图(用于数字化提取信息)、城市规划图件和气象数据等。气象数据来自中国气象数据网(http: //data.cma.cn/site/index.html)提供的与影像日期相对应的气象地面观测站的资料(气温、气压、平均相对湿度及降水)。由于研究尺度不同,遥感数据分别选取了不同空间分辨率和时间分辨率的数据。
在大尺度下,研究城市群的热岛效应时空格局时选用MODIS遥感数据,分析时段为2005—2014年。由于单日影像覆盖有大片云层,为有效减少云干扰,选择最大值合成法生成的8 d LST产品MOD11A2,剔除了有云区域的无效数据,空间分辨率为1 km。MODIS标准LST数据产品投影方式是正弦投影,为了数据统一,将其投影均转换为等积圆锥投影Albers; 再对研究区数据进行镶嵌处理后按城市群边界裁剪; 然后,将LST数据求等权平均值(空洞数据取权值为0); 考虑到有云区域像元值为0,对有云的地方进行掩模,从而去除温度的离群值; 最后,进行辐射纠正,将其转化为LST。依据MOD11A2数据集的头文件说明,可得到MOD11A2产品的辐射缩放比为0.02,辐射缩放截距为0,转换公式为
LST=
式中: LST为开氏地表温度,K; g为辐射缩放比; DN为像元值; b为辐射缩放截距。
在小尺度下,研究中心城区热环境格局时采用了同源的Landsat系列卫星遥感影像数据。研究区位于干旱、半干旱地区,夏季为植被生长的旺盛期,且各种土地覆被类型较易区分,故只选取了夏季的Landsat影像。影像获取自美国地质调查局网站,包括3期Landsat5 TM多光谱影像,成像时间分别为19920729,20000811和20090806; 1期Landsat8 OLI多光谱和TIRS热红外影像,成像时间为20150814,各期影像云量均小于5%。其中,TM热红外影像的空间分辨率为120 m,TIRS 2个热红外波段空间分辨率为100 m。采用Erdas2014软件对影像数据进行预处理,几何校正时选取二元二次多项式,采用双线性内插法对影像进行重采样,输出空间分辨率为30 m; 采用COST模型[11] 进行大气校正。
2 研究方法
2.1 MODIS数据LST分级
由于影像获取时间不同,为了使各时间段的热空间分布数据具有可比性,对LST做归一化处理,用以消除时相的影响。计算式为
Ti=
式中: Ti为第i个像元归一化后的LST值; Ti'为第i个像元的原始LST值; Tmax和Tmin分别为兰西城市群LST的最大值和最小值。
城市热环境类型划分实质是界定不同类型的温度范围。现阶段,LST分级方法包括等间距划分法、基于均值-标准差的划分方法以及基于分形网络算法的划分方法3种。本文在分别采用3种划分方法进行试验的基础上,发现基于均值-标准差的城市热环境划分方法更适合兰西城市群的实际。划分标准如表1所示。
表1 LST等级区间划分标准
Tab.1
| LST等级 | 温度范围 |
|---|---|
| 低温 | Ti<Tmean-2.5 |
| 较低温 | Tmean-2.5Ts≤Ti<Tmean-1.5Ts |
| 次中温 | Tmean-1.5Ts≤ Ti<Tmean-0.5Ts |
| 中温 | Tmean-0.5Ts≤Ti< Tmean+0.5Ts |
| 次高温 | Tmean+0.5Ts≤Ti<Tmean+1.5Ts |
| 高温 | Tmean+1.5Ts≤Ti<Tmean+2.5Ts |
| 特高温 | Ti≥Tmean+2.5Ts |
①Ti,Tmean和Ts分别为归一化后的像元值、平均值及标准差。
2.2 Landsat数据LST反演
T={a6(1-C6-D6)+[b6(1-C6-D6)+C6+D6]T6-D6Ta}/C6 , (3)
C6=ε6τ6 , (4)
D6=(1-τ6)[1+(1-τ6)τ6] , (5)
式中: T为LST值,K; a6和b6均为回归系数,随温度范围的变化不同,在0~30 ℃ 时,a6=-60.326,b6=0.434; T6为遥感影像第6波段的亮度温度; Ta为大气平均作用温度; τ6为大气透射率; ε6为地表比辐射率[13]。
劈窗算法适用于有2个热红外波段的数据,本文对MODIS劈窗算法进行了改进,构建了适用于Landsat8数据的LST遥感反演方法[14], 即
T=A0+A1T10-A2T11 , (6)
式中: T10和T11分别为Landsat8影像第10和11波段的亮度温度; A0,A1和A2分别为劈窗算法参数[15]。
为了验证反演结果的精度,于2015年8月14日上午11:00,使用手持式热红外测温仪(型号为Fluke 62 MAX+ MM-85336-00)对兰州中心城区LST进行了实地测量,绿地、沙地、道路和水体等不同土地利用类型各测量了10次。与影像反演的LST进行了对比,误差的绝对值在0.08~3.16 ℃之间,平均精度为96%,其中水体的误差较大,总正确率为88%。
3 结果与分析
3.1 城市群尺度
3.1.1 热场总体分布及变化
图2-1
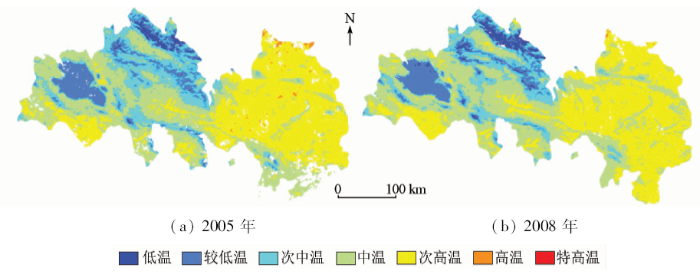
图2-1
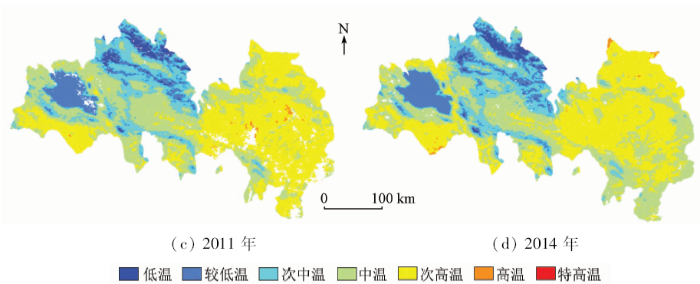
图3
由图2和图3可知,兰西城市群地区LST的空间分布差异明显。总体而言,东部的LST远高于西部。从白天的LST分布来看,高温和特高温区面积极少,主要零散分布在景泰县、靖远县、永登县、皋兰县等黄土丘陵沟壑区以及共和县的南部沙漠化地区,这些地区植被覆盖度低、地表裸露,LST甚至高于人口和产业密集的城镇区域; 低温和较低温区则主要集中分布在祁连山区南坡、拉脊山、青海湖、马啣山和兴隆山等地,这些区域海拔多在2 000 m以上,或者分布有大片森林、草地。从夜间的LST分布来看,高温和特高温区主要集中在兰州市主城区、西宁—海东建成区以及青海湖、黄河干流及其支流湟水河、大通河地区; 夜间的低温和较低温区分布上更加集中,主要连片分布在门源回族自治县、大通回族土族自治县和海晏县。白天和夜间2种场景下,相同的下垫面在不同的时段里LST可能呈现截然不同的状态,白天非水体的下垫面LST较水体高,夜晚则相反。白天城市区域的LST较非城市区域高,而夜晚除水体以外建成区的LST较非建成区高,LST昼夜差异明显,白天的高温区更为分散。从年际变化看,自2005年起,兰西城市群的热环境格局并未发生明显的改变,热岛区和冷岛区范围没有显著存在持续减小或增加的趋势。究其原因,兰西城市群的城市(镇)多在河谷中发育,受河谷地形的限制,城市规模不具备“摊大饼”式的大幅度扩张条件,且建设用地与优质农田分布区重叠,争地现象明显,城市扩展对整个城市群区域热环境的影响不大。
3.1.2 热场季节变化特征
图4
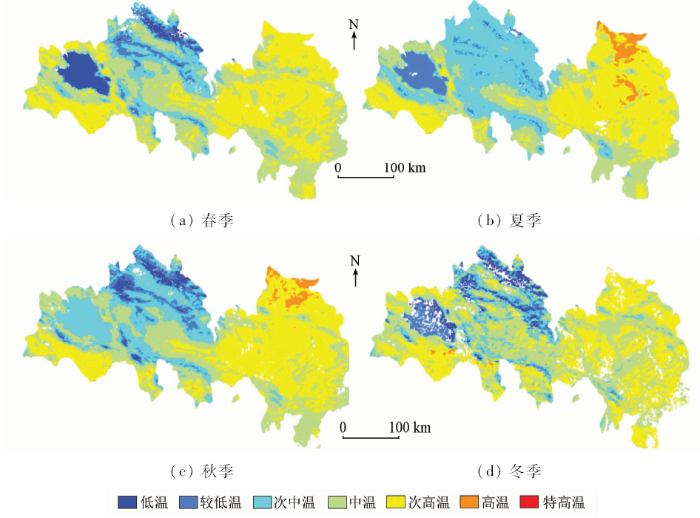
图4
四季白天LST空间分布
Fig.4
Spatial distribution of average daytime LST in four seasons
图5
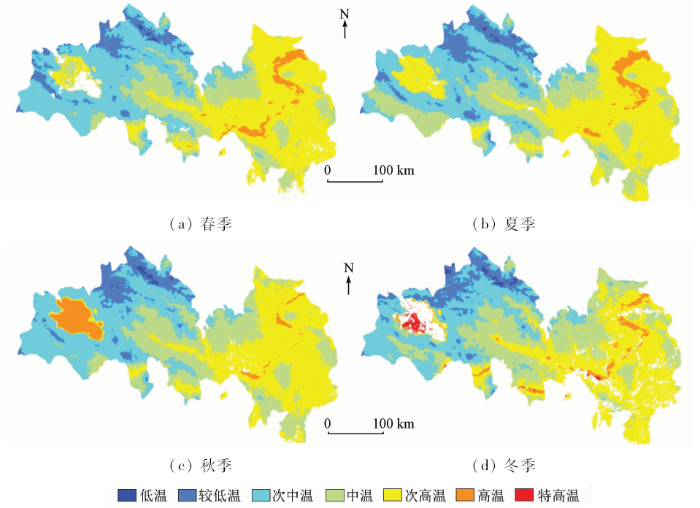
图5
四季夜间LST空间分布
Fig.5
Spatial distribution of average nighttime LST in four seasons
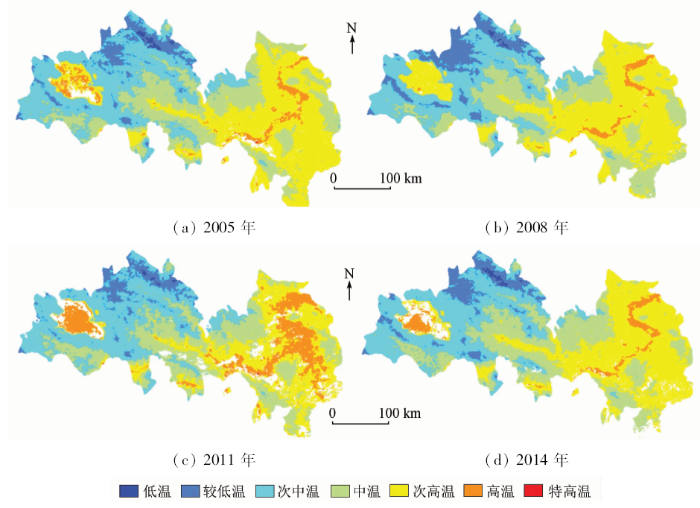
的黄土丘陵地区,春季为次高温,夏秋季为高温,冬季则以次高温和中温混合为主。夜间LST季节变化较大的区域也有2处: ①青海湖地区,由春季的次高温和低温转变到夏季的全部次高温,再演化到秋季的次中温和冬季的较低温; ②黄河干流,春、夏2季呈连续带状次高温区,秋、冬2季则为断续次高温、高温区。
3.2 中心城区尺度
3.2.1 热场总体分布及变化
考虑到4期影像的成像时间不同,为了消除季节差异对LST的影响,对LST进行归一化处理。采用可以体现数据统计特征的自然断点法将其分为低温区、次低温区、中温区、次高温区、高温区5个等级。计算不同时期的热岛比例指数,计算式为[16]
HIRI=
式中: m为归一化等级指数; i为城区高于郊区的温度等级; n为总等级数; wi为第i级权重值; pi为第i级所占面积的百分比。
图6
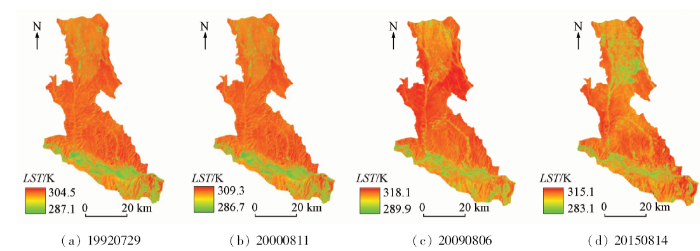
图6
兰州中心城区LST空间分布
Fig.6
Spatial distribution of LST in central urban areas of Lanzhou
图7
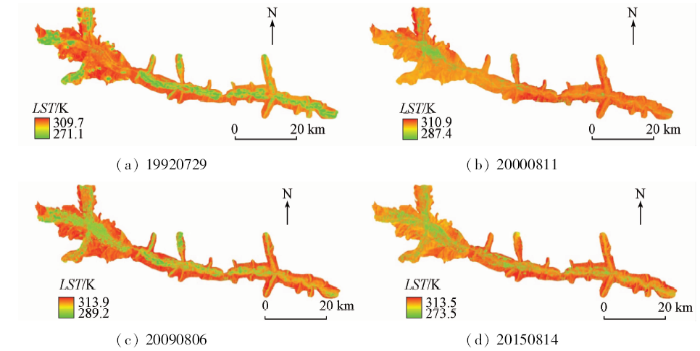
图7
西宁—海东中心城区LST空间分布
Fig.7
Spatial distribution of LST in central urban areas of Xining-Haidong
依据相应的面积统计,本文将高温和次高温区代表城市热岛范围。兰州中心城区统计结果显示,Landsat卫星成像的4个时间点上覆盖面积最大的类型均是次高温级别,分别占城区总面积的比重为79.8%,84%,87%和83%。西宁—海东中心城区统计结果显示,4个时间点上覆盖面积最大的类型也都是次高温级别,分别占城区总面积的78.9%,81.9%,81%和86%。兰州市的热岛效应比西宁—海东中心城区更为严重,总体上呈现先增大后减小的趋势,西宁—海东中心城区的热岛推进更为迅速,基本上呈逐年扩大趋势,2015年热岛覆盖比例已超过兰州市。
通过计算得到4个时间点上兰州中心城区热岛比例指数分别为0.704,0.726,0.771和0.731,呈现先增加后减小的变化趋势。这是由于1992年以来,兰州市主城区和兰州新区建设用地扩张导致不透水面面积增大,承接东部产业转移、人口和产业聚集使得人为排放的热量激增,致使城市热岛效应加重。2015年热岛比例指数降低的原因可能与兰州市近年来加大生态环境建设力度有直接的关系。2010—2015年间,兰州市城市建成区绿地率从25.07%增加到33.2%,绿化覆盖率从28.17%增加到39.1%; 人均公园绿地面积从8.93 m2增加到11.08 m2。兰州新区也很注重生态环境建设,已建成6个公园,总面积达200 hm2,森林覆盖率达到46%。地表实际温度与地表反射率有直接的关系,地表反射率越大,地表实际温度越高。值得注意的是,兰州中心城区最高温连片分布区并非主城区,也不是兰州新区,而出现在主城区和兰州新区之间的黄土丘陵沟壑地带。其原因主要是黄河及其支流湟水河等谷地周围的山区基本都是黄土荒山,植被覆盖度极低,所形成的不规则面少,反射的离散度小,反射率总体高于建成区,地表吸热快; 在影像获取的时间内(北京时间上午11:00),城市区域因其下垫面的复杂性(包含公园绿地、水域和各类建筑物),下垫面所累积的温度没有周围的丘陵高。同时,热岛区域的坡向多为南向、东南向和东向的向阳区,因此在影像成像时间内接受的太阳辐射多。对兰州这种周围为荒山的河谷型干旱区城市来说,就容易出现白天“冷岛”,晚上“热岛”的现象。
西宁—海东中心城区4个时间点上热岛比例指数分别为0.691,0.697,0.725和0.744,呈现持续增加的变化趋势。对比各期LST分布情况发现,1992—2000年间,LST增加的区域主要分布在海东地区的湟水谷地,其原因是20世纪90年代中期—2000年间西宁市发展较为缓慢[5],而海东市城建推进较快。2000—2009年间,热场增强的区域主要分布在西宁市主城区南部和西南部,一方面是随着西部大开发战略的实施,西宁市城市化速度加快,依托湟水河谷地向多个方向展开,使得上述地区建筑密度加大,城市热岛增强; 另一方面,裸土多分布在河谷两侧的阶地,空气对流强、风速大、湍流交换迅速,影响裸土分布区的LST[17]。2009—2015年间,热场增强的区域主要分布在海东市河谷阶地,这个时期是海东“撤地设市”的时期,城市建设进入了新一轮的快速增长期,河谷里的可利用地基本被占用,故向河谷两侧阶地扩张。近年来西宁—海东城市建设强度增加,使得硬化地表覆盖的比例增大,其结果是增加了地表热辐射,从而加剧了热岛效应。热状况恶化显著的区域一是在原有建设用地上再建设或增加建筑密度,如城中区等旧城扩张地段; 二是新增的建设用地,即自然地表被硬化地表所替换的地段,如城西的海湖新区和西钢,城北区的高科技生物产业园区和城东经济技术开发区等。
3.2.2 LST与NDVI及NDBI相关分析
不同地表覆盖类型的热力性质具有着显著差异,对城市热岛效应的贡献也各不相同。选取归一化差值植被指数(normalized difference vegetation index,NDVI)和归一化差值建筑用地指数(normalized difference building index,NDBI)进行相关性分析。从研究区随机选取300个点,去除个别落在水体中的点后,分别对兰西城市群建成区的LST与NDVI和NDBI分别进行相关性分析,探索河谷型城市格局下这2个指数与LST的相关性。
以兰州中心城区为例,在检验系数p<0.01的显著水平上,从LST与NDVI的相关关系来看,19920729,20000811,20090806和20150814的决定系数分别为0.388 5,0.334 3,0.434 3和0.317 1,各时间点上地表实际温度与NDVI均呈现较为明显的负相关关系,NDVI值越高,城区的LST值则越低,验证了植被覆盖度对分割城市热岛,降低LST的作用,植被在可见光波段的反射率低,吸收的热量多,借助自身的蒸腾作用会减少土壤或地表的热量,而且覆盖度越大,其蒸腾作用就越强; 从LST与NDBI的相关关系来看,4个时间点上的决定系数分别为0.405 9,0.528 8,0.511 1和0.497 8,二者表现出明显的正相关关系,NDBI值越高,其LST值也越高,说明建筑物的密集程度也是影响城区LST的重要因素。西宁—海东中心城区也表现出相同的特征,在19920729,20000811,20090806和20150814,LST与NDVI的决定系数分别为0.636 9,0.303 0,0.357 6 和0.371 7; 在4个时间点上,LST与NDBI的决定系数则分别为0.725 0,0.404 8,0.423 7 和0.459 7。
兰州中心城区2015年8月14日LST与NDVI和NDBI的散点图分别如图8所示。
图8
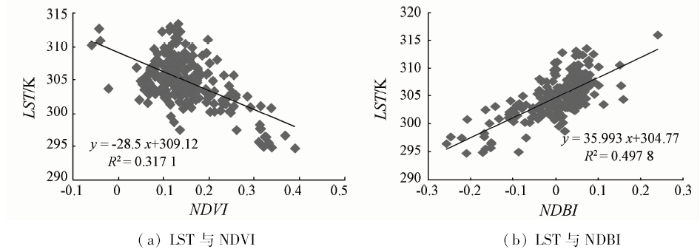
图8
兰州中心城区2015年08月14日LST与NDVI和NDBI的相关关系
Fig.8
Relationships between LST and NDVI, NDBI in central urban areas of Lanzhou on Aug.14, 2015
从图8可以看出,中心城区LST与NDVI在空间上呈负相关,与NDBI则呈正相关。在城市基质背景下,通过增加植被和水体面积来分割城市中的不透水面,可有效改善城市热环境,缓解热岛效应。
4 结论
本文采用MODIS白天和夜间LST产品资料和Landsat多时相遥感影像,分别从宏观和微观的不同尺度考察分析了兰西城市群城市热环境的格局与变化特征。利用MODIS数据宏观分析了兰西城市群热岛效应的总体形态结构、昼夜和季节变化,利用Landsat数据分析了中心城区内部的热场结构,兼顾了MODIS数据的高时间分辨率和Landsat热红外影像的高空间分辨率优势,为城市热岛时空演变研究提供了新的角度。
1)宏观上兰西城市群并未存在显著的城市热岛效应,热岛的分布与下垫面类型密切相关; 时间分布特征显示,作为河谷城市,兰西城市群中心城区的城市热岛效应在白天并不明显,有时反而会出现温度低于周围黄土丘陵的“城市冷岛”现象。
2)从中心城区来看,热场空间格局发生了较大变化,热状况显著恶化的区域基本与相应时期城市的扩张范围吻合; 兰州中心城区热岛比例指数呈现先增加后减小的变化趋势,西宁—海东中心城区热岛比例指数则呈现持续增加的态势。相比而言,兰州中心城区的热岛效应比西宁—海东中心城区更为严重,但西宁—海东中心城区的热岛推进更为迅速。
由于数据获取所限,本文在研究中心城区热环境时只利用了个别间断年份的数据,无法进一步分析连续年份之间或年内季节之间的热岛演变格局。获取更高时间和空间分辨率的遥感数据,并研究其反演算法,以更加全面地揭示兰西城市群热岛效应的时空分布格局是下一步研究的重点。此外,探讨城市群热岛效应的形成机理,定量分析绿地和水体的减热效应,并模拟不同下垫面类型组合情景下的降温作用,也是未来研究的重要方面。
参考文献
Multi-temporal trajectory of the urban heat island centroid in Beijing,China based on a Gaussian volume model
[J].
DOI:10.1016/j.rse.2014.03.037
URL
[本文引用: 1]

61Determine UHI centroid using a 3D Gaussian volume model and MODIS data61Study multi-temporal variation of the magnitude and location of UHI centroid61Study contributions of thermal landscape, NDVI and albedo to the change of UHI
我国都市圈理论研究与规划实践中的若干误区
[J].
DOI:10.3321/j.issn:1000-0585.2006.01.014
URL
[本文引用: 1]
随着我国城市化进程的加快,在长江三角洲、京津冀、珠江三角洲和辽中南等经济社会发展水平最高的地区,大城市的地域空间组织开始从单体型城市的简单形态,向以中心城市为核心的诸多城市和地区相互交融形成的都市圈的复杂形态转变。大上海、大北京、大广州、大沈阳等大都市圈的雏形已经初步形成,同时在一些经济发展水平较高的大中城市的周边地区,一些区域性都市圈和地方性都市圈也在逐渐形成。以这些中心城市为核心的都市圈的形成与发展,对区域经济社会的发展起到了越来越重要的支撑作用。借鉴发达国家的经验,实施都市圈的发展战略已经成为一个共识。正确引导都市圈的建设与发展是我国新形势下城市发展的一个重要课题。本文指出了我国目前都市圈理论研究和规划实践上存在的一些误区,对都市圈的基本概念、地域本质、形成机理、地域结构与空间形态、类型与规模等进行了分析,为我国21世纪都市圈的建设与发展提供科学的理论依据。
Several long-standing mistaken ideas in the theoretical studies and planning practices of Chinese metropolitan regions
[J].
Land surface temperature retrieval methods from Landsat-8 thermal infrared sensor data
[J].
DOI:10.1109/LGRS.2014.2312032
URL
[本文引用: 1]
The importance of land surface temperature (LST) retrieved from high to medium spatial resolution remote sensing data for many environmental studies, particularly the applications related to water resources management over agricultural sites, was a key factor for the final decision of including a thermal infrared (TIR) instrument on board the Landsat Data Continuity Mission or Landsat-8. This new TIR sensor (TIRS) includes two TIR bands in the atmospheric window between 10 and 12 渭m, thus allowing the application of split-window (SW) algorithms in addition to single-channel (SC) algorithms or direct inversions of the radiative transfer equation used in previous sensors on board the Landsat platforms, with only one TIR band. In this letter, we propose SC and SW algorithms to be applied to Landsat-8 TIRS data for LST retrieval. Algorithms were tested with simulated data obtained from forward simulations using atmospheric profile databases and emissivity spectra extracted from spectral libraries. Results show mean errors typically below 1.5 K for both SC and SW algorithms, with slightly better results for the SW algorithm than for the SC algorithm with increasing atmospheric water vapor contents.
Characterizing the spatial dynamics of land surface temperature-impervious surface fraction relationship
[J].
DOI:10.1016/j.jag.2015.11.006
URL
[本文引用: 1]
The land surface temperature (LST) pattern is treated as one of the primary indications of environmental impacts of land cover change. Researchers continue to explore the potential contribution of land surface to temperature rising. The LST-land surface relationship is dynamic and varies spatially. Based upon the previous studies, this research assumes that such dynamics is manifested at two levels: (1) the phenomenon level, and (2) its formation mechanism level. The research presents a workflow of exploring such dynamics at both levels. The variogram of the phenomenon and multi-scale analysis of the LST-land surface relationship are mutually interpreted. In the case study of Wuhan, China, the variogram of the LST indicates that the operational scale of the phenomenon is 500–65002m. It suggests the optimal scale to inspect the LST and its cause in the study area. This finding is verified and further inspected through multi-scale analysis of the LST–Impervious Surface Fraction (ISF) relationship at the formation mechanism level. The research also employs the Spatial Autocorrelation model to show how the ISF impacts the LST through scales. A flexible autocorrelation weight matrix is proposed and implemented in the model. The parameters of the model exhibit the thermal sensitivity of land surface and again represent the scale features. The Ordinary Least Square regression is used as the benchmark. Several implications are discussed.
河谷型城市热岛空间分布格局演变及对策——以西宁市区为例
[J].
DOI:10.3724/SP.J.1047.2014.00592
URL
[本文引用: 2]
城市热岛效应直接反映着城市的气候特征,这对于研究由城市化发展与环境改变引起的城市气温的变化及保护城市的生态环境具有重要的现实意义。本文利用LandsatTM影像、气象台站资料,基于GIS的空间分析技术及单窗算法,对河谷型城市西宁市的地表温度进行反演,分析了地表温度与NDVI、NDBI的空间对应关系。结果表明:西宁市存在明显的城市热岛效应,热场分布及延伸与西宁市空间扩展布局相一致,热岛范围呈逐年增长的趋势;低、中温区的热岛面积大幅度减少,高温区的热岛范围显著增加;热岛效应冬季最强,夏季次之,秋季有明显减弱的趋势。在河谷型城市的空间格局上,地表温度与NDVI呈负相关关系、与NDBI呈正相关关系。最后,依据热岛时空演化、成因分析和策略研究的思路,从不同角度提出了缓解城市热岛效应的措施和对策,为未来西宁市热环境的改善提供科学参考和决策支持。
Analysis of urban heat island environment in a valley city for policy formulation:A case study of Xining City in Qinghai Province of China
[J].
Modelling and remote sensing of land surface temperature in Turkey
[J].
DOI:10.1007/s12524-011-0158-3
URL
[本文引用: 1]
This study introduces artificial neural networks (ANNs) for the estimation of land surface temperature (LST) using meteorological and geographical data in Turkey (26–45°E and 36–42°N). A generalized regression neural network (GRNN) was used in the network. In order to train the neural network, meteorological and geographical data for the period from January 2002 to December 2002 for 10 stations (Adana, Afyon, Ankara, Eski06ehir, 02stanbul, 02zmir, Konya, Malatya, Rize, Sivas) spread over Turkey were used as training (six stations) and testing (four stations) data. Latitude, longitude, elevation and mean air temperature are used in the input layer of the network. Land surface temperature is the output. However, land surface temperature has been estimated as monthly mean by using NOAA-AVHRR satellite data in the thermal range over 10 stations in Turkey. The RMSE between the estimated and ground values for monthly mean with ANN temperature(LST ANN ) and Becker and Li temperature(LST B-L ) method values have been found as 0.07702K and 0.09102K (training stations), 0.04502K and 0.00302K (testing stations), respectively.
Assessing the effects of land use spatial structure on urban heat islands using HJ-1B remote sensing imagery in Wuhan,China
[J].
DOI:10.1016/j.jag.2014.03.019
URL
[本文引用: 1]
Urban heat islands (UHIs) have attracted attention around the world because they profoundly affect biological diversity and human life. Assessing the effects of the spatial structure of land use on UHIs is essential to better understanding and improving the ecological consequences of urbanization. This paper presents the radius fractal dimension to quantify the spatial variation of different land use types around the hot centers. By integrating remote sensing images from the newly launched HJ-1B satellite system, vegetation indexes, landscape metrics and fractal dimension, the effects of land use patterns on the urban thermal environment in Wuhan were comprehensively explored. The vegetation indexes and landscape metrics of the HJ-1B and other remote sensing satellites were compared and analyzed to validate the performance of the HJ-1B. The results have showed that land surface temperature (LST) is negatively related to only positive normalized difference vegetation index (NDVI) but to Fv across the entire range of values, which indicates that fractional vegetation (Fv) is an appropriate predictor of LST more than NDVI in forest areas. Furthermore, the mean LST is highly correlated with four class-based metrics and three landscape-based metrics, which suggests that the landscape composition and the spatial configuration both influence UHIs. All of them demonstrate that the HJ-1B satellite has a comparable capacity for UHI studies as other commonly used remote sensing satellites. The results of the fractal analysis show that the density of built-up areas sharply decreases from the hot centers to the edges of these areas, while the densities of water, forest and cropland increase. These relationships reveal that water, like forest and cropland, has a significant effect in mitigating UHIs in Wuhan due to its large spatial extent and homogeneous spatial distribution. These findings not only confirm the applicability and effectiveness of the HJ-1B satellite system for studying UHIs but also reveal the impacts of the spatial structure of land use on UHIs, which is helpful for improving the planning and management of the urban environment.
Cooling the cities:A review of reflective and green roof mitigation technologies to fight heat island and improve comfort in urban environments
[J].
DOI:10.1016/j.solener.2012.07.003
URL
[本文引用: 1]
The temperature of cities continues to increase because of the heat island phenomenon and the undeniable climatic change. The observed high ambient temperatures intensify the energy problem of cities, deteriorates comfort conditions, put in danger the vulnerable population and amplify the pollution problems. To counterbalance the phenomenon, important mitigation technologies have been developed and proposed. Among them, technologies aiming to increase the albedo of cities and the use of vegetative green roofs appear to be very promising, presenting a relatively high heat island mitigation potential. This paper aims to present the state of the art on both the above technologies, when applied in the city scale. Tenths of published studies have been analysed. Most of the available data are based on simulation studies using mesoscale modeling techniques while important data are available from the existing experimental studies. When a global increase of the city albedo is considered, the expected mean decrease of the average ambient temperature is close to 0.3K per 0.1 rise of the albedo, while the corresponding average decrease of the peak ambient temperature is close to 0.9K. When only cool roofs are considered, the analysis of the existing data shows that the expected depression rate of the average urban ambient temperature varies between 0.1 and 0.33K per 0.1 increase of the roofs albedo with a mean value close to 0.2K. As it concerns green roofs, existing simulation studies show that when applied on a city scale, they may reduce the average ambient temperature between 0.3 and 3K. Detailed analysis of many studies reporting a comparison of the mitigation potential of both technologies has permitted the definition of the limits, the boundaries and the conditions under which the considered technologies reach their better performance, in a synthetic way.
Area delineation and spatial-temporal dynamics of urban heat island in Lanzhou City,China using remote sensing imagery
[J].
DOI:10.1007/s12524-015-0477-x
URL
[本文引用: 1]
One of the key impacts of rapid urbanization on the environment is the effect of urban heat island (UHI). By using the Landsat TM/ETM+ thermal infrared remote sensing data of 1993, 2001 and 2011 to...
基于TM卫星遥感影像的西安市城市热岛效应变化分析
[J].利用2006年和2010年8月的TM卫星影像,通过定量遥感反演手段和相对亮温分析方法,反演和分析了西安市城区相应时间点上的热场温度。结果显示:其城区平均气温由2006年的26.28℃提高到2010年的28.14℃,5 a间升高了1.86℃。期间高温区域在市区的西部、西南部和东南部出现了较大范围的扩展,尤其以东南部的扩展范围和强度为大。从相对亮温情况来看,全市缺乏极强热岛,整个市区以弱热岛占绝对优势,2010年和2006年其面积比例分别为61.11%和58.64%;其次为绿岛,其面积比例在2010年和2006年分别为34.08%和35.98%;中等热岛和强热岛所占比例极小。绿岛面积减少的最大区域在西北部的汉长安城遗址南部以及市区东南部的三兆、东伍一带;而强热岛在2010年呈星点状分布在东郊的灞桥纺织城、西二环附近的西安电工铸造厂和西安电压力容器厂、长安区的河池寨等地。从相对亮温热力斑块的转移概率矩阵看,最稳定的热力景观斑块类型为弱热岛斑块和绿岛斑块,2006—2010年,其保持不变的面积分别达79.41%和67.82%;而最不稳定的景观类型为中等热岛和极强热岛,其发生变化的面积比例分别为70.73%和64.18%。从西安市区热场变化的原因来看,城市建设的影响最大,其中人口增长、建成区范围扩张和房地产开发是最主要的影响因素,另外全球变化背景下的区域气温升高也是西安市热岛效应加剧的另一促进因素,而城市绿化建设可以在一定范围内改善局地的热岛效应状况。
Dynamic change of urban heat island effect in Xi’an based on TM images
[J].
Image-based atmospheric corrections-revisited and improved
[J].
DOI:10.1016/0031-0182(96)00019-3
URL
[本文引用: 1]
A major benefit of multitemporal, remotely sensed images is their applicability to change detection over time. Because of concerns about global and environmental change, these data are becoming increasingly more important. However, to maximize the usefulness of the data from a multitemporal point of view, an easy-to-use, cost-effective, and accurate radiometric calibration and correction procedure is needed. The atmosphere effects the radiance received at the satellite by scattering, absorbing, and refracting light; corrections for these effects, as well as for sensor gains and offsets, solar irradiance, and solar zenith angles, must be included in radiometric correction procedures that are used to convert satellite-recorded digital counts to ground reflectances. To generate acceptable radiometric correction results, a model is required that typically uses in-situ atmospheric measurements and radiative transfer code (RTC) to correct for atmospheric effects. The main disadvantage of this type of correction procedure is that it requires in-situ field measurements during each satellite overflight. This is unacceptable for many applications and is often impossible, as when using historical data or when working in very remote locations. The optimum radiometric correction procedure is one based solely on the digital image and requiring no in-situ field measurements during the satellite overflight. The dark-object subtraction (DOS) method, a strictly image-based technique, is an attempt to achieve this ideal procedure. However, the accuracy is not acceptable for many applications, mostly because it corrects only for the additive scattering effect and not for the multiplicative transmittance effect. This paper presents an entirely image-based procedure that expands on the DOS model by including a simple multiplicative correction for the effect of atmospheric transmittance. Two straightforward methods to derive the multiplicative transmittance-correction coefficient are presented. The COS(TZ) or COST method uses the cosine of the solar zenith angle, which, to a first order, is a good approximation of the atmospheric transmittance for the dates and sites used in this study. The default TAUs method uses the average of the transmittance values computed by using in-situ atmospheric field measurements made during seven different satellite over-flights. Published and unpublished data made available for this study by Moran et al. (1992) are used, and my model results are compared with their results. The corrections generated by the entirely image-based COST model are as accurate as those generated by the models that used in-situ atmospheric field measurements and RTC software.
用陆地卫星TM6数据演算地表温度的单窗算法
[J].
Mono-window algorithm for retrieving land surface temperature from Landsat TM6 data
[J].
张掖绿洲冷岛效应时空格局的遥感分析
[J].地表温度是生态系统中极其重要 的环境因子,中小尺度区域的热量资源和热场分布对绿洲冷岛效应的研究以及评价绿洲的稳定性具有重要意义。利用LandsatTM卫星影像,采用单窗算法, 反演了张掖绿洲1999年和2007年两个时期的陆地表面温度(LST),构建了绿洲"冷岛"比例指数,定量分析了张掖地区近8年来绿洲冷岛效应的时序变 化,并且通过对张掖热场的分析,揭示了冷岛效应的空间变化特点。结果表明:①张掖绿洲冷岛效应明显,但近8年来有减弱的趋势;②南北向绿洲内部和荒漠内部 温度差异均在减小,城区温差在扩大;东西向绿洲内部和城区内部温度差异均在减小,荒漠温差在扩大;③水体、耕地、草地、建设用地和林地的平均LST有所降 低,荒漠等未利用土地LST有所升高,其中建筑用地的LST减幅最大。为研究绿洲的光、热、水、土的空间分布及区域变化,评价绿洲的稳定性提供了一种新的 角度,同时对绿洲与荒漠之间的大气物理模型及动力学有一定参考意义。
Remote sensing analysis of the spatial-temporal pattern of “cold island” effect of Zhangye Oasis
[J].
针对MODIS影像的劈窗算法研究
[J].
DOI:10.3321/j.issn:1671-8860.2005.08.011
URL
[本文引用: 1]
在分析热红外遥感和现有的劈窗算法的理论基础上,针对MODIS数据对劈窗算法进行了推导.通过对热辐射强度和温度之间的关系计算,对Planck函数进行了线性简化,同时分析了MODIS的波段设置特点.MODIS的近红外波段适宜于反演大气水汽含量,而大气透过率主要从MODIS的近红外波段数据反演得到大气水汽含量,并进而根据水汽含量与大气透过率的关系来进行估算.通过MODIS的可见光波段、近红外和中红外波段数据,完全可以获得地表温度反演所需要的基本参数,从而形成了针对MODIS数据的地表温度反演的劈窗算法.最后以环渤海地区为实验区,对本文提出的方法进行了实际应用分析.
The research of split-window algorithm on the MODIS
[J].
基于Landsat 8劈窗算法与混合光谱分解的城市热岛空间格局分析——以兰州市中心城区为例
[J].在ENVI和GIS支持下,提出了基于Landsat 8遥感影像的地温反演劈窗算法,提取兰州市中心城区地表温度。利用FNEA和混合光谱分解法确定了兰州市中心城区的城市热岛中心、不透水面和植被盖度,分析了城市热岛空间分布格局以及地表温度与下垫面之间的关系。结果显示:基于Landsat 8数据地温反演的劈窗算法是可行的。兰州中心城区的高温区分布较集中,地表温度与植被呈较强的负相关,与不透水面呈不显著的正相关,与其他非光合物质呈正相关。
Spatial pattern on urban heat environment using split window algorithm and spectral mixture analysis based on Landsat 8 images:A case of Lanzhou City
[J].
不同时相的遥感热红外图像在研究城市热岛变化中的处理方法
[J].
An image processing technique for the study of urban heat island changes using different seasonal remote sensing data
[J].
西北中等城市热岛效应变化特征——以天水市为例
[J].
DOI:10.3969/j.issn.1674-991X.2011.05.063
URL
[本文引用: 1]
为探索西北部中等城市的城市热岛效应规律,利用2004--2010年天水市城、郊自动气象站资料,对天水市城、郊温度差异进行了系统分析。结果表明:天水市城区热岛效应比较显著;冬季是热岛现象最强的季节,夏季是热岛现象最弱的季节;城区热岛现象持续时间为18:00-10:00,占全天的2/3,最大强度达,1.5℃;城区“凉岛”持续时间为11:00—17:00,占全天的1/3,最大强度为0.3℃;地面温度城、郊差比气温更大,40cm以下城区地温全年大于郊区;降雪日及连阴雨天气的中后期,城区基本上维持“凉岛”;强降温天气下,城、郊气温变化基本一致,差别不大。
Variation of urban heat island characteristics at medium-sized city in the Northwest:A case of Tianshui
[J].
