

0 引言
植被指数,如归一化差值植被指数(normalized difference vegetation index,NDVI)、增强型植被指数(enhanced vegetation index,EVI)和归一化差值红外指数(normalized difference infrared index,NDII)等,是利用遥感技术研究植被长势的主要指标[3,4]。国内外学者基于遥感技术进行作物长势监测已经取得了一系列成果。黄青等[5]基于MODIS NDVI 数据,通过与近5 a 作物长势的平均状况对比,发现2013年东北地区不同作物长势在整个生育期内的时空分布存在较大差异; 邹文涛等[6]利用MODIS NDVI 序列数据,综合采用实时监测、过程监测和时间序列聚类监测方法,以2008―2012年间平均长势为基础,对印度2013年作物长势进行监测,优化了Cropwatch作物长势监测方法; Esquerdo等[7]、Duveiller等[8]和Becker-Reshef等[9]也基于SPOT-VGT,NOAA-AVHRR和MODIS遥感影像开展了大范围的作物长势监测。但综合来看,目前已有的成果一般都是根据作物多年平均长势状况对当年相应时间点或时间段的作物长势进行研究,而在大范围的作物长势监测时,不同区域的作物会因所处物候期的不同导致长势出现差异; 且受气候因子和人为因素的影响,同一区域作物的物候在时间序列上也会发生变化,这种因为物候变化产生的长势差异与作物本身长势状况的变化混在一起,增加了对作物长势在时间序列上变化分析的不确定性。因此,开展大区域、长时间序列作物长势监测研究,首先需要对作物长势参数进行物候修正,以消除或减少物候差异对作物长势监测结果的影响。
本文以山东省冬小麦为研究对象,以MODIS 8 d合成反射率数据为主要数据源,结合地面调查数据,在提取2001―2015年间冬小麦抽穗期的基础上,进行抽穗期冬小麦长势监测; 并对冬小麦长势状况的时空格局进行分析,初步探索如何消除长时间和大区域作物长势监测中物候差异的影响。
1 数据源与预处理
1.1 遥感数据源
本文使用的遥感数据为8 d最大值合成的MODIS反射率数据集——MOD09A1,空间分辨率为500 m,从MODIS数据免费分发网站(
表1 各种植被指数的定义
Tab.1
1.2 冬小麦种植区
本文中的冬小麦种植区依据中科院地理所发布的2005年山东省土地利用数据中的耕地数据进行掩模运算得到(图1)。
图1
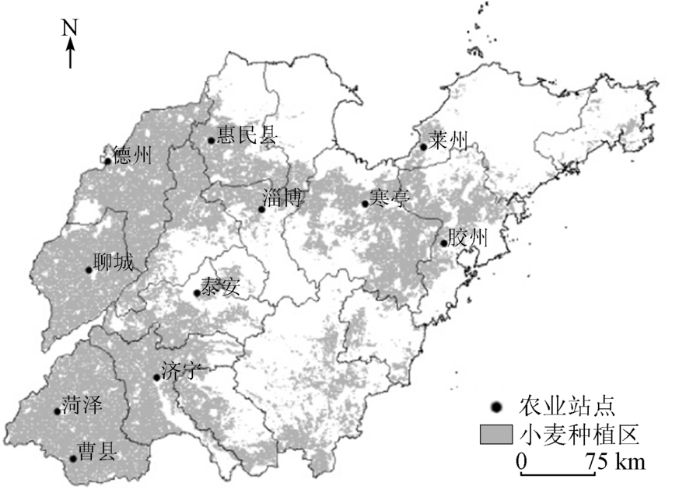
图1
山东省冬小麦种植区分布及农业台站位置
Fig.1
Distribution of winter wheat planting regions in Shandong and location of farm observation stations
因为冬小麦种植面积变化不是本文研究的重点,因此本文未对研究时间段内冬小麦种植区的分布变化对研究精度的影响进行分析。
1.3 地面验证数据
利用中国气象科学数据共享网(
2 研究方法
2.1 冬小麦抽穗期数据提取
基于遥感技术的作物物候提取方法已有很多,本文基于滤波重构后的逐日植被指数时间序列提取植被指数(vegetation index,VI)峰值出现的时间,作为冬小麦抽穗期的时间标识。NDVI是目前基于遥感进行作物物候提取的最常用指标,但在植被生长旺盛时期,NDVI易出现饱和; 而EVI因加入了蓝光波段,可降低土壤背景和大气因素的影响,消除NDVI易饱和的缺陷[16]。 因此,本文基于NDVI和EVI时序数据,分别进行山东省冬小麦抽穗期提取; 然后根据11个农业台站观测的冬小麦抽穗期数据,依据相关系数r、平均绝对误差MAE、偏差bias和纳什系数NSE,对2种指数的提取结果进行判定,选择提取精度较高的指标作为本文冬小麦抽穗期提取的遥感指标。
2.2 冬小麦长势状况判定
首先,逐像元计算出2001―2015年间抽穗期的NDVI,EVI,NDII,PI_NDVI和PI_EVI值; 然后,计算所有年份抽穗期中各指数均值; 最后,提取各指数的逐年距平值(即指数值与指数均值的差值)。正距平指数表示植被长势比多年平均状况好,负距平指数则表示植被长势比多年平均状况差。陈维英等[17]基于平均植被指数(average VI,AVI)对干旱状况进行了分级,(-0.2,-0.1)表示干旱,(-0.6,-0.3)表示严重干旱。以此为参考,结合地面调查资料,本文将山东省冬小麦长势分为5个等级。由于缺少直接表征冬小麦长势的地面验证数据,据已有研究,与其他生长期相比,小麦抽穗期的综合长势情况与产量呈显著相关[18]。因此,为了评价各植被指数在山东省小麦长势监测中的适应性,首先,计算出研究区每年的各指数和; 然后依据山东省统计局发布的2001―2014年间山东省冬小麦产量数据,评价各指数监测山东省冬小麦长势精度的适宜性; 从而选择出能表征山东省小麦长势状况的遥感指标,并对近15 a以来的山东省抽穗期冬小麦长势进行评价。
山东省冬小麦长势等级划分如表2所示。
表2 山东省冬小麦长势划分等级
Tab.2
| 植被指数距平值 | 长势等级 | 植被指数距平值 | 长势等级 |
|---|---|---|---|
| (-∞,-0.3] | 很差 | (0.1,0.3] | 较好 |
| (-0.3,-0.1] | 较差 | (0.3,+∞) | 很好 |
| (-0.1,0.1] | 持平 | ||
3 结果分析与验证
3.1 2001―2015年山东省冬小麦抽穗期分析
3.1.1 冬小麦抽穗期遥感监测结果验证根据经纬度分别提取农业台站站点的冬小麦抽穗期NDVI和EVI监测结果,并利用站点数据进行验证,结果如图2所示。
图2
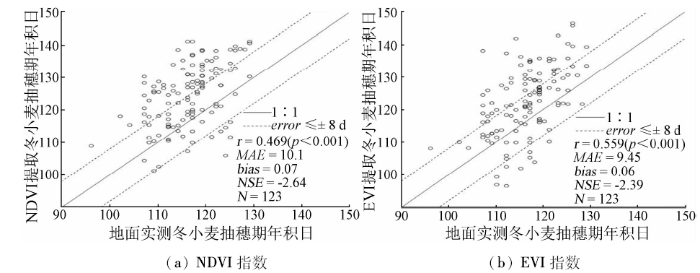
图2
冬小麦抽穗期遥感提取结果与地面实测数据对比
Fig.2
Comparison between heading dates of winter wheat extracted using remote sensing data and ground measured data
基于NDVI和EVI提取的冬小麦抽穗期与地面实测数据均呈极显著相关关系(NDVI: r=0.469,p<0.001; EVI: r=0.559,p<0.001),说明二者均可作为冬小麦抽穗期遥感判识指标。分析二者提取结果的其他评价指标,基于EVI提取的MAE为9.45,小于基于NDVI提取结果(MAE=10.1); 且基于EVI提取结果的bias和NSE分别为0.06和-2.39,优于基于NDVI提取结果的0.07和-2.64。说明本文基于EVI指数提取的冬小麦抽穗期优于基于NDVI指数提取的冬小麦抽穗期,可以作为研究区冬小麦抽穗期长势评价的依据。3.1.2 近15 a冬小麦抽穗期时空格局图3分别示出基于EVI提取的山东省近15 a以来冬小麦抽穗期均值的空间分布(图3(a))和时间变化趋势(图3(b))。根据图3(a)可知,山东省冬小麦抽穗期主要集中在年积日第100―120天(即4月中旬―下旬),并从南向北、自西向东逐渐推迟; 从时间变化(图3(b))来看,近15 a以来山东省冬小麦抽穗期的时间变化趋势并不明显,变化在-0.5~0.5 d/a的区域占冬小麦种植区总面积的63%以上,但仅有0.07%区域的冬小麦抽穗期变化达到显著水平。
图3
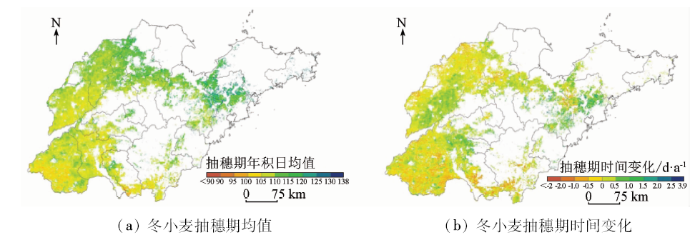
图3
2001—2015年山东省冬小麦抽穗期时空格局
Fig.3
Spatio-temporal pattern of heading dates of winter wheat in Shandong Province during 2001—2015
3.2 2001―2015年山东省冬小麦长势评价
3.2.1 冬小麦长势时空格局表3示出研究区各植被指数值逐像元累积之和与2001―2014年间山东省冬小麦总产量数据的相关关系。
表3 各植被指数表征的长势与产量相关关系
Tab.3
| 植被指数 | r | p | 植被指数 | r | p |
|---|---|---|---|---|---|
| EVI | 0.577 | 0.031 | PI_EVI | 0.596 | 0.029 |
| NDVI | 0.498 | 0.070 | PI_NDVI | 0.727 | 0.003 |
| NDII | 0.316 | 0.270 |
根据表3,综合考虑作物绿度和水分指数(PI_NDVI和PI_EVI)与作物产量的相关性达到显著水平,优于只考虑绿度的指数(NDVI和EVI)和只考虑水分的指数(NDII),其中以PI_NDVI的相关关系最优,为极显著相关(r=0.727,p=0.003)。因此,本文以PI_NDVI为指标,对近15 a以来的山东省冬小麦长势提取结果进行评价。
为更好地反映山东省冬小麦长势演变,本文取研究区每年PI_NDVI的均值代表该年山东省冬小麦整体长势,结果如图4所示。从图4可以看出,山东省冬小麦抽穗期间长势在2001―2015年间整体呈上升趋势,年变化趋势为0.006(r=0.442); 年际间波动较大,如2004和2014年全省小麦抽穗期时长势明显优于其他年份,2004和2014年PI_NDVI的距平值分别为0.214 5和0.209 3,分别比近15 a平均距平值高218.25%和210.53%,这可能主要是因为2004年2月份[19]和2014年2月份[20]山东全省降水偏多,且气温偏高,为冬小麦越冬期之后的生长提供了适宜的生长环境,使小麦长势较常年好。其余年份长势状况差别不明显,比较接近于多年平均状况(PI_NDVI=0.067 4)。
图4
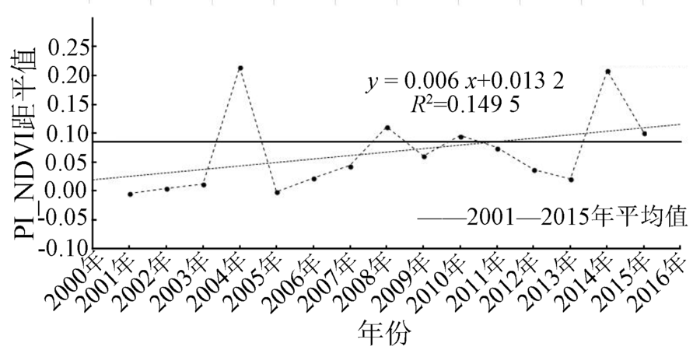
图4
2001—2015年山东省冬小麦抽穗期长势随时间变化趋势
Fig.4
Changes of growth condition of winter wheat during heading dates from 2001 to 2015 in Shandong Province
图5为2001—2015年山东省冬小麦抽穗期长势的空间分布。
图5-1
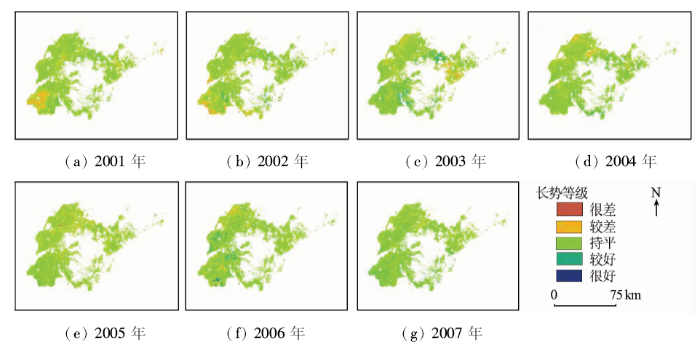
图5-1
2001—2015年山东省冬小麦抽穗期长势空间分布
Fig.5-1
Distribution of growth condition of winter wheat during heading dates from 2001 to 2015 in Shandong Province
图5-2
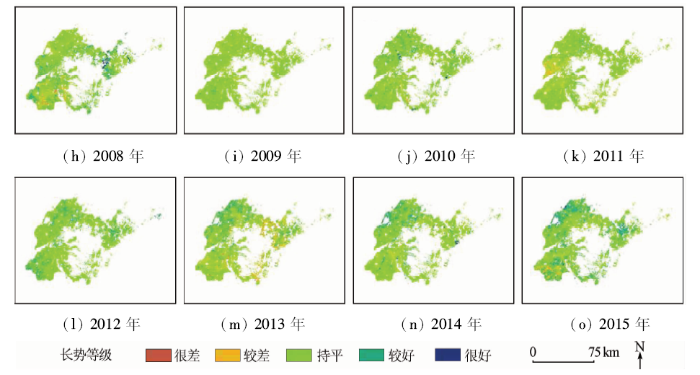
图5-2
2001—2015年山东省冬小麦抽穗期长势空间分布
Fig.5-2
Distribution of growth condition of winter wheat during heading dates from 2001 to 2015 in Shandong Province
从总体来看,近15 a山东省冬小麦长势很差的区域所占比重很小,2002年占比0.32%、2005年占比0.89%、2008年占比0.51%、2010年占比0.69%、2013年占比1.07%。部分区域的小麦长势严重低于多年均值,主要分布在鲁西地区; 但2013年受春季大范围干旱的影响,小麦长势很差的区域范围较广,鲁西、鲁中和鲁南地区均有出现,长势较差的区域占当年冬小麦种植面积的20.36%。但从总体上来看,在研究时间段内,绝大部分区域的冬小麦长势都比较一致,长势与15 a间平均长势持平的区域占63%以上,其中以2009年所占比重最大(达 92.94%),而2013年所占比重仅为63.56%。虽然2015年冬小麦整体长势不如2014年(图4),但2015年冬小麦长势好于多年平均的区域所占比重最大(达27.85%)。
从空间分布来看,鲁西南地区冬小麦长势在整体上比较一致,除2001年和2002年鲁西南部分地区小麦长势较差外,其余年份的小麦长势比较一致; 而鲁西北地区的小麦长势总体上呈上升趋势。这可能是因为鲁西地区是山东省主要农业区,政府在该地区对农田水利设施的投入较多,基本上能保障农田需水; 而鲁东地区冬小麦长势状况在年际间波动较大,这与该地区作物主要靠雨水供养有关,降水较少的年份小麦长势明显差于正常年份。
3.2.2 评价结果验证
冬小麦长势是降水、墒情/干旱状况的综合反映。本文利用已有的相关研究对山东省冬小麦长势评价结果进行验证。据杨丽萍等[21]的研究,2008年4月上旬山东全省平均降水量为15.9 mm,比常年偏多148%; 但鲁西北大部、半岛及鲁中地区平均降水量在10 mm以下,墒情较低。而基于遥感数据和地面实测数据反演结果显示,2008年4月上旬山东省大部分地区墒情适宜,鲁北、鲁中及半岛地区土壤墒情低,出现了一定的干旱,鲁北地区旱情尤为严重,这与本文结果基本一致。另外,刘畅等[22]基于气象观测资料分析指出,2014年春季在山东省冬小麦主产区的鲁西北和鲁南大部分地区降水较常年偏多,且气温较常年较高,日照时数偏多,导致冬小麦生长期进程加快; 段海霞等[23]的研究指出2014年4月上旬山东省出现不同程度的旱情,但到4月下旬旱情已得到缓解,仅鲁中和鲁西的部分地区出现轻微干旱。而本文研究得出2014年山东省冬小麦92%以上区域长势好于多年平均或持平,仅鲁中和鲁西的部分地区呈现长势较差状况,这与刘畅等人基于气候资料分析的结果比较一致。据2012年山东省气候影响评价,2012年初夏山东省农田干旱总面积约为120万hm2,其中重旱面积12.4万hm2。而本文基于MOD09A1数据反演冬小麦长势,得到2012年抽穗期冬小麦比多年平均长势差的面积为149.14万hm2,长势较差区域面积为7.47万hm2。尽管因研究空间尺度、数据源和监测时间以及统计对象的差异导致本文研究结论与已有成果在空间特性上略有差异,但本文结论与前人成果仍具有一定的可比性。因此,本文的监测结果基本上反映了研究区冬小麦的长势状况,具有一定的可靠性。
4 结论
本文基于MODIS 8 d最大值合成反射率数据,在提取冬小麦抽穗期的前提下,分析了2001―2015年间山东省冬小麦抽穗期时长势状况。
1)用加入蓝光波段构建的EVI指数提取的山东省冬小麦抽穗期具有一定的可靠性。冬小麦抽穗期主要集中在4月中、下旬,且从南向北、从西向东逐渐推迟。
2)遥感监测的冬小麦长势是植被绿度和水分综合信息的反映,基于PI_NDVI指数,近15 a间山东省冬小麦长势状况整体呈上升趋势; 但年际间波动较大,且因受自然气候因素和人工田间管理的影响,相同年份、不同区域的冬小麦长势存在显著差异,但大部分区域与多年状况持平。
3)与自然植被不同,冬小麦长势状况受自然气候因素和田间管理综合影响,尤其是近年来山东省加大农田基本设施建设,在平原地区基本上能保证农田需水,因此导致基于自然气候因素分析农田作物农情的精度不高。如何结合田间管理提高农情遥感监测精度,需要进一步深入研究。
参考文献
物候信息在大范围作物长势遥感监测中的应用
[J].
DOI:10.11873/j.issn.1004-0323.2014.2.0278
URL
[本文引用: 1]

大范围的农作物长势监测可以为农业政策的制订和粮食贸易提供决策依据,也是农作物产量估测的必要前提。遥感估算的作物生物量是评价作物长势的主要群体特征指标,在大范围上开展作物长势监测时,不同区域的作物因为所处的物候阶段不同而导致生物量存在差异,这种差异与因作物长势状况差别而产生的差异混合在一起,增加了长势监测结果的不确定性。以中国河南、山东两省为研究区,以MODIS 250m NDVI产品数据为主要数据源,结合改进的CASA模型实现了区域内冬小麦生物量的估算,结合冬小麦生长过程特征进行了典型物候期的监测。在此基础上,分析了扬花期前后物候差异对冬小麦生物量估算的影响,研究其特定物候阶段的变化规律,从而实现了生物量的物候归一化,初步探索了如何消除大区域物候差异对作物长势监测与评估的影响。
Integrating crop phenophase information in large-area crop condition evaluation with remote sensing
[J].
国外农情遥感监测系统现状与启示
[J].
DOI:10.11867/j.issn.1001-8166.2010.10.1003
URL
[本文引用: 1]
大范围的可靠农情信息对粮食市场及相关政策的制定至关重要,是保障区域及全球粮食安全的重要依据,在全球气候变化、人口增长、土地利用/覆盖变化剧烈的背景下,对这一信息的需求也更加迫切。传统农情信息的获取依赖于庞大的调查队伍和大量的调查工作,信息的获取存在成本高、时效性差和结果受主观影响大的缺点。伴随着近30年遥感技术本身及其在农情信息获取领域能力的提升,一些国家与国际组织建设了各自的农情遥感监测系统,并开展了运行化的监测。对美国、欧盟、FAO、加拿大、巴西、阿根廷、俄罗斯、印度等主要的农情遥感监测系统进展进行了详细的介绍,并通过对这些系统的分析得到一些农情监测系统建设的启示。指出作物种植面积估算、单产预测、长势监测、旱情监测是农情遥感监测中最主要的4个主题。在面积估算方面,各个系统在遥感技术不断发展的同时对地面调查的依赖并没有减少,甚至得到了强化,这与遥感降低地面调查的初衷相违背,导致遥感技术在大范围农情监测中的潜力没有得到充分发挥,在单产预测方面,需要发展独立的遥感预测方法。提升遥感的作用是未来一段时间内农情遥感监测系统建设的主要方向。
Review of overseas crop monitoring systems with remote sensing
[J].
作物长势遥感监测指标的改进与比较分析
[J].
DOI:10.3969/j.issn.1002-6819.2011.01.039
URL
[本文引用: 1]
为改善归一化植被指数(NDVI)作为遥感监测作物长势指标的性能,该文分析了归一化植被指数的内在设计缺陷,在不增加额外波段的情况下,以近红外波段和红色波段为基础引入一种新的作物长势遥感监测指标——GRNDVI。通过在像素和区域层次上同其他4种指数进行比较发现:GRNDVI能够改善归一化植被指数在低植被覆盖度时期/地区容易受到作物冠层土壤背景的影响,而在高植被覆盖度时期/地区又容易发生饱和现象的设计缺陷,可以作为遥感监测作物长势过程中替代归一化植被指数的指标。
Improvement and comparative analysis of indices of crop growth condition monitoring by remote sensing
[J].
An evaluation of MODIS 8- and 16-day composite products for monitoring maize green leaf area index
[J].
DOI:10.1016/j.agrformet.2012.03.012
URL
[本文引用: 1]
The seasonal patterns of green leaf area index (GLAI) can be used to assess crop physiological and phenological status, to assess yield potential, and to incorporate in crop simulation models. This study focused on examining the potential capabilities and limitations of satellite data retrieved from the moderate resolution imaging spectroradiometer (MODIS) 8- and 16-day composite products to quantitatively estimate GLAI over maize ( Zea mays L.) fields. Results, based on the nine years of data used in this study, indicated a wide variability of temporal resolution obtained from MODIS 8- and 16-day composite periods and highlighted the importance of information about day of MODIS products pixel composite for monitoring agricultural crops. Due to high maize GLAI temporal variability, the inclusion of day of pixel composite is necessary to decrease substantial uncertainties in estimating GLAI. Results also indicated that maize GLAI can be accurately retrieved from the 250-m resolution MODIS products (MOD13Q1 and MOD09Q1) by a wide dynamic range vegetation index with root mean square error (RMSE) below 0.6002m 2 02m 612 or by the enhanced vegetation index with RMSE below 0.7002m 2 02m 612 .
东北地区主要作物种植结构遥感提取及长势监测
[J].
Remote-sensing based monitoring of planting structure and growth condition of major crops in Northeast China
[J].
农作物长势综合监测——以印度为例
[J].
DOI:10.11834/jrs.20154137
URL
[本文引用: 1]
提出农作物长势综合监测方法,利用卫星遥感得到的NDVI时间序列数据,综合采用实时监测、过程监测和时间序列聚类监测方法,明确不同方法适用的监测尺度及监测目的,对不同范围农作物长势进行监测。改进了Crop Watch全球农情遥感速报系统运行化作物长势监测方法,克服了原有作物长势监测中实时监测方法无法反映相同区域苗情在整个生长过程中的连续变化情况的缺点。实现对相同区域作物长势连续变化的定量描述,可对作物长势进行更准确的判断。利用官方发布的作物单产变幅数据,对单产变幅较大的12个作物主产省区作物长势监测结果的准确性进行判断,结果表明:6个邦的实时监测和聚类监测方法所得结果一致,都符合作物单产变化的实际状况;4个邦的聚类监测方法所得结果对作物长势监测更为准确,更符合该区域作物单产的实际变化;1个邦实时监测结果对作物长势监测比聚类监测方法更为准确;只有1个邦采用两种方法对作物长势的监测存在误差,聚类监测方法在对农作物生长过程的连续监测及空间分布的定量化表述方面,比实时监测更为准确。3种方法可以综合使用,实现业务化运行的农作物长势监测。
Synthetic method for crop condition analysis:A case study in India
[J].
Use of NDVI/AVHRR time-series profiles for soybean crop monitoring in Brazil
[J].
DOI:10.1080/01431161003764112
URL
[本文引用: 1]
In Brazil there is a need for less subjective, more efficient and less expensive methodologies for crop yield forecast. Owing to the continental dimensions of the country, orbital images have been used to estimate the productive potential of crops. In this study, NDVI (Normalized Difference Vegetation Index) time-series, derived from AVHRR/NOAA (Advanced Very High Resolution Radiometer/National Oceanic and Atmospheric Administration) imagery were used for the soybean crop monitoring in a large production region in Brazil in the 2002/2003 and 2003/2004 cropping seasons. NDVI temporal profiles describing the biomass condition of crops throughout the phenological stages were generated in 18 municipalities. Quantitative parameters were measured from the temporal profiles, based on the full time or partial phenological cycle. Linear regressions between the quantitative parameters and the municipal average yields in both seasons have shown that the most significant correlations occurred when the full time period was considered. When considering periods prior to harvest, the correlations showed a tendency to decline. The NDVI monitoring during these two cropping seasons, which presented different weather conditions, could explain a major part of the soybean yield variability at the municipal level. Results showed the potential of the NDVI time-series analysis in generating parameters to be employed by agrometeorological pectral models for soybean yield estimations. The automatic system for temporal profiles generation developed in this study sped up the analysis and can be used for further studies at a regional scale.
Enhanced processing of 1-km spatial resolution fAPAR time series for sugarcane yield forecasting and monitoring
[J].DOI:10.3390/rs5031091 URL [本文引用: 1]
A generalized regression-based model for forecasting winter wheat yields in Kansas and Ukraine using MODIS data
[J].
DOI:10.1016/j.rse.2010.01.010
URL
[本文引用: 1]
Wheat is one of the key cereal crops grown worldwide, providing the primary caloric and nutritional source for millions of people around the world. In order to ensure food security and sound, actionable mitigation strategies and policies for management of food shortages, timely and accurate estimates of global crop production are essential. This study combines a new BRDF-corrected, daily surface reflectance dataset developed from NASA's Moderate resolution Imaging Spectro-radiometer (MODIS) with detailed official crop statistics to develop an empirical, generalized approach to forecast wheat yields. The first step of this study was to develop and evaluate a regression-based model for forecasting winter wheat production in Kansas. This regression-based model was then directly applied to forecast winter wheat production in Ukraine. The forecasts of production in Kansas closely matched the USDA/NASS reported numbers with a 7% error. The same regression model forecast winter wheat production in Ukraine within 10% of the official reported production numbers six weeks prior to harvest. Using new data from MODIS, this method is simple, has limited data requirements, and can provide an indication of winter wheat production shortfalls and surplus prior to harvest in regions where minimal ground data is available.
A simple method for reconstructing a high-quality NDVI time-series data set based on the Savitzky-Golay filter
[J].
DOI:10.1016/j.rse.2004.03.014
URL
[本文引用: 1]
Although the Normalized Difference Vegetation Index (NDVI) time-series data, derived from NOAA/AVHRR, SPOT/VEGETATION, TERRA or AQUA/MODIS, has been successfully used in research regarding global environmental change, residual noise in the NDVI time-series data, even after applying strict pre-processing, impedes further analysis and risks generating erroneous results. Based on the assumptions that NDVI time-series follow annual cycles of growth and decline of vegetation, and that clouds or poor atmospheric conditions usually depress NDVI values, we have developed in the present study a simple but robust method based on the Savitzky olay filter to smooth out noise in NDVI time-series, specifically that caused primarily by cloud contamination and atmospheric variability. Our method was developed to make data approach the upper NDVI envelope and to reflect the changes in NDVI patterns via an iteration process. From the results obtained by applying the newly developed method to a 10-day MVC SPOT VGT-S product, we provide optimized parameters for the new method and compare this technique with the BISE algorithm and Fourier-based fitting method. Our results indicate that the new method is more effective in obtaining high-quality NDVI time-series.
两种NDVI时间序列数据拟合方法比较
[J].
DOI:10.3969/j.issn.1002-6819.2009.11.033
URL
[本文引用: 1]
归一化植被指数(NDVI)时间序列数据拟合目的是降低时序数据的噪声水平,重建高质量的NDVI时序数据,有利于多种参数反演和信息提取。针对国际上普遍应用的两种NDVI时间序列数据拟合方法,即Savitzky-Golay滤波法和非对称性高斯函数拟合法,该文在介绍两种方法基本概念的基础上,利用直接比较法和间接比较法在中国对两种拟合方法进行了比较分析。结果表明,Savitzky—Golay滤波法和非对称性高斯函数拟合法的拟合效果总体上一致,但二者之间还是存在区域差异性,这种区域差异与两种方法的自身特点和中国区域自然条件紧密相关。不同数据拟合方法的比较研究可以弄清每种方法的优缺点和区域适宜性,有助于研究人员针对不同研究目的和研究区域选择适宜的NDVI数据拟合方法,减少遥感数据处理中的误差,提高研究精度。
Comparison of two fitting methods of NDVI time series datasets
[J].
Monitoring vegetation systems in the Great Plains with ERTS
Development of vegetation and soil indices for MODIS-EOS
[J].
DOI:10.1016/0034-4257(94)90018-3
URL
[本文引用: 2]
One of the primary interests of the NASA Earth Observing System (EOS) program is to study the role of vegetation in biospheric processes. Currently, the normalized difference vegetation index (NDVI) is utilized to study and monitor vegetation activity on an operational basis at global scales. Recently developed variants to the NDVI equation, based on improved knowledge of atmosphere, canopy background, and sensor-view geometry, are being considered for use with the EOS Moderate-Resolution Imaging Spectrometer (MODIS) sensor. A set of criteria is established to evaluate their performance with respect to the vegetation signal and atmospheric and soil sources of noise. These include the vegetation signal-to-noise ratio (S/N), % relative error, and vegetation equivalent noise (VEN), which form the basis for the evaluation and comparison of vegetation indices (VIs) across a wide range in vegetation covers. The NDVI variant equations outperformed the NDVI by minimizing atmospheric and/or soil background sources of contamination as well as increasing vegetation signal sensitivity. Preliminary estimates, based on the data sets tested here, indicate an overall level of uncertainty of 0.4 LAI (15% cover) with the use of the soil adjusted and atmospherically resistant vegetation index (SARVI), compared with 0.8 LAI (30% cover) for the NDVI. Eventually, the final evaluation and validation of VIs for MODIS will include a field campaign strategy, simulation studies, and a worldwide establishment of test sites that collectively cover a diverse range of biomes. Lastly, the retrieval of canopy biophysical information from these VIs are discussed.
The influence of soil salinity,growth form,and leaf moisture on the spectral radiance of Spartina alterniflora canopies
[J].ABSTRACT Spectra of Spartina alterniflora were measure under different salinity, growth form and moisture conditions.
Continuous observation of leaf area index at Fluxnet-Canada sites
[J].
DOI:10.1016/j.agrformet.2014.01.016
URL
[本文引用: 2]
Continuous observation of leaf area index (LAI) is needed in order to interpret and model carbon, water and energy fluxes measured at Fluxnet tower sites. Although remote sensing LAI products can be used in regional and global scale modelling with reasonable performance, the site level modelling of ecophysiological processes needs more accurate LAI time series than those provided by global LAI products. Here we present a semi-empirical approach using satellite measured modified soil-adjusted vegetation index (MSAVI) and sparsely sampled LAI time series measurements at 7 Canadian Carbon Program (CCP) flux tower sites to produce continuous observations of site level LAI. The results indicate that accurate and continuous observation of site level LAI time series is possible using a few ground measurements and remotely sensed MSAVI observations. In order for the semi-empirical model to work correctly, the ground LAI measurements should represent all seasons, preferably including extreme values in winter and the peak of growing season.
A feedback based modification of the NDVI to minimize canopy background and atmospheric noise
[J].
DOI:10.1109/36.377946
URL
[本文引用: 1]
ABSTRACT The Normalized Difference Vegetation Index (NDVI) equation has a simple, open loop structure (no feedback), which renders it susceptible to large sources of error and uncertainty over variable atmospheric and canopy background conditions. In this study, a systems analysis approach is used to examine noise sources in existing vegetation indices (VIs) and to develop a stable, modified NDVI (MNDVI) equation. The MNDVI, a closed-loop version of the NDVI, was constructed by adding 1) a soil and atmospheric noise feedback loop, and 2) an atmospheric noise compensation forward loop. The coefficients developed for the MNDVI are physically-based and are empirically related to the expected range of atmospheric and background “boundary” conditions. The MNDVI can be used with data uncorrected for atmosphere, as well as with Rayleigh corrected and atmospherically corrected data. In the field observational and simulated data sets tested, the MNDVI was found to considerably reduce noise for any complex soil and atmospheric situation. The resulting uncertainty, expressed as vegetation equivalent noise, was ±0.11 leaf area index (LAI) units, which was 7 times less than encountered with the NDVI (±0.8 LAI). These results indicate that the MNDVI may be satisfactory in meeting the need for accurate, long term vegetation measurements for the Earth Observing System (EOS) program
距平植被指数在1992年特大干旱监测中的应用
[J].
Application of the anomaly vegetation index to monitoring heavy drought in 1992
[J].
小麦长势与产量信息空间变异性及相关性研究
[D].
Research on Spatial Variability and Relationships of Wheat Growth and Yield
[D].
年冬季(2003年12月—2004年2月)山东天气评述
[J].
Weather review of the winter 2003(Dec.2003-Feb.2004) in Shandong Province
[J].
年冬季(2013年12月—2014年2月)山东天气评述
[J].
DOI:10.3969/j.issn.1005-0582.2014.01.017
URL
[本文引用: 1]
利用2013年12月-2014年2月山东省气温、降水资料以及500hPa 月平均位势高度场、距平场等资料,结合逐日高空环流形势,分析了山东省2013年冬季天气特点、环流特征和主要天气过程,对季内的主要天气及其影响进行了评述。
A review on the weather of Shandong in the winter of 2013(December,2013—February,2014)
[J].
山东省春季土壤墒情遥感监测模型构建
[J].
Construction of remote sensing monitoring model for spring soil moisture in Shandong Province
[J].
年春季(2014年3—5月)山东天气评述
[J].
A review on the weather of Shandong in the spring of 2014 ( from March to May,2014)
[J].
