

0 引言
不透水面(impervious surfaces,IS)是城市中普遍存在的人工地表特征,其表面覆盖着诸如水泥、沥青、混凝土、砖和压实的土地等不渗透性材料[1]。IS隔离地表水向土壤下渗,影响区域地表径流、水文循环、水体质量及生物多样性等生态环境要素[2]。近几十a来,在快速城镇化的影响下,舟山海岛的自然地表被不断增加的不透水硬化地面所代替[3]。地表覆盖硬化加剧了海岛地表径流的活动,人类开发活动产生的污染则随地表径流汇入岛内水库,或随河道排入海中,不仅严重污染了岛上的淡水资源,还使原本就很有限的淡水资源变得更加稀缺。为此,因海岛土地利用方式改变而引发的海岛淡水资源环境安全问题受到了广泛关注。在这样的背景下,定量化研究舟山群岛的IS变化动态,对分析海岛城市淡水污染机制及其可持续发展具有重要意义。
遥感技术的快速发展使得获取不同时空尺度的IS变化信息成为可能。Carlson等[4]运用AVHRR和Landsat TM影像,根据植被覆盖度反比关系,获取了美国宾夕法尼亚州切斯特地区1987―1996年间的IS变化信息; Xian等[5]运用Landsat TM/ETM+数据及航空数字影像,通过回归决策树方法提取了美国佛罗里达州坦帕湾流域1991―2002年的IS动态变化信息; Powell等[6]基于1972―2006年获取的Landsat数据集,运用光谱混合分析法,估算了美国华盛顿地区的IS变化状况。徐涵秋[7]基于Landsat ETM+及ASTER影像数据提出一种归一化差值IS指数,估测了我国福州市的IS动态变化; Zhang等[8]基于1998―2013年获取的Landsat影像数据集,综合地表温度指数、生物物理组合指数及归一化植被指数与IS覆盖度的线性关系,分析了近25 a我国珠江流域的IS变化。此外,也有研究者综合使用WorldView-2等高空间分辨率影像及LiDAR数据,采用面向对象、神经网络及决策树方法研究了城市区域的IS动态变化[9,10,11]。总体上,估算IS的方法大致可分为4类: 光谱混合分析法、回归法、分类法及指数法[12]。上述研究的IS主要是内陆地区(包括城市、内陆河流域等),对海岛而言,除林地、耕地、建筑区、农村居住区及河流之外,还有盐田、滩涂、养殖区、水库及坑塘等,这些地物的光谱特性在水的影响下极易与IS混淆,给海岛地区的IS变化分析造成了一定困难。光谱混合分析法在处理混合像元问题上具有一定优势,但不适用于大范围、地物复杂区域的IS提取,因为在这种情况下不易获取代表纯净IS端元的光谱特征[13]。分类法是较为成熟的IS提取方法,可操作性强,但一般需要解译人员结合野外调查数据建立完善的IS解译标志。指数法可提出能反映IS分布与其他地物具有较高分离度的特征指数,计算相对简单、高效,但需要自定义IS分割阈值,且IS指数不能与真实的IS含量相关联,难以进行绝对量化分析[12]。回归法是通过地物光谱特征和IS的比例关系建立回归函数,进而估计区域的IS分布,常应用在地物相对复杂的IS提取中。植被覆盖度反比关系法是回归法的一种,其基本原理是根据城市建成区中植被覆盖度与不透水面覆盖度的强负相关关系获取IS信息,植被覆盖度可由归一化植被指数或者缨帽变化的绿度分类获得; 该方法简单易行,避开了混合像元的问题,在植被、生态环境监测和水文气候模拟等方面应用广泛[1]。国内已有不少研究者运用遥感及地理信息技术对我国长岛[14]、崇明岛[15]、舟山群岛[3]和厦门岛[16]的土地利用变化进行了分析,但是较少关注并系统分析群岛城市的IS动态变化信息[17]。因此,本文的研究目标是在已有研究成果基础上,基于植被覆盖度反比关系法提取舟山群岛1990─2011年近20 a间的IS信息,包括IS面积变化、新增IS的空间分布及高程分布变化信息,并分析其影响因素。
1 研究区概况
选取舟山本岛及其附近岛屿为研究区。舟山群岛附近岛屿包括金塘岛、秀山岛、册子岛、长白岛、长峙岛、大猫岛、岙山岛、盘峙岛、小干岛和鲁家峙等,行政上涉及舟山市的定海区、普陀区及岱山县,岛陆总面积约703.34 km2(图1)。
图1
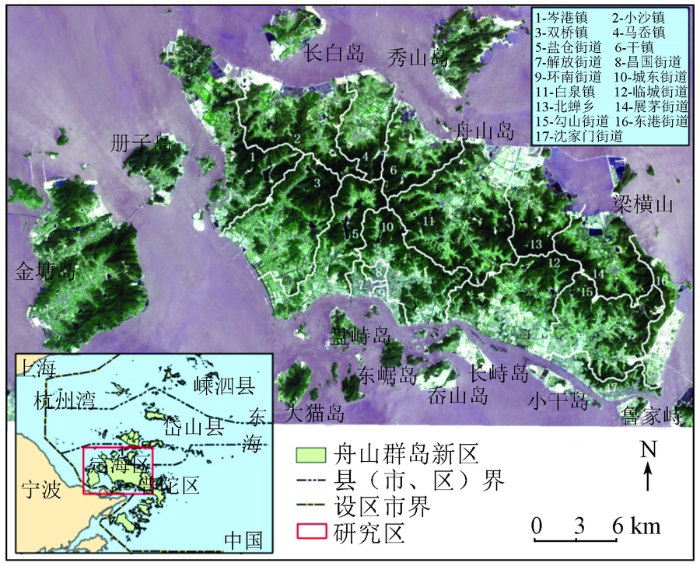
研究区内各主要海岛的基本信息见表1。
表1 研究区主要海岛基本信息
Tab.1
| 海岛名称 | 所属行政区 | 岛陆面积/km2 | 距本岛距离/km | 人口数量/万人 | 跨海大桥(是否连通舟山本岛) | 功能定位 |
|---|---|---|---|---|---|---|
| 舟山岛 | 定海/普陀区 | 503.84 | ― | 4.70 | — | 综合开发 |
| 金塘岛 | 定海区 | 81.11 | 6.26 | 4.20 | 是 | 综合开发 |
| 秀山岛 | 岱山县 | 25.47 | 2.50 | 0.83 | 否 | 海洋旅游 |
| 册子岛 | 定海区 | 15.01 | 1.88 | 0.40 | 是 | 港口物流 |
| 长白岛 | 定海区 | 13.32 | 1.10 | 0.52 | 否 | 城区拓展 |
| 长峙岛 | 定海区 | 7.51 | 0.36 | 0.47 | 是 | 城区拓展/海洋科研 |
| 大猫岛 | 定海区 | 6.60 | 3.01 | 0.14 | 否 | 港口物流 |
| 岙山岛 | 定海区 | 5.15 | 2.60 | 0.19 | 是 | 港口物流 |
| 盘峙岛 | 定海区 | 4.23 | 0.87 | 0.18 | 否 | 修造船舶基地 |
| 小干岛 | 普陀区 | 5.24 | 0.33 | 0.16 | 是 | 临港工业 |
| 鲁家峙 | 普陀区 | 3.77 | 0.19 | 0.52 | 是 | 城区拓展 |
研究区属北亚热带南缘海洋性季风气候区,年均降雨量为1 300~1 500 mm; 森林覆盖类型主要有针叶林、常绿阔叶林及落叶阔叶林。舟山市是海岛城市,淡水资源缺乏,海岛生态系统脆弱,岛屿众多(故习惯称“舟山群岛”),但面积普遍狭小,且以丘陵山地为主,可利用土地资源有限。1988年以来,舟山市的港口海运、临港工业、海岛旅游、海洋渔业等行业发展迅速。在舟山市海洋经济快速发展的同时,经济增长与海岛土地资源、淡水资源环境安全之间的矛盾也日渐突出。1990―2011年间,舟山群岛的IS发生了较大变化。
2 数据与方法
2.1 数据源及预处理
获取研究区3期中等空间分辨率卫星遥感数据: 1990年6月11日Landsat5 TM、2000年6月14日Landsat7 ETM+和2011年5月20日Landsat5 TM,影像空间分辨率均为30 m; 3期高空间分辨率航空/卫星数据: 1990年12月1 m空间分辨率全色航空影像、2002年10月1 m空间分辨率多光谱航空影像和2011年4月20日2.5 m空间分辨率SPOT5多光谱融合影像。以上数据研究区内都无云遮挡,影像清晰,质量均较好。运用ENVI EX5.1 软件对TM/ETM+影像进行辐射定标处理,将各时相影像的DN值校正为星上反射率。利用ERDAS IMAGINE2013软件的AutoSync模块对多时相遥感影像进行几何配准,影像重采样方式为最邻近像元法,配准的均方根误差控制在1个像元以内。
本文所用的其他数据包括: 2005年舟山市土地利用调查数据、2011年研究区行政区划矢量图、1980年研究区30 m空间分辨率数字高程模型栅格图及1989―2011年间舟山市统计年鉴等。为便于遥感影像、矢量数据及专题图等之间进行空间叠置分析,将所有数据的投影方式统一转换为GCS_WGS_1984横轴墨卡托(Transverse Mercator)投影。
2.2 IS提取
2.2.1 城市建成区确定
运用分类、掩模的方法获取建成区信息[17]。首先,将研究区内的用地类型划分为林地、旱地、水田、盐田、养殖水面、河流水库水面、滩涂、高密度建筑用地和低密度建筑用地(其中,高密度建筑用地是指城市、建制镇、独立工矿用地、港口码头用地、公路用地及特殊用地等IS覆盖比例较高的用地类型; 低密度建筑用地是指IS覆盖比例相对较低的居民地及水工建筑用地),以2005年的实测土地利用调查数据为基础,通过ENVI EX5.1 软件中的最大似然监督分类法分别提取1990年、2000年和2011年的土地利用/覆盖信息,分类结果如图2所示; 然后,利用ArcGIS10.3软件分别从上述3景Landsat影像中通过掩模运算去掉除高、低密度建筑用地之外的其他地类,获得各个时期的城市建成区影像。
图2
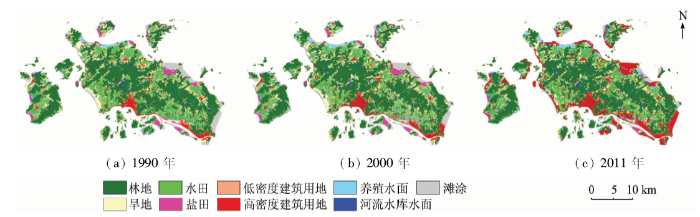
图2
1990―2011年舟山群岛土地利用/覆盖分类
Fig.2
Land use/land cover map of Zhoushan Islands from 1990 to 2011
2.2.2 植被覆盖度计算
Fr≈N*2 , (1)
N*=
NDVI=
式中: Fr为植被覆盖度; N*为调整后的植被指数; NDVIs为纯裸土像元; NDVIv为纯植被像元; ρr为TM/ETM+影像红光波段(630~690 nm)的反射率; ρnir为近红外波段(760~900 nm)的反射率。
对于多数裸露地表,NDVIs一般不随时间改变,理论上接近0; 但因受地表温度、粗糙度、土壤类型、土壤颜色和土地利用程度等条件影响,变化范围一般在-0.1~0.2之间[19]。受植被类型不同等因素影响,NDVIv也会随时间和空间而改变。因此,应根据实际情况对NDVIs和NDVIv这2个参数做出适当的判断。本文通过把每一时相的NDVI图叠置到相应时期的分类图上,分别提取与林地、旱地对应的NDVI像元,作为纯植被像元和纯裸土像元。
2.2.3 IS覆盖度估算及精度验证
利用城市建成区内IS覆盖度(impervious surface area,ISA)与植被覆盖度之间的强负相关关系,定义ISA为单位面积地表中IS面积所占百分比,无量纲。其计算方法为
ISA=
式中: ISA为单个像素中的ISA; 下标dev表示城市建成区。
从高空间分辨率影像中随机选择样本,通过目视解译和最大似然分类法对样本进行分类,包括不透水面、草地、林地、农田、裸地、水体、阴影及滩涂。基于高空间分辨率数据分类结果,统计落在30 m×30 m网格内的IS像元数,得到30 m空间分辨率的ISA。以高空间分辨率数据计算的ISA为参考值,以Landsat影像提取的ISA为估计值,选取平均相对误差(average relative error,MRE)、相关系数(R)为ISA提取的精度评价标准[20],即
MRE=
$R=\frac{\sum^{n}_{i=1}[ISA_{real}(i)-\overline{ISA_{real}}][ISA_{estimated}(i)-\overline{ISA_{real}]}}{\sqrt{\sum^n_{i=1}[ISA_{real}(i)-\overline{ISA_{real}}]^2}\sqrt{\sum^n_{i=1}[ISA_{estimated}(i)-\overline{ISA_{estimated}}]^2}}$, (6)
式中: ISAreal(i)和ISAestimated(i)分别为样本i的ISA的参考值和估计值;$\overline{ISA_{real}}$和$\overline{ISA_{estimated}}$分别为所有样本ISA参考值和估计值的均值; n为精度评价样本个数。
3 结果与分析
3.1 IS面积变化
1990―2011年间舟山群岛ISA分布如图3所示。
图3
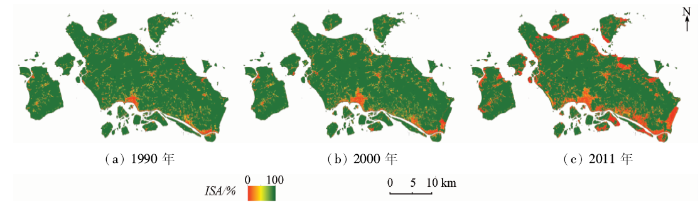
图3
1990―2011年舟山本岛及其附近岛屿ISA分布
Fig.3
ISA maps of Zhoushan Islands from 1990 to 2011
ISA提取结果的精度评价见表2。
表2 ISA提取结果的精度评价
Tab.2
| 年份 | 统计指标 | |
|---|---|---|
| MRE/% | R | |
| 1990年 | 15.05 | 0.671 |
| 2000年 | 11.95 | 0.605 |
| 2011年 | 8.00 | 0.733 |
2000年的ISA提取精度相对较低,主要是因所用的高空间分辨率参考数据与对应的ISA估算数据获取时间不一致引起的。此外,裸土、滩涂及细小水体的混入,也会影响ISA估算值,进而影响样本点的精度对比。总体上,R>0.6,MRE控制在15%以内,表明本文方法基本能较好地估算研究区近20 a的IS变化信息。1990—2011年间研究区IS面积变化见图4。
图4-1
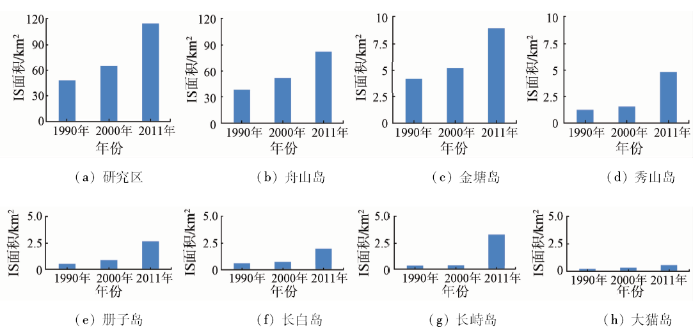
图4-1
1990―2011年研究区及各主要岛屿IS面积变化
Fig.4-1
Changes of IS area in Zhoushan Islands from 1990 to 2011
图4-2
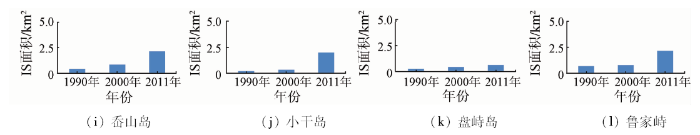
图4-2
1990―2011年研究区及各主要岛屿IS面积变化
Fig.4-2
Changes of IS area in Zhoushan Islands from 1990 to 2011
由图4可知,IS面积1990年为47.96 km2(占研究区总面积的6.28%),2000年为64.98 km2(占比9.24%),2011年为114.40 km2(占比16.27%)。1990―2011年间,研究区IS面积呈快速增加趋势。2000―2011年IS面积的增加明显大于1990―2000年,平均增幅为4.49 km2/a。
对比各主要岛屿的IS面积变化,发现呈明显的异质性。在过去20 a中,小干岛和长峙岛的IS面积变化最大(增加约8倍),其次是册子岛和岙山岛(增加约4倍),秀山岛、长白岛和鲁家峙增加约2~3倍,其他岛(大猫岛、盘峙岛、舟山岛及金塘岛)的IS面积增加最少(约1倍)。其中,1990―2000年间,岙山岛和册子岛的IS面积变化最大(增加近1倍); 长峙岛和鲁家峙的IS面积增加最少(约10%); 2000―2011年间,长峙岛和小干岛的IS面积增幅最大(约5~7倍),而舟山岛和盘峙岛的IS面积增幅最小(约40%)。
3.2 新增IS空间分布变化
以1990年研究区的IS分布为参考,1990―2000年和2000―2011年2段时期内新增IS的空间分布如图5所示。从总体来看,2段时期中新增的IS沿着各岛陆周边外围分布。1990年的IS区域主要分布在舟山本岛的定海、普陀2个老城区(即解放街道、昌国街道、环南街道与沈家门街道),以及一些建制镇(如展茅镇、白泉镇、马岙镇、岑港镇及金塘镇等)。1990―2000年间,舟山本岛的定海老城区内及外围城东街道和普陀区的东港街道的IS明显增加,其他建制镇及其附近岛屿的IS面积也有不同程度的扩张。2000―2011年间,舟山本岛定海区的IS分布由中心城区向东南方向的临城街道扩展,并逐渐与普陀区连成一片,而舟山本岛其他地区以及秀山岛、长白岛、小干岛、册子岛、鲁家峙及金塘岛的周边沿岸区域也增加了大片IS区域。
图5
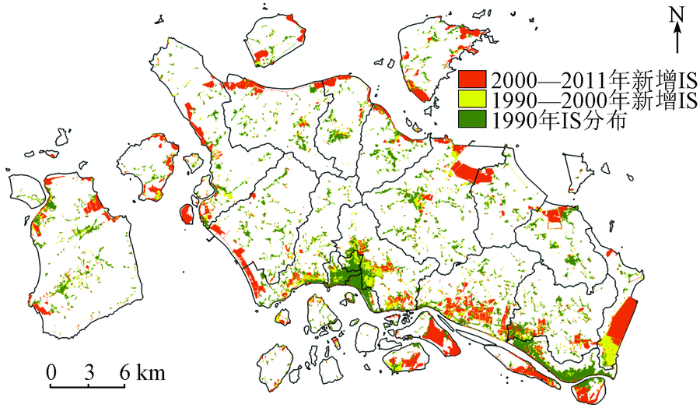
图5
不同时期新增IS的空间分布
Fig.5
Spatial distribution of increased IS in different time periods
3.3 新增IS高程分布变化
将获取的1990―2000年和2000―2011年2段时期内的新增IS空间分布分别叠置在1980年的研究区数字高程模型栅格图上,得到不同时期新增IS处的高程变化情况。
图6
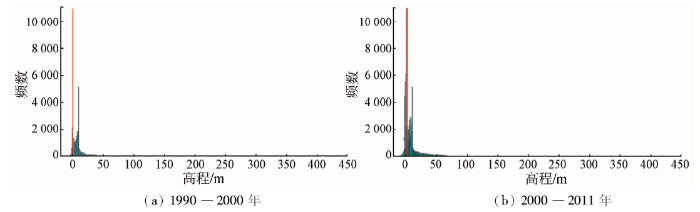
图6
不同时期新增IS处高程变化
Fig.6
Changes of height for new increased IS during different periods
表3 不同时期新增IS区域的高程
Tab.3
| 时期 | 高程值≤0 | 高程值>0 | ||||||
|---|---|---|---|---|---|---|---|---|
| 最小值 | 最大值 | 平均值 | 标准差 | 最小值 | 最大值 | 平均值 | 标准差 | |
| 1990—2000年 | -18.84 | 0 | -1.21 | 1.96 | 0 | 458.80 | 13.37 | 17.86 |
| 2000―2011年 | -20.88 | 0 | -1.59 | 1.98 | 0 | 456.78 | 12.97 | 23.55 |
4 讨论
1)影响IS动态变化的地形因素。1990―2011年间,舟山本岛及其附近岛屿的IS呈快速增加趋势,新增IS多分布在舟山本岛老城区周边、本岛沿岸及附近岛屿(图3―图5)。研究区属海岛和丘陵地貌,尤其在舟山本岛内部分布有大片的丘陵和山地,这样的海岛地形不利于舟山市城区的快速发展。2000年前新增的IS多分布在舟山本岛南部的定海及普陀老城区周边,且增加的IS面积相对较小; 而附近岛屿(如鲁家峙、小干岛和长峙岛等)离舟山市城区近,且分布有大量滩涂平原,为舟山市临港工业的快速发展提供了有利的土地基础,因此2000―2011年间附近岛屿的IS面积增加迅速。可见,地形是研究区IS动态变化的主要影响因素之一。
图7
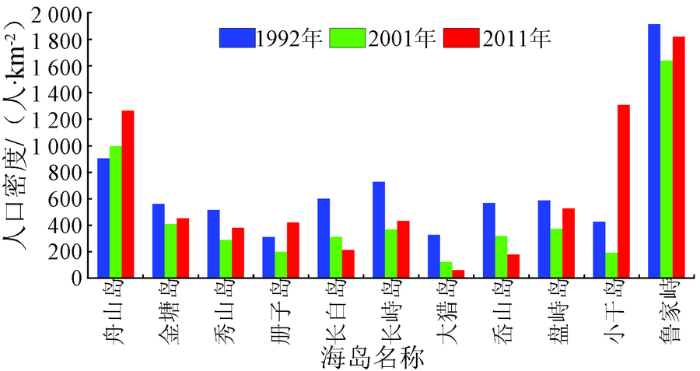
图7
不同时期各岛屿的人口密度变化
Fig.7
Changes of population density in Zhoushan Islands during different periods
因此,“大岛建小岛迁”政策在一定程度上促使舟山本岛城区IS面积增加。2005年起,舟山政府开始实行“以港兴市”的发展政策,使靠近岸线地区兴建了很多港口、码头和工矿企业,故这期间临港工业发展迅猛。图7也显示,2001―2011年多数岛屿的人口密度呈增加趋势。无疑,“以港兴市”的政策促使这一时期舟山本岛沿岸及附近岛屿有大片IS区域增加(图5)。此外,根据《舟山市滩涂围垦规划》,预计到2020年,将新建促淤围垦项目30处,围垦面积为24.62万亩①(① 1亩≈0.066 7 hm2),促淤面积为3.46万亩。在快速城镇化压力下,舟山市通过围垦工程逐渐向深水区“要地”,以增加居住空间、发展海洋临港工业。由图6也可以看出,2000―2011年间新增IS的高程均值明显降低。因此,政策是影响研究区IS时空格局动态变化的又一重要因素。
5 结论
1)1990―2011年间,研究区IS面积快速增加,由1990年的47.96 km2(占研究区总面积的比例为6.28%)增至2011年的114.40 km2(占比为16.27%)。其中,2000―2011年的IS增加最快,平均增幅为4.49 km2/a。研究区各主要岛屿的IS面积变化呈明显的异质性: 小干岛、长峙岛、册子岛及岙山岛的IS面积变化最大(增加约4~8倍); 其次是秀山岛、长白岛和鲁家峙(增加约2倍); 大猫岛、盘峙岛、舟山岛及金塘岛增加的最少(约1倍)。
2)1990―2000年间,新增IS主要分布在舟山本岛定海老城区与城东街道、普陀区的东港街道及一些建制镇。2000―2011年,舟山本岛定海区的IS分布由中心城区向东南方向的临城街道扩展,并逐渐与普陀区连成一片; 舟山本岛其他地区以及秀山岛、长白岛、小干岛、册子岛、鲁家峙及金塘岛的沿岸地带有大量IS区域增加。
3)与1990―2000年相比,2000―2011年间有更多的新增IS分布在高程值<0的区域,或在很大高程处,前者发生在滩涂围垦区,后者主要分布在山上的工矿用地中。从总体上来看,近20 a来研究区新增IS明显向沿海低海拔地区扩张。
4)对IS变化的影响因素进行讨论分析,发现地形、政策、功能定位及交通(跨海大桥)等因素是影响研究区IS时空格局动态变化的主要驱动力。
参考文献
Remote sensing of impervious surfaces in the urban areas:Requirements,methods,and trends
[J].
DOI:10.1016/j.rse.2011.02.030
URL
[本文引用: 2]

78 Comprehensive review on methods to extract, estimate and map impervious surfaces. 78 Discussions on the mapping requirements of urban impervious surfaces. 78 Problems and prospects in remote sensing of impervious surfaces in the urban areas. 78 Impact of new sensing systems on the models and algorithms in urban remote sensing. 78 First to discuss about research traditions in urban remote sensing.
不透水表面遥感监测及其应用研究进展
[J].
DOI:10.11820/dlkxjz.2010.09.018
URL
[本文引用: 1]
不透水表面是城市中一种人工地表特征,隔离地表水下渗到土壤,割断了城市地表与地下水文联系,主要由城市中的道路、停车场、广场及屋顶等建筑物组成。不透水表面影响城市的地表径流、水文循环、水体质量、局部气候、生物多样性等生态环境要素,是监测城市生态系统及环境变化的重要指标,也是许多生态环境模型的主要输入参数。本文归纳了不透水表面提取技术及其对城市自然生态环境影响的研究进展。从遥感提取技术方面看,亚像元分解等新的运算方法提取中尺度分辨率遥感影像的不透水表面,将是未来遥感技术应用到城市自然资源环境研究的趋势。在数据源方面,中分辨率(10~100m)与高分辨率(0.3~5m)遥感数据为不透水表面指数在大范围、多时段的获取提供了可靠基础。在不透水表面指数应用方面,城市地表覆被监测与模拟可以为城市未来发展及规划管理提供基础。鉴于不透水表面决定了城市地区的地表水文循环、非点源污染、能量分布、植被变化及生物多样性等生态环境要素,因此搭起深入理解城市景观格局与生态过程相互关系的桥梁,是研究城市化的生态环境效应的最佳切入点。
Remote sensing of impervious surface and its applications:A review
[J].
Land-cover reconstruction and change analysis using multi-source remotely sensed imageries in Zhoushan Islands since 1970
[J].
DOI:10.2112/JCOASTRES-D-13-00027.1
URL
[本文引用: 2]
Islands are hotspot areas with intensive interactions between land and ocean, and they are also the most vulnerable places to human activities and environmental change. As the frontier zone of oceanic economic development, coastal regions of China have undergone enhanced changes in land-cover change during recent decades. This study was conducted to investigate how land cover in Zhoushan Island and its surrounding islands, which are typical islands of China, has changed since the economic reform by using multisource remotely sensed imageries. The earliest land cover in 1970, 1976, and 1980 was interpreted and digitalized from CORONA and KH-9 photographs, respectively. For the period of 1986-2000, TM (Thematic Mapper) and ETM (Enhanced Thematic Mapper) imageries were classified to build land-cover maps with the supervised classification method. The most recent land-cover data in 2006 and 2011 were generated by inventory land-use vector map and SPOT5 imageries. The reconstructed land-cover time series indicate that Zhoushan Islands have involved substantial land-cover change since 1970. The arable land has changed into builtup types, mainly, and rate of change reached its peak in 2000, while the spatial distribution of transition was not uniform. Nevertheless, water bodies and woodlands have been well preserved during the past 40 years. During the urbanization process, the tidal zone of these islands shrank sharply, and some of them turned to built-up land-cover directly.
The impact of land use-land cover changes due to urbanization on surface microclimate and hydrology:A satellite perspective
[J].
DOI:10.1016/S0921-8181(00)00021-7
URL
[本文引用: 2]
Vegetation cover, surface moisture availability (wetness) and radiant surface temperature constitute microclimatic variables derivable from multi-spectral satellite imagery. In addition, fraction impervious surface cover and urban-induced surface runoff (RO) are obtainable from such imagery when it is combined with a conventional image classification. Using AVHRR and Landsat TM data, we illustrate how these parameters respond to urbanization with a case study of Chester County, PA a region that has undergone rapid urban development over the past decade. Specific factors affecting the change in the surface microclimatic variables are discussed. Based on a statistical analysis of the Chester County data, future values of these microclimatic parameters can be predicted, given the characteristics of the initial land surface and an estimate of the change in vegetation and urban coverage.
Assessments of urban growth in the Tampa Bay watershed using remote sensing data
[J].
DOI:10.1016/j.rse.2005.04.017
URL
[本文引用: 1]
Urban development has expanded rapidly in the Tampa Bay area of west-central Florida over the past century. A major effect associated with this population trend is transformation of the landscape from natural cover types to increasingly impervious urban land. This research utilizes an innovative approach for mapping urban extent and its changes through determining impervious surfaces from Landsat satellite remote sensing data. By 2002, areas with subpixel impervious surface greater than 10% accounted for approximately 1800 km 2, or 27 percent of the total watershed area. The impervious surface area increases approximately three-fold from 1991 to 2002. The resulting imperviousness data are used with a defined suite of geospatial data sets to simulate historical urban development and predict future urban and suburban extent, density, and growth patterns using SLEUTH model. Also examined is the increasingly important influence that urbanization and its associated imperviousness extent have on the individual drainage basins of the Tampa Bay watershed.
Sub-pixel mapping of urban land cover using multiple endmember spectral mixture analysis:Manaus,Brazil
[J].
DOI:10.1016/j.rse.2006.09.005
URL
[本文引用: 1]
The spatial and spectral variability of urban environments present fundamental challenges to deriving accurate remote sensing products for urban areas. Multiple endmember spectral mixture analysis (MESMA) is a technique that potentially addresses both challenges. MESMA models spectra as the linear sum of spectrally pure endmembers that vary on a per-pixel basis. Spatial variability is addressed by mapping sub-pixel components of land cover as a combination of endmembers. Spectral variability is addressed by allowing the number and type of endmembers to vary from pixel to pixel. This paper presents an application of MESMA to map the physical components of urban land cover for the city of Manaus, Brazil, using Landsat Enhanced Thematic Mapper (ETM+) imagery. We present a methodology to build a regionally specific spectral library of urban materials based on generalized categories of urban land-cover components: vegetation, impervious surfaces, soil, and water. Using this library, we applied MESMA to generate a total of 1137 two-, three-, and four-endmember models for each pixel; the model with the lowest root-mean-squared (RMS) error and lowest complexity was selected on a per-pixel basis. Almost 97% of the pixels within the image were modeled within the 2.5% RMS error constraint. The modeled fractions were used to generate continuous maps of the per-pixel abundance of each generalized land-cover component. We provide an example to demonstrate that land-cover components have the potential to characterize trajectories of physical landscape change as urban neighborhoods develop through time. Accuracy of land-cover fractions was assessed using high-resolution, geocoded images mosaicked from digital aerial videography. Modeled vegetation and impervious fractions corresponded well with the reference fractions. Modeled soil fractions did not correspond as closely with the reference fractions, in part due to limitations of the reference data. This work demonstrates the potential of moderate-resolution, multispectral imagery to map and monitor the evolution of the physical urban environment.
近30 a来福州盆地中心的城市扩张进程
[J].位于福州盆地中心的福州市在城市化进程的推动下,城市空间快速扩展。利用多时相遥感影像和IBI建筑用地指数获得的建筑用地信息表明,福州市建成区在1976~2006年的30 a间面积增加了105 km2,增幅达到3.2倍。由于金山、快安等新城区的形成和马尾区的扩展,整个福州城区从西到东几乎连成一片,城市扩展经历了先慢后快,先北、后东、西的扩展历程。研究发现,福州城市的空间扩展并不属于工业主导型,而是第三产业推动型。城市空间的快速扩展已给福州带来了一定的环境资源问题,其中最突出的就是城市热岛效应与城市建筑用地总量控制问题。
Urban expansion process in the center of the Fuzhou Basin,Southeast China in 1976―2006
[J].
Annual dynamics of impervious surface in the Pearl River Delta,China,from 1988 to 2013,using time series Landsat imagery
[J].
DOI:10.1016/j.isprsjprs.2016.01.003
URL
[本文引用: 1]
Information on impervious surface distribution and dynamics is useful for understanding urbanization and its impacts on hydrological cycle, water management, surface energy balances, urban heat island, and biodiversity. Numerous methods have been developed and successfully applied to estimate impervious surfaces. Previous methods of impervious surface estimation mainly focused on the spectral differences between impervious surfaces and other land covers. Moreover, the accuracy of estimation from single or multi-temporal images was often limited by the mixed pixel problem in coarse- or medium-resolution imagery or by the intra-class spectral variability problem in high resolution imagery. Time series satellite imagery provides potential to resolve the above problems as well as the spectral confusion with similar surface characteristics due to phenological change, inter-annual climatic variability, and long-term changes of vegetation. Since Landsat time series has a long record with an effective spatial resolution, this study aimed at estimating and mapping impervious surfaces by analyzing temporal spectral differences between impervious and pervious surfaces that were extracted from dense time series Landsat imagery. Specifically, this study developed an efficient method to extract annual impervious surfaces from time series Landsat data and applied it to the Pearl River Delta, southern China, from 1988 to 2013. The annual classification accuracy yielded from 71% to 91% for all classes, while the mapping accuracy of impervious surfaces ranged from 80.5% to 94.5%. Furthermore, it is found that the use of more than 50% of Scan Line Corrector (SLC)-off images after 2003 did not substantially reduced annual classification accuracy, which ranged from 78% to 91%. It is also worthy to note that more than 80% of classification accuracies were achieved in both 2002 and 2010 despite of more than 40% of cloud cover detected in these two years. These results suggested that the proposed method was effective and efficient in mapping impervious surfaces and detecting impervious surface changes by using temporal spectral differences from dense time series Landsat imagery. The value of full sampling was revealed for enhancing temporal resolution and identifying temporal differences between impervious and pervious surfaces in time series analysis.
Impervious surface quantification using a synjournal of artificial immune networks and decision/regression trees from multi-sensor data
[J].
DOI:10.1016/j.rse.2011.06.024
URL
[本文引用: 1]
Impervious surface quantification is important for many planning and management applications because of the impacts that impervious surfaces have on a range of environmental resources such as groundwater. This research proposes an integrated method to quantify impervious surfaces at multiple spatial scales via a synthesis of several machine learning approaches. In this study, we 1) proposed a hierarchical classification method to detect impervious surfaces through a fusion of optimized artificial immune networks (OPTINC) and decision trees at high spatial resolution, 2) evaluated the method using multi-sensor data (i.e., high spatial resolution WorldView-2 and LiDAR data) to map impervious surfaces, 3) tested the applicability of the binary impervious surface maps to quantify sub-pixel imperviousness from Landsat TM data of a larger region using regression trees at moderate spatial resolution, and 4) examined the model sensitivity of regression trees to training sample size for impervious surface quantification. OPTINC and decision trees successfully identified impervious surfaces at high resolution (overall accuracy02>0290%). The regression tree predicted imperviousness from the TM data with a moderate success ( R 2 02=020.64 and MAE 02=0214.2%). Although the regression tree appeared robust when training sample size was sufficiently large, it was not stable with small sample size (e.g., <02100).
Use of Iidar-derived NDTI and intensity for rule-based object-oriented extraction of building footprints
[J].
DOI:10.1080/01431161.2013.871394
URL
[本文引用: 1]
Buildings play an essential role in urban intra-construction, planning, and climate. The precise knowledge of building footprints not only serves as a primary source for interpreting complex urban characteristics, but also provides regional planners with more realistic and multidimensional scenarios for urban management. The recently developed airborne light detection and ranging (lidar) technology provides a very promising alternative for building-footprint measurement. In this study, lidar intensity data, a normalized digital surface model (nDSM) of the first and last returns, and the normalized difference tree index (NDTI) derived from the two returns are used to extract building footprints using rule-based object-oriented classification. The study area is chosen in London, Ontario, based on the various types of buildings surrounded by trees. An integrated segmentation approach and a hierarchical rule-based classification strategy are proposed during the process. The results indicate that the proposed object-based classification is a very effective semi-automatic method for building-footprint extraction, with buildings and trees successfully separated. An overall accuracy of 94.0% and a commission error of 6.3% with a kappa value of 0.84 are achieved. Lidar-derived NDTI and intensity data are of great importance in object-based building extraction, and the kappa value of the proposed method is double that of the object-based method without NDTI or intensity.
Urban land cover classification using airborne LiDAR data:A review
[J].
DOI:10.1016/j.rse.2014.11.001
URL
[本文引用: 1]
61We review the airborne LiDAR technology to aid in urban land cover classification.61The use of LiDAR height, intensity, waveform, and multi-sensor data is summarized.61The LiDAR data classification and radiometric calibration techniques are identified.61Five other relevant urban environmental applications are presented.61We finally point out five forthcoming research areas that require further efforts.
遥感技术在不透水层提取中的应用与展望
[J].
Review of impervious surface mapping using remote sensing technology and its application
[J].
Methods to extract impervious surface areas from satellite images
[J].
DOI:10.1080/17538947.2013.866173
URL
[本文引用: 1]
Impervious surface area (ISA) is an important parameter for many environmental or socioeconomic relevant studies. The unique characteristics of remote sensing data made it the primary data source for ISA mapping at various scales. This paper summarizes general ISA mapping procedure and major techniques and discusses impacts of scale issues on selection of remote sensing data and corresponding algorithms. Previous studies have indicated that ISA mapping remains a challenge, especially in urban rural frontiers and in covering a large area. Effectively employing rich spatial information in high spatial resolution imagery through texture and object-based methods is valuable. Data fusion of multi-resolution images and spectral mixture analysis are common approaches to reduce the mixed pixel problem in medium spatial resolution images such as Landsat. Coarse spatial resolution images such as MODIS and DMSP-OLS are valuable for national and global ISA mapping but more research is needed to effectively integrate multisource/scale data for improving mapping performance. Development of an optimal procedure corresponding to specific study areas and purposes is required to generate accurate ISA mapping results.
中国海岛.沙洲. 瑚礁遥感监测应用中的典型问题研究
[D].
Research on Typical Questions of China Islands,Sand Banks and Coral Reefs Remote Sensing Monitoring Application
[D].
An ecosystem service value assessment of land-use change on Chongming Island,China
[J].
DOI:10.1016/j.landusepol.2003.10.003
URL
[本文引用: 1]
Chongming Island is the world's largest alluvial island. Its coastal wetland and tidal flats provide many important ecological services including buffers against tidal surges and staging areas for migratory birds. Due to its extraordinary resources, scenic qualities, and its proximity to the city of Shanghai 45 km away, the island is also an attractive tourist destination, and it supports important agricultural and fisheries economies. Yet, large-scale land reclamation projects that are severely affecting these ecosystems have been implemented. In this paper, we report an investigation of changes in land use and ecosystem services on Dongtan (East Beach of Chongming Island) between 1990 and 2000. We used three LANDSAT TM and/or ETM data sets to estimate changes in the size of five land-cover/land-use categories, and we also used previously published value coefficients to estimate changes in the value of ecosystem services delivered by each land category. Finally, we ranked the contribution of various ecosystem functions to the overall value of the ecosystem services. We determined that the total value of ecosystem services in Dongtan declined by 62% from $ 316.77 to 120.40 million per year between 1990 and 2000 (totaling $855.26鈥981.85 million over 10-years). This massive decrease is largely attributable to the 71% loss of wetlands/tidal flats. Our sensitivity analysis suggested that these estimates were relatively robust. We also found that the contribution of water regulation, water supply, waste treatment, and raw materials increased, while the contribution of nutrient cycling, food production, disturbance regulation, recreation, habitat/refugia, and biological control decreased during the 10-year time period. We conclude that future land-use policy formulation should give precedence to the conservation of these ecosystems over uncontrolled reclamation, and that further land reclamation should be based on rigorous environmental impact analyses.
Spatial-temporal pattern and driving forces of land use changes in Xiamen
[J].
DOI:10.1016/S1002-0160(06)60078-7
URL
[本文引用: 1]
sing Landsat TM data of 1988, 1998 and 2001, the dynamic process of the spatial-temporal characteristics of land use changes during 13 years from 1988 to 2001 in the special economic zone of Xiamen, China was analyzed to improve understanding and to find the driving forces of land use change so that sustainable land utilization could be practiced. During the 13 years cropland decreased remarkably by nearly 11304.95 ha. The areas of rural-urban construction and water body increased by 10 152.24 ha and 848.94 ha, respectively. From 1988 to 2001, 52.5% of the lost cropland was converted into rural-urban industrial land. Rapid urbanization contributed to a great change in the rate of cropland land use during these years. Land-reclamation also contributed to a decrease in water body area as well as marine ecological and environmental destruction. In the study area 1) urbanization and industrialization, 2) infrastructure and agricultural intensification, 3) increased affluence of the farming community, and 4) policy factors have driven the land use changes. Possible sustainable land use measures included construction of a land management system, land planning, development of potential land resources, new technology applications, and marine ecological and environmental protection.
Using long time series of Landsat data to monitor impervious surface dynamics:A case study in the Zhoushan Islands
[J].
DOI:10.1117/1.JRS.7.073515
URL
[本文引用: 2]
Islands are an important part of the marine ecosystem. Increasing impervious surfaces in the Zhoushan Islands due to new development and increased population have an ecological impact on the runoff and water quality. Based on time-series classification and the complement of vegetation fraction in urban regions, Landsat thematic mapper and other high-resolution satellite images were applied to monitor the dynamics of impervious surface area (ISA) in the Zhoushan Islands from 1986 to 2011. Landsat-derived ISA results were validated by the high-resolution Worldview-2 and aerial photographs. The validation shows that mean relative errors of these ISA maps are <15 %. The results reveal that the ISA in the Zhoushan Islands increased from 19.2 kmin 1986 to 86.5 kmin 2011, and the period from 2006 to 2011 had the fastest expansion rate of 5.59 kmper year. The major land conversions to high densities of ISA were from the tidal zone and arable lands. The expansions of ISA were unevenly distributed and most of them were located along the periphery of these islands. Time-series maps revealed that ISA expansions happened continuously over the last 25 years. Our analysis indicated that the policy and the topography were the dominant factors controlling the spatial patterns of ISA and its expansions in the Zhoushan Islands. With continuous urbanization processes, the rapid ISA expansions may not be stopped in the near feature.
Effects of urbanization on the aquatic fauna of the Line Creek watershed, Atlanta-a satellite perspective
[J].
DOI:10.1016/S0034-4257(03)00082-8
URL
[本文引用: 1]
Impervious surface area (ISA) was derived for a period from 1979 to 1997 from Landsat MSS and TM data for the Line Creek watershed that lies to the south of the city of Atlanta, GA. The change in ISA is presented as an ecological indicator to examine the cumulative water resource impacts on mussel population in three sub-watersheds of Line Creek—namely, Line, Flat, and Whitewater creeks. The satellite analysis shows that ISA expansion occurred substantially from 1987 to 1997 and is predominantly in industrial, commercial, and shopping center (ICS) complexes but also in smaller lot-size residential development. Evidence of mussel habitat degradation is indicated and loss of species (in the region of 50 to 70%) is present in areas where ISA expansion is observed—specifically in ICS complex development in and around Peachtree City that drains directly into the Line and Flat creeks. This is in marked contrast to Whitewater Creek where overall development of ISA is less and no major loss of mussel species is observed.
On the relation between NDVI,fractional vegetation cover,and leaf area index
[J].
DOI:10.1016/S0034-4257(97)00104-1
URL
[本文引用: 1]
We use a simple radiative transfer model with vegetation, soil, and atmospheric components to illustrate how the normalized difference vegetation index (NDVI), leaf area index (LAI), and fractional vegetation cover are dependent. In particular, we suggest that LAI and fractional vegetation cover may not be independent quantitities, at least when the former is defined without regard to the presence of bare patches between plants, and that the customary variation of LAI with NDVI can be explained as reuslting from a variation in fractional vegetation cover. The following points are made: i) Fractional vegetation cover and LAI are not entirely independnet quatities, depending on how LAI is defined. Care must be taken in using LAI and fractional vegetation cover independently in a model because the former may partially take account of the later; ii) A scaled NDVI taken between the limits of minimum (bare soil) and maximum fractional vegetation cover is insenstive to atmospheric correction for both clear and hazy conditions, at least for viewing angles less than about 20 degrees form nadir; iii) A simple relation between scaled NDVI and fractional vegetation cover, previously described in the literature, is further confirmed by the simulations; iv) The sensitive dependence of LAI and NDVI when the former is below a value of about 2-4 may be viewed as being due to the variation in the bare soil component.
