

0 引言
归一化植被指数(normalized difference vegetation index,NDVI)能较好地表征植被的生长过程,而且与气温、降水等具有紧密的联系[4,5,6],现已成为城市气候研究的重要指标[3],被广泛应用于城市植被覆盖监测、土地覆盖分类、地表温度、近地表气温(以下简称气温)和降水等研究[7,8,9,10,11,12,13]。作为量化城市热岛的重要指示器,地表温度和气温已被应用于城市热岛效应研究。许多学者采用不同的方法研究不同区域在不同季节下NDVI与地表温度和气温间的关系,结果表明NDVI与地表温度存在明显的负相关[14,15,16],而与气温间的关系则呈显著的空间异质性[4]。崔林丽等[17]采用时滞相关分析法研究华东及其周边地区NDVI对气温的时空响应特征,结果表明NDVI与气温在夏季和秋季相关性较高,冬季相关性最低; 历华等[18]指出单独使用NDVI定量研究城市热岛是不能满足要求的,城市建筑用地也是城市热岛研究的一个重要指标。一般用归一化建筑指数(normalized difference build-up index,NDBI)或建筑用地指数(index based-build-up index,IBI)提取建筑用地。相关学者研究了不同地区NDVI和NDBI与热岛分布间的关系,结果表明城市热岛与NDVI呈负相关,与NDBI呈正相关[19,20,21]。樊亚鹏等[22]以广州市为研究区域,分别采用IBI和NDVI分析了1990─2008年间广州市的热岛效应,结果发现广州市建筑用地与地表温度呈正相关,NDVI与地表温度呈负相关。
然而,上述研究仅利用相关性分析和普通回归方法分析NDVI和NDBI与地表温度和气温间的相关性,并没有考虑NDVI,NDBI和温度的空间自相关与空间异质性,也没有充分考虑地表温度和气温数据的空间信息,难以进一步挖掘NDVI和NDBI空间变异性对地表温度和气温的影响。鉴于此,本文结合MODIS NDVI数据,用Landsat8估计的NDBI和广州市264个气象观测站观测的2015年月平均气温,分别利用普通线性回归模型、空间滞后模型和空间误差模型在区域尺度上拟合NDVI和NDBI与气温的关系,定量分析城市NDVI和NDBI对气温时空格局的影响,为缓解广州市热岛效应、建设生态城市提供科学依据。
1 研究数据
1.1 气象数据
本文以广州市作为研究区。广州市位于广东省中南部、珠三角中北缘,地处亚热带沿海,属海洋性亚热带季风气候区,温暖多雨,年平均气温约20~22℃,7月份最热,月平均气温达28.7℃; 1月份最冷,月平均气温为9~16℃。气温数据采用广东省气象局提供的2015年1─12月自动气象观测站的近地表月平均气温。对这些气象观测站的气温数据进行质量检查,剔除存在明显异常的观测数据,得到264个站点的月平均近地表气温(图1)。选择冬(2015年1月)、春(2015年4月)、夏(2015年7月)、秋(2015年10月)4个季节的气温数据研究NDVI和NDBI与气温数据间的关系。
图1

图1
研究区及气象观测站分布
Fig.1
Study area and distribution of automatic meteorological stations
1.2 MODIS NDVI数据
本文选取MODIS提供的月合成1 km空间分辨率植被指数(MOD13A3)数据产品作为NDVI数据源,对应的时间为2015年1─12月,数据下载于美国USGS数据中心(
利用NASA提供的MODIS Reprojection Tools(MRT)软件,将下载的MOD13A3数据进行数据格式转换和投影转换(投影坐标为WGS84 UTM Zone_49N),并利用研究区矢量边界进行影像裁剪,得到如图2所示的月合成NDVI数据。
图2
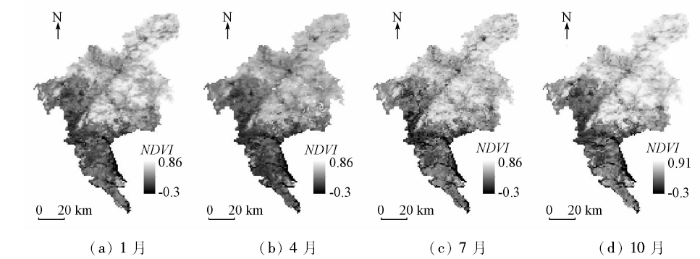
从图2可以看出,从冬季到夏季,研究区NDVI指数随时间推移而增加; 从秋季到冬季,NDVI指数随时间推移而减少; 春、夏2季则NDVI变化比较大,表明春、夏2季植物生长旺盛。从整体上看,广州市主城区的NDVI指数较低,主要因为主城区以建筑物为主。
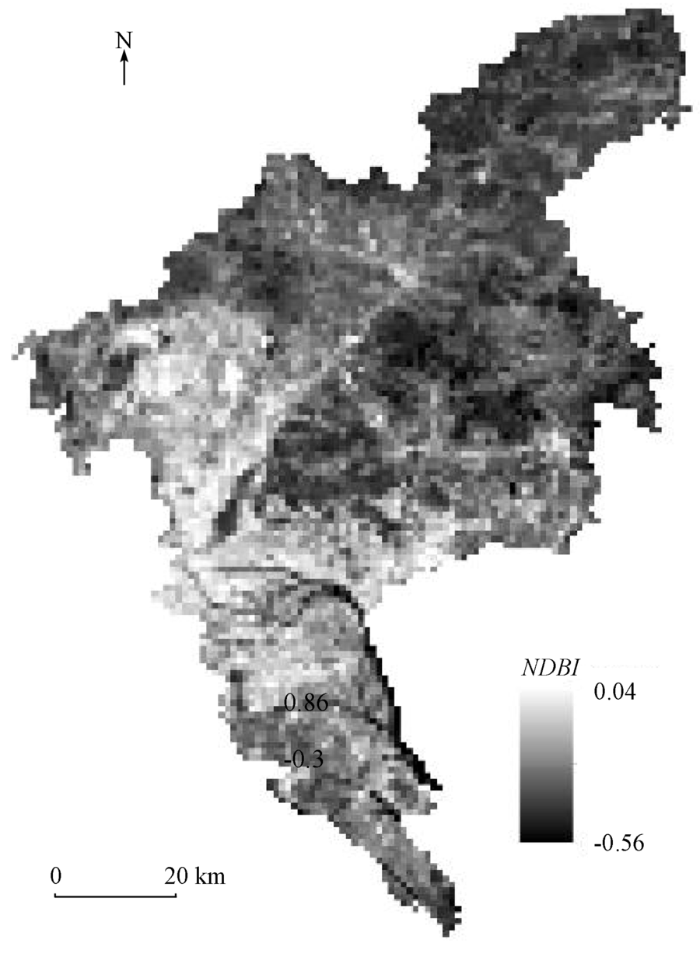
1.3 NDBI指数
NDBI指数是由查勇等[23]提出的基于Landsat TM影像构建的归一化建筑物指数,主要用来自动提取城市用地。采用美国地质调查局地球资源观测与科学中心(
NDBI=
式中ρSWIR和ρNIR分别为Landsat8 OLI第6和第5波段的光谱反射率。
图3
2 研究方法
2.1 空间自回归模型
以月平均近地表气温为因变量,以NDBI和NDVI为自变量,首先分析气温与NDVI和NDBI之间的相关关系,然后分别采用普通线性回归模型、空间自回归模型(空间滞后模型、空间误差模型和空间杜宾模型)对不同季节的近地表气温及其影响因子进行建模分析。
Anselin[25]提出的空间自回归模型为
$\begin{cases}y=\rho W_{1}y+\beta X+\mu\\\mu=\lambda W_{2}\mu+\varepsilon \\\varepsilon:N(0,\delta^2I)\end{cases}$, (3)
式中: y为因变量,指月平均近地表气温; X为自变量,表示与近地表气温相关的影响因素(包括NDBI和NDVI); β为自变量的回归系数; μ为随机误差项; ε为服从均值为0、方差为δ2的随机误差; W1和W2分别为因变量自身与残差空间趋势的权重矩阵; ρ为空间滞后项W1y的系数; λ为空间误差项的回归系数。
当式(1)参数向量的不同向量设置为0时,可以产生4种不同的空间模型结构,本文只考虑其中的3种,即
1)当ρ=0,λ=0时,为普通线性回归模型(ordinary linear regression,OLS)。该模型一般假设观测值相互独立不受其他因素影响,不考虑区域间的空间差异性。
2)当ρ≠0,λ=0时,为空间滞后模型(spatial lag model,SLM)。该模型考虑了因变量的空间相关性,即某一空间区域的因变量不仅与同一区域的自变量有关,而且与相邻区域的因变量有关。
3)当ρ=0,λ≠0时,为空间误差模型(spatial error model,SEM)。该模型不考虑因变量的空间相关性,只考虑了自变量的空间自相关性,即某一空间区域的因变量与同一区域的自变量、相邻区域的自变量和因变量有关。
采用赤池信息量准则(Akaike information criterion,AIC)信息指标[26](一种衡量统计模型拟合优良性的标准)评价空间自回归模型的拟合精度,并利用莫兰指数(Moran index,Moran’s I)对回归模型误差项进行空间自相关分析。一般认为,较低的AIC表明模型的模拟效果更好; 当2个模型之间的AIC值相差大于3时,具有较小AIC值的模型对数据的模拟效果更好。回归模型残差的空间自相关分析也可作为评价回归模型拟合效果的一个指标。Moran’s I值接近0表示回归模型的残差不存在空间自相关性,回归模型拟合效果较好; Moran’s I值大于或者小于0,表示回归模型的残差仍存在明显的空间自相关性,回归模型拟合效果较差。
2.2 空间权重的选择
一般地,空间权重矩阵可以通过二元邻居和距离函数进行计算。由于本文采用的近地表气温数据是气象站点数据,因此选择空间距离函数来计算空间权重矩阵。经过比较分析,最终确定距离阈值为12 km。
3 结果与分析
3.1 NDVI和NDBI与近地表气温间的关系
为研究NDVI和NDBI与近地表气温间的关系,研究区所有自动气象观测站观测的不同季节的月平均近地表气温与NDVI和NDBI的散点图如图4和5所示。
图4
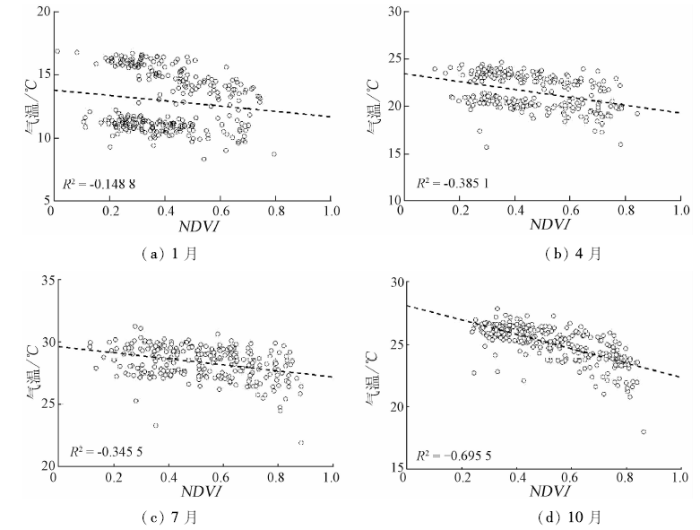
图4
不同季节近地表气温与NDVI散点图
Fig.4
Scatter plots of air temperature and NDVI in different seasons
图5
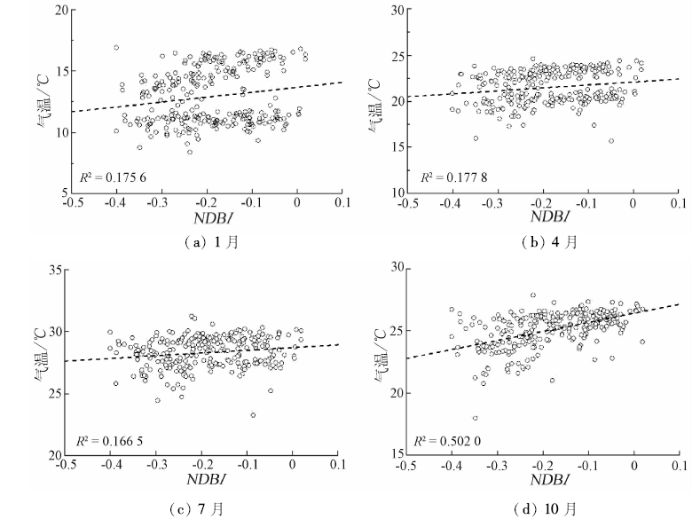
图5
不同季节的近地表气温与NDBI散点图
Fig.5
Scatter plots of air temperature and NDBI in different seasons
从图4可以看出,4个季节的NDVI与近地表气温间存在显著的负相关关系,相关系数随时间的推移而变化,冬季的相关系数最低,与崔林丽等[17]的研究结果类似。与之相反的是,NDBI与近地表气温间存在正相关关系(图5)。从图5可以看出,冬、春、夏3个季节的正相关系数相差不大,秋季NDBI与近地表气温间存在显著的正相关关系,相关系数达到了0.502。这可能与对NDBI与不同季节近地表气温进行比较时只用了2015年10月18日这1个时相的NDBI有关。另外,1 km空间分辨率的NDBI是通过将30 m空间分辨率的NDBI经过插值、聚合分析得到的,这也会引入一些误差。从图4和5可以发现,冬季和春季的NDVI和NDBI与近地表气温间的相关性存在2个非常明显的区间,形成一高一低聚集的现象。在冬季(图4(a)和图5(a))近地表气温较低时,NDVI和NDBI与近地表气温间的相关系数比较小; 在春季(图4(b)和图5(b))近地表气温较高时,NDVI和NDBI与近地表气温间的相关系数显著增加。近地表气温较低的气象观测站主要集中在广州市主城区、花都区以及南沙区; 与之相反的是,番禺区、增城区和从化区的近地表气温比较高。到了春季,虽然分区还存在,但是它们之间相关系数的差异缩小了,比较接近。近地表气温的气象观测站聚集的区域发生了改变,近地表气温较低的气象观测站主要集中在广州市主城区、花都区以及增城区。到了夏季和秋季,分区不复存在,近地表气温较高的气象观测站主要聚集在荔湾区、越秀区、海珠区、番禺区以及南沙区。从图4中也可以看出,NDVI越大,植被生长越茂盛,近地表气温越低。这表明通过植树造林,提高城市绿化率可以起到降温的作用。从图5中则可以看出,NDBI越大,城市建筑用地面积越大,近地表气温越高。这表明城市的扩张(建筑物增加、不透水面的增加和植被的减少)提升了城市整体的气温,从而出现城市“热岛”现象。
3.2 空间自回归模型比较
利用R语言的spdep函数包建立了不同季节的近地表气温与NDVI和NDBI间的空间自回归模型: OLS,SLM和SEM。空间自回归模型的分析及检验结果见表1─4。
表1 1月份近地表气温3种空间自回归模型参数
Tab.1
| 参数 | 空间自回归模型 | ||
|---|---|---|---|
| OLS | SLM | SEM | |
| (截距) | 13.852(35.866)①***② | 4.222(4.855)*** | 13.719(23.749)*** |
| NDVI | -0.871(-0.767) | -0.538 (-0.585) | -1.139(-1.003) |
| NDBI | 3.103(1.712)’ | 1.792(1.224) | 1.668(1.054) |
| ρ | ─ | 0.716(12.304)*** | ─ |
| λ | ─ | ─ | 0.721(12.286)*** |
| R2 | 0.026 | 0.310 | 0.309 |
| AIC | 1 177.300 | 1 090.200 | 1 090.600 |
| N | 264.000 | 264.000 | 264.000 |
| Moran’s I | 0.371 | -0.006 | -0.009 |
①括号里的值表示显著性检验t或者z统计值; ②***表示显著性水平P<0.000; **表示P<0.001; *表示P<0.01; .表示P<0.05; ’表示P<0.1。下表中含义相同。
表2 4月近地表气温3种空间自回归模型参数
Tab.2
| 参数 | 空间自回归模型 | ||
|---|---|---|---|
| OLS | SLM | SEM | |
| (截距) | 23.379(77.378)*** | 8.127(5.582)*** | 22.660(51.261)*** |
| NDVI | -4.661(-6.086)*** | -1.783(-2.704)** | -1.766(-2.198)· |
| NDBI | -1.348(-1.060) | 0.765(0.727) | 2.088(1.825)’ |
| ρ | ─ | 0.665(10.687)*** | ─ |
| λ | ─ | ─ | 0.698(11.288)*** |
| R2 | 0.145 | 0.373 | 0.370 |
| AIC | 1 019.200 | 941.600 | 942.700 |
| N | 264.000 | 264.000 | 264.000 |
| Moran’s I | 0.328 | -0.017 | -0.024 |
表3 7月近地表气温3种空间自回归模型参数
Tab.3
| 参数 | 空间自回归模型 | ||
|---|---|---|---|
| OLS | SLM | SEM | |
| (截距) | 29.588(129.219)*** | 10.455(5.6350)*** | 29.456(93.347)*** |
| NDVI | -2.804(-5.343)*** | -1.397(-3.125)*** | -1.687(-3.296)*** |
| NDBI | -1.095(-1.120) | 0.265(0.328) | 1.272(1.484) |
| ρ | ─ | 0.658(10.505)*** | ─ |
| λ | ─ | ─ | 0.692(11.049)*** |
| R2 | 0.117 | 0.356 | 0.365 |
| AIC | 860.500 | 781.300 | 777.400 |
| N | 264.000 | 264.000 | 264.000 |
| Moran’s I | 0.366 | -0.006 | -0.022 |
表4 10月近地表气温3种空间自回归模型参数
Tab.4
| 参数 | 空间自回归模型 | ||
|---|---|---|---|
| OLS | SLM | SEM | |
| (截距) | 28.086(136.991)*** | 9.754(7.021)*** | 26.295(79.770)*** |
| NDVI | -5.414(-10.900)*** | -2.264(-5.345)*** | -2.069(-4.238)*** |
| NDBI | 0.949(1.096) | 1.003(1.504) | 1.353(1.888)’ |
| ρ | — | 0.665(13.108)*** | — |
| λ | — | — | 0.791(16.491)*** |
| R2 | 0.482 | 0.673 | 0.648 |
| AIC | 771.700 | 654.000 | 674.000 |
| N | 264.000 | 264.000 | 264.000 |
| Moran’s I | 0.299 | -0.051 | -0.045 |
从表1中可以看出,OLS中自变量NDVI的系数为负数,NDBI的系数为正数,表明冬季近地表气温与NDVI存在负的相关性,与NDBI存在正的相关性,即地区的植被生长越茂盛,建筑用地越少,近地表气温越低。然而,OLS的R2仅为0.026,拟合度较差; OLS残差的Moran’s I高达0.371,具有很强的空间自相关。这进一步说明,不考虑空间相关的OLS不能有效地解释变量之间的关系。
SLM中R2为0.310,明显高于OLS的0.026; AIC为1 090.2,小于OLS的AIC,说明SLM的拟合效果优于OLS。另外,SLM中ρ为正且显著,表明因变量之间具有很强的空间自相关。Moran’s I接近0,表明SLM的残差在空间上不再聚集。SEM中λ为正且显著,说明模型误差具有很强的空间依赖。SLM的检验参数与SEM检验参数非常接近,总体上,SLM略优于SEM。
在SLM中,从冬季到秋季,NDVI的回归系数分别为-0.538(表1)、-1.783(表2)、-1.397(表3)和-2.264(表4),总体上随季节减少,而NDBI的回归系数从1.792(表1)减少到0.265(表3),然后又增加到1.003(表4),但整体上还是呈现出一种随季节减少的趋势。这表明从冬季到秋季,NDVI对近地表气温的影响逐渐增大,而NDBI对近地表气温的影响逐渐减少。这是因为从冬季到秋季植物处在生长过程,NDVI值在不断增加,到秋季植物茂盛时NDVI值达到最大,而城市建设用地基本变化不大,在这个时间段内,植被对近地表气温的影响大于城市建设用地。在冬季,由于部分植被绿叶变黄掉落,NDVI值达到最小,此时建设用地对近地表气温的影响占主导地位。
表2─4表示SLM和SEM的拟合效果都远优于OLS; 回归模型的决定系数R2最小值为0.356(表3),最大值为0.673(表4)。春季近地表气温与NDVI和NDBI的SLM的R2,AIC以及回归模型残差的Moran’s I指数都优于SEM。夏季时,SEM的R2和AIC优于SLM,但是其模型残差的Moran’s I大于SLM,Moran’s I为-0.006表明SLM残差是相互独立,在空间上不聚集。冬季与夏季相反,尽管SLM残差的Moran’s I的绝对值略大于SEM,但是SLM的R2和AIC远优于SEM。因此,从整体上看,SLM的拟合效果略优于SEM。利用SLM来分析不同季节近地表气温与NDVI和NDBI间的空间关系更合理。
4 结论
本文结合2015年月均站点近地表气温、MOD13A3的NDVI以及用Landsat8 OLI提取的NDBI等数据,采用相关性分析以及空间自回归模型,研究了广州地区不同季节近地表气温与NDVI和NDBI之间的相关关系,得到以下结论:
1)从冬季到秋季,NDVI指数随时间增加; 从秋季到冬季,NDVI指数随时间减少。4个季节的NDVI与近地表气温间存在显著的负相关关系,NDBI与近地表气温间存在正相关关系。
2)4个季节的近地表气温与NDVI和NDBI的OLS的残差的Moran’s I都大于等于0.299,表明普通回归模型的残差存在显著的空间自相关性,说明了OLS并没有考虑近地表气温本身以及与NDVI和NDBI间的空间自相关性的影响。因此,需采用空间自回归模型来分析近地表气温与NDVI和NDBI之间的相关关系。
3)分别建立不同季节近地表气温与NDVI和NDBI间的SLM与SEM。经过SLM与SEM回归后,回归模型的R2有了很大的提高,AIC减少较多,说明SLM与SEM的拟合度优于普通回归模型。SLM与SEM的残差的Moran’s I接近0,表明残差的空间自相关性已消失。因此,SLM与SEM都能较好地解释不同季节近地表气温与NDVI和NDBI间的相关关系。通过比较分析R2,AIC以及回归模型残差的Moran’s I,发现整体上SLM的拟合效果略优于SEM。
4)在SLM中,NDVI对近地表气温的影响随着季节逐渐增大,而NDBI对近地表气温的影响随着季节逐渐减少。SLM的空间自回归系数ρ为正数且显著,表明近地表气温受到相邻气象站点的近地表气温显著的正影响。
本文仅分析了NDVI和NDBI与气温的回归关系; 实际上,除了NDVI与NDBI外,其他很多因素都直接影响气温的变化,如降雨、地形和风速等。未来的研究可以将这些因素融合到空间自回归模型中,以获取更为客观合理的分析结果。此外,本文在时间尺度上仅利用了2015年4个月的数据分析气温与NDVI和NDBI间的关系,尚未将长时间序列的数据纳入研究,今后需利用长时间序列数据更加深入地分析、探讨城市气温的时空变化特征。
参考文献
城市热岛的生态环境效应
[J].
A review of the eco-environmental consequences of urban heat islands
[J].
城市土地利用类型及格局的热环境效应研究——以上海市中心城区为例
[J].
DOI:10.3969/j.issn.1000-0690.2007.02.020
URL
[本文引用: 1]

以上海市中心城区为例,首先采用SPOT影象,人工解译出城市土地利用的类型,同时利用Landsat7卫星,ETM+影象的热红外波段反演每个像元内的陆地表面温度,分析陆地表面温度在不同土地利用类型之间的差异,进一步分析不同土地空间分布格局与地面温度之间的关系。研究结果显示:上海市地表温度具有明显中心城区高、郊区低的热岛效应存在;在城市不同土地利用类型上的表面温度具有显著性差异,两两之间的比较揭示,城市地面温度在大多数土地利用类型之间的差异是显著的。城市内部不同土地类型所产生的热环境效应不同;城市土地类型在空间布局上越复杂,其产生的热岛效应越明显。
Thermal environment effect of urban land use type and pattern:A case study of central area of Shanghai City
[J].
Comparison of impervious surface area and normalized difference vegetation index as indicators of surface urban heat island effects in Landsat imagery
[J].
DOI:10.1016/j.rse.2006.09.003
URL
[本文引用: 2]
This paper compares the normalized difference vegetation index (NDVI) and percent impervious surface as indicators of surface urban heat island effects in Landsat imagery by investigating the relationships between the land surface temperature (LST), percent impervious surface area (%ISA), and the NDVI. Landsat Thematic Mapper (TM) and Enhanced Thematic Mapper Plus (ETM+) data were used to estimate the LST from four different seasons for the Twin Cities, Minnesota, metropolitan area. A map of percent impervious surface with a standard error of 7.95% was generated using a normalized spectral mixture analysis of July 2002 Landsat TM imagery. Our analysis indicates there is a strong linear relationship between LST and percent impervious surface for all seasons, whereas the relationship between LST and NDVI is much less strong and varies by season. This result suggests percent impervious surface provides a complementary metric to the traditionally applied NDVI for analyzing LST quantitatively over the seasons for surface urban heat island studies using thermal infrared remote sensing in an urbanized environment.
基于GWR模型的中国NDVI与气候因子的相关分析
[J].
DOI:10.13209/j.0479-8023.2015.130
URL
[本文引用: 2]
在ArcGIS支撑下,基于1982—2010年8 km分辨率的AVHRR NDVI及气温和降水数据,应用最小二乘法和地理加权回归方法,构建中国NDVI与气候因子的地理加权回归模型,定量分析中国NDVI与气温和降水的相互关系,获取各个回归参数的空间格局,并将模拟结果与全局性回归结果进行对比。结果表明,与线性回归模型相比,地理加权回归模型的拟合效果显著提高,拟合优度从0.3提高到0.6。气候因子对NDVI的影响具有空间异质性:从北到南,气候因子对NDVI的影响逐渐减小;西北内陆等干旱荒漠地带,气候因子对NDVI的影响较大。对中国大部分地区而言,气温对NDVI的影响超过降水。各区NDVI与主导气候因子发生作用的特征尺度不同。
Modelling relationship between NDVI and climatic factors in China using geographically weighted regression
[J].
NDVI与气候因子关系在不同时间尺度上的结果差异
[J].
Different correlations between NDVI and meteorological factors at temporal-time scales
[J].
长江上游安宁河流域植被生长变化对气候条件的响应
[J].
Responses of vegetation changes to climatic variations in Anning River Basin of upper Yangtze River Region
[J].
—2012年中亚地区植被时空变化特征及其与气候变化的相关分析
[J].
Spatial-temporal variation of vegetation and its correlation with climate change in Central Asia during the period of 1982—2012
[J].
应用遥感时序数据研究植被变化与气候因子的关系——以环渤海地区为例
[J].
Application of remote sensing time-series data to investigate the relationship between vegetation change and climatic factors:A case study of Circum-Bohai Sea area
[J].
京津冀地区NDVI变化及气候因子驱动分析
[J].
DOI:10.3724/SP.J.1047.2015.01001
URL
[本文引用: 1]
植被覆盖动态监测及与气候变化的响应,是陆地生态系统研究的重要内容。本文以2001-2013年间京津冀地区MOD13A 3月合成NDVI数据,结合生长季的降水和气温资料,运用偏相关和复相关分析、趋势分析方法,研究了该区域NDVI的变化特征和空间分布,以及其区域植被覆盖变化的气候驱动力。结果表明,该区域NDVI最大值在13a间缓慢增加,植被覆盖呈现改善趋势;NDVI和生长季降雨量及平均气温的平均偏相关系数分别为0.20和-0.14,表明在年际变化水平上,京津冀地区NDVI总体与降水量呈正相关,与平均气温呈负相关,且降水对NDVI的影响大于温度对NDVI的影响。对植被覆盖驱动分区得出,降水和气温驱动型占区域面积的5.68%;单独降水驱动型和气温驱动型分别占4.51%、0.18%;区域内植被覆盖变化主要受非气候因子驱动型为主,所占比例为89.63%,表明人类活动对植被变化的影响巨大。
Analysis of spatial-temporal change of NDVI and its climatic driving factors in Beijing-Tianjin-Hebei metropolis circle from 2001 to 2013
[J].
Study on the relationship between urban surface temperature and vegetation index in Xuchang City
[J].
DOI:10.4028/www.scientific.net/AMM.321-324.2496
URL
[本文引用: 1]
Urban surface temperature distribution is closely linked to its ground vegetation cover. Determining the correlation between the urban surface temperature and its ground vegetation has an important role in the urban surface temperature improvement and the urban environment optimization. This paper selects the TM data in the summer of 2009 to obtain the normalized difference vegetation index (NDVI) and selects 129 samples in the seasons acquired by the images to do the actual measurement of the surface temperature. Then it analyzes the quantitative relationship between the surface measured temperature and normalized difference vegetation index finding out that there exists a negative correlation; Their regression fits to obtain the type of relationship: Ts = 37-14.64 * NDVI. The identification of the correlation between the urban temperature and vegetation index provides a relatively reliable theoretical basis and technical support to the urban planning, and urban ecological environment construction.
Spatial modeling of urban vegetation and land surface temperature:A case study of Beijing
[J].
DOI:10.3390/su7079478
URL
[本文引用: 1]
The coupling relationship between urban vegetation and land surface temperature (LST) has been heatedly debated in a variety of environmental studies. This paper studies the urban vegetation information and LST by utilizing a series of remote sensing imagery covering the period from 1990 to 2007. Their coupling relationship is analyzed, in order to provide the basis for ecological planning and environment protection. The results show that the normalized difference vegetation index (NDVI), urban vegetation abundance (UVA) and urban forest abundance (UFA) are negatively correlated with LST, which means that both urban vegetation and urban forest are capable in decreasing LST. The apparent influence of urban vegetation and urban forest on LST varies with the spatial resolution of the imagery, and peaks at the resolutions ranging from 90 m to 120 m.
Ecological responses to recent climate change
[J].
DOI:10.1038/416389a
URL
PMID:11919621
[本文引用: 1]
Abstract There is now ample evidence of the ecological impacts of recent climate change, from polar terrestrial to tropical marine environments. The responses of both flora and fauna span an array of ecosystems and organizational hierarchies, from the species to the community levels. Despite continued uncertainty as to community and ecosystem trajectories under global change, our review exposes a coherent pattern of ecological change across systems. Although we are only at an early stage in the projected trends of global warming, ecological responses to recent climate change are already clearly visible.
Response of NDVI dynamics to precipitation in the Beijing-Tianjin sandstorm source region
[J].
DOI:10.1080/01431161.2013.787505
URL
[本文引用: 1]
This article analysed the spatio-temporal changes in vegetation cover in the Beijing–Tianjin sandstorm source region in China and related these changes to vegetation types based on the Advanced Very High Resolution Radiometer (AVHRR) normalized difference vegetation index (NDVI) data set from 1982 to 2006. The annual maximum NDVI and peak time were identified. The different periods (1–12 months) of accumulated precipitation before the peak time were then calculated at the grid scale for each year. On this basis, the NDVI–rainfall relationship and the temporal responses in this area were studied by calculating the correlation coefficient between the annual maximum NDVI and different periods (1–12 months) of accumulated precipitation before the occurrence of the annual maximum NDVI for each pixel. The results show an upward trend in regional vegetation, a significant recovery efficiency for grassland, and the evident degradation of cropland. Peak plant growth is significantly related to precipitation and is strongly positively correlated with precipitation in the previous period (1 month) regardless of vegetation type. The regions showing the strongest correlations between peak plant growth and 1 month cumulative rainfall are the western desert grassland, grassland to forest in the transitional hill regions, the mountains of Yanshan, and the Greater Hinggan Mountains.
基于MODIS数据的吉林省中部地表温度反演及空间分布研究
[J].
Retrieval and spatial distribution of land surface temperature in the middle part of Jilin Province based on MODIS data
[J].
基于MODIS地表温度和归一化植被指数的生态环境变化分析
[J].
DOI:10.3969/j.issn.1000-3177.2014.03.008
URL
[本文引用: 1]
地表温度和归一化植被指数是全球环境变化重要的指示因子,对生态系统的研究具有重要意义.利用经过Savitzky-Golay滤波平滑处理的四川省MODIS地表温度和归一化植被指数数据,研究2001年~2010年全省地表温度和NDVI变化规律,以及高程和坡度对两者的影响.研究结果表明:四川省地表温度和NDVI在年时间序列都有较大的波动,地表温度轻微降低,NDVI小幅增加,二者之间存在一定的负相关性;地表温度和NDVI线性回归斜率在空间上同样也存在较大的负相关性,回归斜率平均值分别是-0.006和0.0025;NDVI与高程和坡度的相关性呈现分段式特征,而地表温度随高程的升高而平缓降低,随着坡度的增加而递减.
Analysis of the ecological environment changes in land surface temperature and NDVI based on MODIS remote sensing data
[J].
Statistical analysis of land surface temperature-vegetation indexes relationship through thermal remote sensing
[J].
DOI:10.1016/j.ecoenv.2015.07.004
URL
PMID:26209299
[本文引用: 1]
Vegetation coverage has a significant influence on the land surface temperature (LST) distribution. In the field of urban heat islands (UHIs) based on remote sensing, vegetation indexes are widely used to estimate the LST-vegetation relationship. This paper devises two objectives. The first analyzes the correlation between vegetation parameters/indicators and LST. The subsequent computes the occurrence of vegetation parameter, which defines the distribution of LST (for quantitative analysis of urban heat island) in Kalaburagi (formerly Gulbarga) City. However, estimation work has been done on the valuation of the relationship between different vegetation indexes and LST. In addition to the correlation between LST and the normalized difference vegetation index (NDVI), the normalized difference build-up index (NDBI) is attempted to explore the impacts of the green land to the build-up land on the urban heat island by calculating the evaluation index of sub-urban areas. The results indicated that the effect of urban heat island in Kalaburagi city is mainly located in the sub-urban areas or Rurban area especially in the South-Eastern and North-Western part of the city. The correlation between LST and NDVI, indicates the negative correlation. The NDVI suggests that the green land can weaken the effect on urban heat island, while we perceived the positive correlation between LST and NDBI, which infers that the built-up land can strengthen the effect of urban heat island in our case study. Although satellite data (e.g., Landsat TM thermal bands data) has been applied to test the distribution of urban heat islands, but the method still needs to be refined with in situ measurements of LST in future studies.
中国华东及其周边地区NDVI对气温和降水的季节响应
[J].The interaction between vegetation and the atmosphere is important in geosciences and has become a research focus in recent years. As a sensitive indicator of surface vegetation coverage and vegetation growth status, the Normalized Difference Vegetation Index (NDVI) has been widely used in environmental, ecological, and agricultural studies. With the time lag correlation method, characteristics of spatial and temporal response of NDVI to variations in air temperature and precipitation in East China and its surrounding areas were comprehensively examined based on SPOT VGT-NDVI data, monthly air temperature, and precipitation data at 135 meteorological stations during the period 1998-2011. Results indicate that across the entire study region, both air temperature and precipitation have an influence on NDVI, but air temperature plays a more prominent role. In general, the correlation between NDVI and air temperature is stronger in summer and autumn, and the correlation between NDVI and precipitation is stronger in autumn and spring. In winter, the correlation between NDVI and air temperature and precipitation seem to be low. The lag time of the maximum NDVI in response to air temperature is shorter in spring and autumn. The lag time of the maximum NDVI in response to precipitation is shorter in winter. In summer, the lag time of the maximum NDVI in response to air temperature and precipitation is longer. Spatial distribution of the maximum NDVI-temperature and NDVI-precipitation correlation coefficients varies slightly between the northern and southern parts of the study region in winter, spring and autumn, but in summer, it shows a marked difference between the northern and southern parts. The lag time of the maximum NDVI in response to temperature exhibits an obvious difference between the northern and southern parts of the study region in spring, summer, and autumn, but the lag time of the maximum NDVI in response to precipitation has a little difference between the northern and southern parts in all seasons except summer. Characteristics of response of NDVI to variations in air temperature and precipitation are closely related to the monsoon climate and the features of farming systems in East China and its surrounding areas. In the northern and middle parts of the study region, temperature rises in spring and drops in autumn quickly, and the precipitation is mainly concentrated in summer. In addition, cropland occupies a larger percentage in East China and its surrounding areas, with relatively consistent sowing- and harvest-time. Both may result in seasonal variations in NDVI and differences in the lag time of the maximum NDVI in response to temperature and precipitation.
Characteristics of seasonal response of NDVI to variations in temperature and precipitation in east China and its surrounding areas
[J].
基于MODIS数据的长株潭地区NDBI和NDVI与地表温度的关系研究
[J].
DOI:10.3969/j.issn.1000-0690.2009.02.019
URL
[本文引用: 1]
基于4个季节的MODIS影像,计算长株潭地区的地表温度、NDBI和NDVI,比较NDBI和NDVI与地表温度之间关系,对地表城市热岛效应研究的指标NDBI和NDVI进行对比分析。结果表明,NDBI与4个季节的地表温度间都存在明显的线性关系,而NDVI与地表温度间关系并不明显且随季节发生变化,说明NDBI是地表城市热岛效应研究的有效指标,在地表城市热岛效应的季节变化研究中NDBI可作为NDVI的一个附加指标。
Relationships of LST to NDBI and NDVI in Changsha-Zhuzhou-Xiangtan Area based on MODIS data
[J].
基于Landsat8 OLI数据的合肥市热岛时空特征分析
[J].
DOI:10.13610/j.cnki.1672-352x.20160512.014
URL
[本文引用: 1]
热岛效应是一种城市化进程中所产生的特有环境问题,是一个地区的气温高于周围地区的现象。为了揭示快速城市化地区热岛的时空变化特点,利用2014年的Landsat8 oli遥感数据,通过遥感算法反演合肥市地表温度,并对合肥市热岛分布及成因加以分析,同时分析了归一化植被指数(NDVI)、归一化建筑指数(NDBI)与热岛分布的关系,以及城市下垫面对热岛效应的影响,并对城市热场进行生态评价分析。结果表明,合肥市四季均存在热岛现象,热岛强度表现为夏季最强,最高温度达57.86℃,秋季次之,春季、冬季较弱。春、夏、秋3个季节热岛多集中在主城区,冬季热岛多分布在乡镇及裸土区,城区热岛强度较弱。热岛效应多集中在不透水面和裸土区,城市冷岛多出现在水体位置。城市热岛分布与归一化植被指数呈负相关关系,与归一化建筑指数呈正相关关系。改进半径法可以较好区分城市建成区,建成区与郊区温度分布存在明显差异。
Landsat8 OLI data-based analysis of spatial-temporal characteristics of heat island in Hefei
[J].
北京市热岛效应时空变化的HJ-1B监测分析
[J].
DOI:10.3724/SP.J.1047.2012.00474
URL
[本文引用: 1]
本文利用2008-2011年HJ-1B/CCD可见光-近红外数据,以及HJ-1B/IRS热红外数据,采用遥感算法反演北京市地表温度,并用MODIS地表温度产品对反演结果进行了初步验证。同时分析了北京市热岛效应的年际、年内变化趋势。另利用热场变异指数分析其空间分布特征,以及NDVI、NDBI与城市下垫面对热岛效应的影响。结果表明:(1)2008-2010年北京市热岛强度总体呈上升趋势,2011年有所缓解,4年热岛强度分别为:5.2℃、5.2℃、9.2℃、8.2℃;(2)北京市2010年四季存在明显热岛现象,夏季最强,春、秋次之,冬季最弱,四季热岛强度分别为8.2℃、9.4℃、9.2℃、4.3℃;(3)2008-2011年北京市热岛空间分布特征表明,房山区和大兴区的南部热岛效应逐年缓解,2011年昌平区热岛效应比前3年明显,植被和水体形成城市冷岛;(4)地表温度与NDVI呈明显负相关,与ND-BI呈正相关,城市热岛效应与下垫面类型存在明显相关性。
Monitoring spatio-temporal changes of heat island effect in Beijing based on HJ-1B
[J].
Analysis of urban heat island(UHI) in relation to normalized difference vegetation index(NDVI):A comparative study of Delhi and Mumbai
[J].
DOI:10.3390/environments2020125
URL
[本文引用: 1]
The formation and occurrence of urban heat island (UHI) is a result of rapid urbanization and associated concretization. Due to intensification of heat combined with high pollution levels, urban areas expose humans to unexpected health risks. In this context, the study aims at comparing the UHI in the two largest metropolitan cities of India, i.e., Delhi and Mumbai. The presence of surface UHI is analyzed using the Landsat 5 TM image of 5 May 2010 for Delhi and the 17 April 2010 image for Mumbai. The validation of the heat island is done in relation to the Normalized Difference Vegetation Index (NDVI) patterns. The study reveals that built-up and fallow lands record high temperatures, whereas the vegetated areas and water bodies exhibit lower temperatures. Delhi, an inland city, possesses mixed land use and the presence of substantial tree cover along roads; the Delhi Ridge forests and River Yamuna cutting across the city have a high influence in moderating the surface temperatures. The temperature reaches a maximum of 35 °C in West Delhi and a minimum of 24 °C in the east at the River Yamuna. Maximum temperature in East Delhi goes to 30 °C, except the border areas. North, Central and south Delhi have low temperatures (28 °C–31 °C), but the peripheral areas have high temperatures (36 °C–37 °C). The UHI is not very prominent in the case of Delhi. This is proven by the correlations of surface temperature with NDVI. South Delhi, New Delhi and areas close to River Yamuna have high NDVI and, therefore, record low temperatures. Mumbai, on the other hand, is a coastal city with lower tree cover than Delhi. The Borivilli National Park (BNP) is in the midst of dense horizontal and vertical growth of buildings. The UHI is much stronger where the heat is trapped that is, the built-up zones. There are four small rivers in Mumbai, which have low carrying capacity. In Mumbai suburban district, the areas adjoining the creeks, sea and the lakes act as heat sinks. The coastal areas in South Mumbai record temperatures of 28 °C–31 °C; the Bandra-Kurla Complex has a high range of temperature i.e., 31 °C–36 °C. The temperature witnessed at Chattrapati Shivaji International Airport is as high as 38 °C. The temperature is nearly 37 °C–38 °C in the Dorai region in the Mumbai suburban district. The BNP has varied vegetation density, and therefore, the temperature ranges from 27 °C–31 °C. Powai Lake, Tulsi Lake and other water bodies record the lowest temperatures (24 °C–26 °C). There exists a strong negative correlation between NDVI and UHI of Mumbai, owing to less coverage of green and vegetation areas.
广州市城市扩展及其城市热岛效应分析
[J].
DOI:10.3969/j.issn.1000-3177.2014.01.006
URL
[本文引用: 1]
位于珠江三角洲的广州市在城市化进程的推动下,城市空间快速扩展。本文利用1990年、2000年、2008年的Landsat遥感影像对广州市的城市扩展及其热环境效应进行了分析,采用IBI建筑指数和NDVI植被指数分别获取了建筑用地和植被信息,然后讨论了城市热环境与这些地表参数的定量关系。结果发现广州市建筑用地与地表温度呈指数型正相关关系,高比例建筑用地地区的升温要比低比例建筑用地地区大0.3℃;而植被则对地表温度起降温作用。总的看来,尽管1990年~2008年间广州城市建成区的面积持续扩张,但是其城市热岛效应并不是一直在增强,而是呈现出先增强后减弱的趋势。
Analysis of urban expansion and urban heat island effect in Guangzhou City
[J].
一种利用TM图像自动提取城镇用地信息的有效方法
[J].
An effective approach to automatically extract urban land-use from TM imagery
[J].
Validation of moderate resolution imaging spectroradiometer leaf area index product in croplands of Alpilles,France
[J].
DOI:10.1029/2004JD004860
URL
[本文引用: 1]
[1] This paper presents results of validating the Collection 4 Moderate Resolution Imaging Spectroradiometer (MODIS) leaf area index (LAI) product using LAI data collected in a 3 3 km agricultural (grasses and cereal crops) area near Avignon, France, and 30 m resolution Enhanced Thematic Mapper (ETM+) image. Estimates of the accuracy, precision, and uncertainty with which the ETM+ data convey information about LAI underlie the derivation of a 30 m resolution reference LAI map by accounting for both field measurement and satellite observation errors. The 30 m reference LAI was then extrapolated from sampling points to a 58 km2 area without loss in the quality and was degraded to a 1 km resolution LAI map. The latter was taken as a reference to assess the quality of the MODIS LAI product. Comparison of the reference and corresponding MODIS retrievals suggests that Collection 4 MODIS LAI is accurate to within an accuracy of 0.3 with a precision and uncertainty of 0.23 and 0.38, respectively. It was found that the Collection 3 MODIS land cover product, input to the Collection 4 operational LAI algorithm, misclassified the 58 km2 area as broadleaf crops. The use of correct biome type in the operational processing improves the accuracy in LAI by a factor of 2 with an almost unchanged precision and uncertainty. Our results also indicate that the retrieval of LAI from satellite data is an ill-posed problem; that is, small variations in input due to observation errors result in a very low precision of the desired parameter. Any retrieval technique based on a simple model inversion or empirical relationships is unable to generate stable retrievals. The use of information on input errors in the retrieval technique is necessary to generate solutions to the ill-posed problem. The MODIS operational LAI algorithm meets this requirement.
Spatial Econometrics:Methods and Models
[M].
Information theory and an extension of the maximum likelihood principle
[M]
