

0 引言
现有文献中,许多研究使用多种城市蔓延指标量化分析城市蔓延现象[4,7,10-13]。然而,大多数量化指标都是针对某一个国家或某一个城市,这些指标很依赖于社会经济指数及土地利用情况,但对该地区以外的其他地区适用度并不高。同时,大部分研究针对的是以美国为例的发达国家,很少有研究将目光放在其他发展中国家。现有研究者普遍认为,发达国家由于城市的郊区化,城市蔓延现象十分严重,并引起了许多已经证实的社会及环境问题; 相比之下,对于中国、非洲各国等发展中国家来说,城市的密度往往较高,城市蔓延的问题并不突出。然而,随着城镇化的不断推进,发展中国家的城市范围也在不断急速扩张,而城市内部的结构却并没有及时得到合理地调整。因此,对中国这样的发展中国家研究城市蔓延现象是非常必要且意义重大的。
随着大数据技术的不断发展,各种大尺度的空间数据库使得对大区域的研究成为可能,而从此类空间数据中提取合适的定量化指标对于研究城市蔓延现象十分重要。因此,本文基于美国国家海洋和大气管理局(National Oceanic and Atmospheric Administration,NOAA)发布的全球夜间灯光(night-time light,NTL)数据,设计了一系列可以反映城市群密度、发展分散度、多核心度及向心度的指标,这些指标可以从不同方面描述城市群的蔓延现象。同时,本文将这套指标应用于中国的城市群,并进行相应的比较和分析。基于NTL数据构建多维度指标体系,可为度量城市群的城市蔓延现象提供策略,通过设计的指标可研究中国城市群的蔓延现象,并对不同城市群区域做出对比分析。
1 研究区概况及数据源
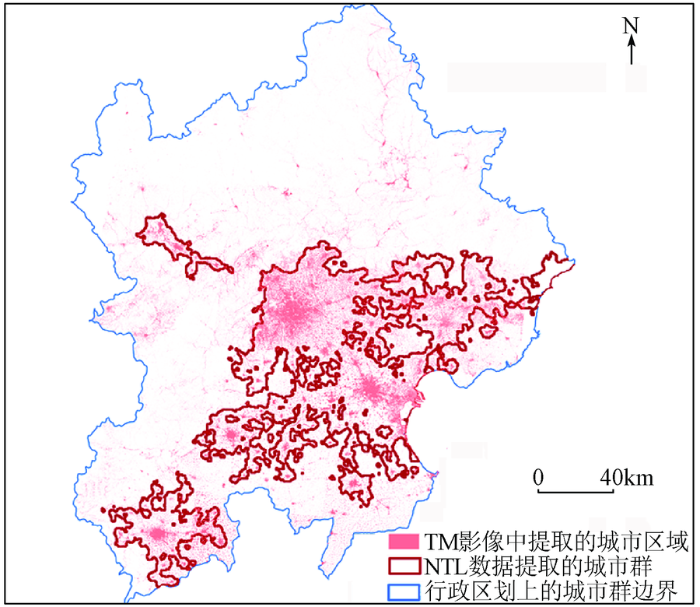
首先,从NTL图像中提取出城市群的边界范围。NTL数据能间接反映地表人类活动的强度,而利用连续的明亮区域可以勾勒出城市群的范围。一般情况下,像元值小于12的灯光来自农村区域,因此,本文以12为阈值,将中国划分为城市与非城市区域,并挑选其中面积大于1 000 km2的特大城市区域为城市群区域。另外,与这些城市群距离10 km以内的城市斑块将与该城市群合并,并与从TM影像中提取的城市区域进行对比。采用本文方法,可分辨相互连接的城市区域,且得到比城市群的行政边界更为合理的城市群边界。以京津冀为例的城市群边界如图1所示。
图1
2 城市群蔓延指标
NTL数据可从以下4方面描述城市蔓延现象: ①城市群周边存在密度很低的郊区; ②城市群中城市的发展是分散的; ③城市群呈多核心状态; ④城市群中城市的发展并不是向城市中心集中。这几个方面可由密度(intensity,I)、发展分散度(coefficient of variation,CV)、多核心度(poly-centers,PC)和向心度(centrality,CT)4个指标描述(表1)。
表1 城市群蔓延指标
Tab.1
| 指标名称 | 定义 | 计算方式 |
|---|---|---|
| 密度(I) | 城市周边郊区的发展强度 | 郊区的平均亮度 |
| 发展分散度(CV) | 描述城市发展的分散程度 | 变异系数 |
| 多核心度(PC) | 多中心的程度 | NTL三维模型的山顶点个数/区域面积 |
| 向心度(CT) | 城市的发展向城市中心集中的程度 | 像元值大于阈值的像元比例的累加和 |
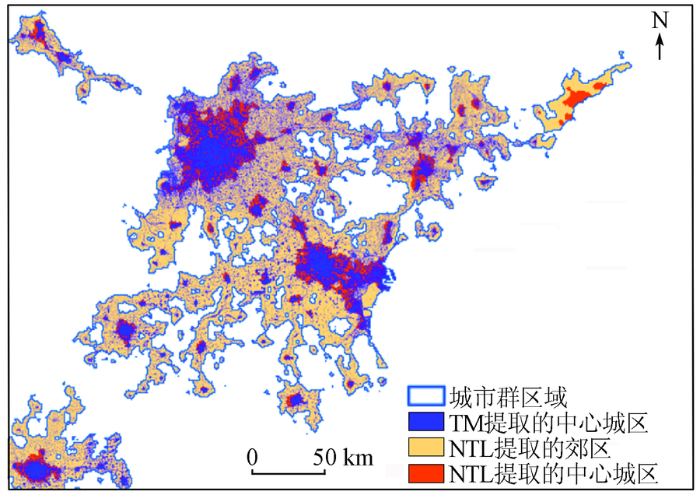
2.1 密度
密度是衡量城市蔓延不可或缺的指标。在以往的研究中,Ewing[18]提出当土地转变成非农用地或者非自然用地的速度超过了人口增长的速度,蔓延便会发生。换言之,城市蔓延可被认为是低密度的开发,可以是低密度的人口,也可以是低密度的城镇化地区。在此研究中,城市的密度可以由NTL的平均值来表示。
图2
2.2 发展分散度
发展分散度表示城市发展趋势是集中的还是分散的。本文中用NTL像元值的变异系数计算发展分散度,即
式中: CVm为第m个城市群的发展分散度; n为该城市群中的像元个数; DNi为第i个像元的像元值; DNu为该城市群的像元平均值。CV越大,表示该城市群中的城市发展越集中,也代表着城市蔓延程度越低; 相反,CV越小,表示城市发展越分散,也代表着城市蔓延程度越高。
2.3 多核心度
图3
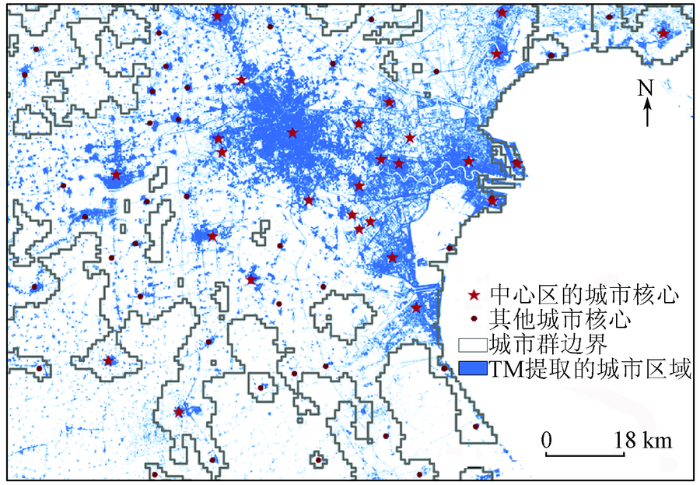
用ArcGIS提取的多核心度与用TM提取的城市区域的对比结果表明,这些核心能够客观地表示城市中的小中心及大中心所处位置。
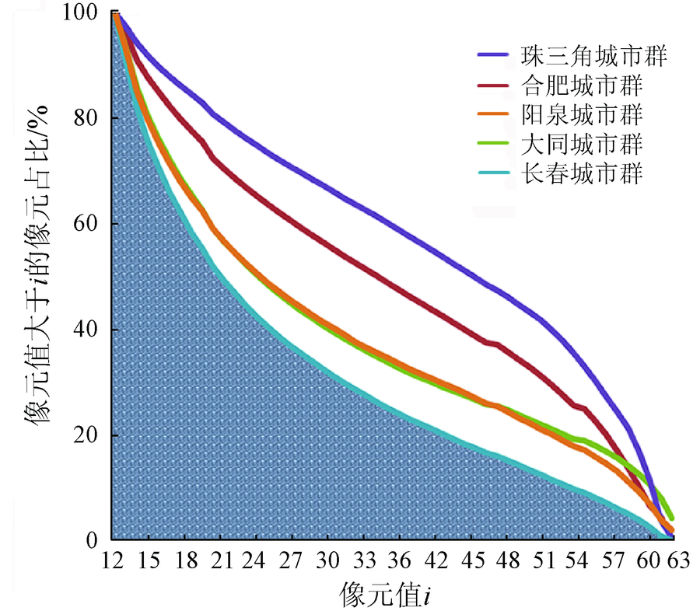
2.4 向心度
向心度描述了城市群内的城市在多大程度上向城市的中心地区发展。这个指标可以利用NTL数据的梯度变化来表示,即
CT=
式中Pi为像元值大于i的像元数所占城市群所有像元数的比例。
图4以更直观的方式对5个示例城市群的向心度的计算做出了描述,弧线下的面积越大,代表向心度越高,也代表城市蔓延的程度越低; 相反,弧线下的面积越小,代表向心度越低,也代表城市蔓延的程度越高。
图4
3 中国城市群的城市蔓延
应用上述方法,对中国城市群的城市蔓延状况进行了研究。在研究中,共提取了50个城市群区域,包括5个面积超过10 000 km2的特大城市群、8个面积在5 000~10 000 km2之间的大城市群、14个面积在2 000~5 000 km2之间的中等城市群和23个面积在1 000~2 000 km2之间的小城市群,并为每个城市群设定了名称。利用2010年的NTL数据对城市群情况进行了研究。
首先使用这50个城市群对设计的几个指标进行相关性分析(表2),结果显示这几个指标的值与该城市群的面积(Area)无明显的相关关系; 而在描述城市蔓延的4个指标中也不存在很强的相关性,说明这4个指标都是不可互相替代的。
表2 指标间的相关系数①
Tab.2
| 指标 | Area | I | CV | PC | CT |
|---|---|---|---|---|---|
| Area | 1.00 | 0.21 | -0.168 | -0.001 | 0.205 |
| I | 1.00 | -0.780 | 0.040 | 0.530 | |
| CV | 1.000 | 0.000 | -0.420 | ||
| PC | 1.000 | 0.160 | |||
| CT | 1.000 |
①显著性<0.01。
对每个指标正向化(当每个指标值越大时,代表蔓延程度越小),并采用Z-score进行标准化后,使用相同的权重将其相加,计算出一个整体的城市蔓延指数——综合蔓延度(CS)。CS越小,代表城市蔓延的程度越大。表3列出了中国的50个城市群各指标的具体计算结果。
表3 城市蔓延指标计算结果
Tab.3
| 城市群名称 | 面积/km2 | I | CV | PC | CT | CS |
|---|---|---|---|---|---|---|
| 长江三角洲 | >10 000 | 1.42 | -1.15 | -0.25 | 1.31 | 1.33 |
| 北京—天津—唐山 | -0.54 | 0.86 | 0.20 | 0.03 | 0.55 | |
| 珠江三角洲 | 2.41 | -2.46 | -0.68 | 2.40 | 1.67 | |
| 中原 | -0.81 | 0.69 | 0.40 | -0.98 | -0.71 | |
| 山东半岛 | -0.31 | 0.66 | -0.30 | -0.02 | 0.03 | |
| 辽东半岛 | 5 000~10 000 | -0.23 | 0.53 | -0.50 | 0.26 | 0.07 |
| 济宁—枣庄 | -0.87 | 0.83 | 0.63 | -1.05 | -0.47 | |
| 太原—临汾 | -0.66 | 0.07 | 0.28 | -0.97 | -1.29 | |
| 海峡西岸 | 1.59 | -1.25 | 0.24 | 0.44 | 1.02 | |
| 成都 | -0.22 | 0.60 | 0.88 | -0.59 | 0.68 | |
| 邯郸 | -0.67 | 0.21 | 0.76 | -1.11 | -0.82 | |
| 西安 | -0.62 | 0.99 | -0.40 | -0.12 | -0.15 | |
| 台州 | 1.72 | -1.58 | 0.50 | 0.24 | 0.88 | |
| 石家庄 | 2 000~5 000 | -1.69 | 1.56 | 0.77 | -1.43 | -0.79 |
| 武汉 | 0.67 | -0.31 | 1.04 | 0.29 | 1.70 | |
| 长治—晋城 | -0.47 | -0.63 | 0.47 | -1.20 | -1.83 | |
| 潮汕 | 1.70 | -1.47 | 0.64 | 0.57 | 1.44 | |
| 青岛 | 0.43 | -0.35 | -0.83 | 1.30 | 0.54 | |
| 烟台—威海 | -0.01 | 0.13 | -1.26 | 0.47 | -0.68 | |
| 长春 | -0.79 | 1.25 | 0.47 | 0.09 | 1.02 | |
| 重庆 | 0.81 | -0.83 | 1.66 | -0.07 | 1.58 | |
| 长沙 | 1.46 | -1.13 | 0.25 | 0.47 | 1.06 | |
| 哈尔滨 | -0.48 | 0.86 | 0.51 | 0.56 | 1.45 | |
| 大庆 | 1.48 | -1.20 | -0.63 | 1.89 | 1.53 | |
| 昆明 | 0.11 | 0.02 | 0.87 | 0.76 | 1.76 | |
| 大同 | -0.53 | 0.15 | 0.77 | -0.63 | -0.24 | |
| 乌鲁木齐 | 0.13 | 0.25 | -0.55 | 0.80 | 0.63 | |
| 大连 | 1 000~2 000 | 0.49 | -0.37 | -3.31 | 1.22 | -1.98 |
| 内蒙古 | -1.13 | -1.10 | 0.61 | -1.04 | -2.66 | |
| 银川 | -0.54 | 0.95 | -0.59 | 0.00 | -0.18 | |
| 武汉 | 0.66 | -0.99 | -1.12 | -0.21 | -1.66 | |
| 合肥 | 0.76 | -0.74 | 0.31 | 1.67 | 2.00 | |
| 连云港 | -0.37 | 0.52 | -0.29 | -0.57 | -0.71 | |
| 柳州 | -1.39 | 1.50 | 1.42 | -1.34 | 0.19 | |
| 燕南 | 0.92 | -1.10 | -2.10 | -0.13 | -2.41 | |
| 张家口 | -1.08 | 1.47 | 0.23 | -0.70 | -0.08 | |
| 包头 | -0.18 | 0.41 | 0.75 | 0.86 | 1.84 | |
| 葫芦岛 | -0.52 | 0.77 | -2.54 | -0.45 | -2.73 | |
| 淮南 | -0.56 | -0.42 | 0.06 | -1.40 | -2.32 | |
| 南昌 | 1.13 | -0.65 | 1.30 | 0.68 | 2.46 | |
| 吕梁 | -1.31 | 0.33 | -0.13 | -1.65 | -2.76 | |
| 兰州 | -0.33 | 0.63 | 0.57 | 0.34 | 1.21 | |
| 呼和浩特 | -0.28 | 0.68 | 0.54 | 0.66 | 1.60 | |
| 南宁 | 1.55 | -1.35 | 1.23 | 1.50 | 2.93 | |
| 贵阳 | 0.84 | -0.63 | 0.39 | 0.02 | 0.61 | |
| 淮安 | -0.39 | 0.71 | -2.04 | 0.34 | -1.38 | |
| 湛江 | -2.12 | 1.99 | -0.46 | -1.74 | -2.33 | |
| 吉林 | -0.03 | 0.51 | 0.32 | 0.67 | 1.46 | |
| 西宁 | -0.08 | 0.40 | -0.53 | -0.29 | -0.51 | |
| 阳泉 | -0.75 | 0.27 | -0.58 | -1.17 | -2.22 |
上述4个指标有助于了解每个城市群在城市空间中存在的问题,例如蔓延现象严重的湛江城市群,其低I表明该城市群在郊区的低密度开发情况十分严重; 南宁城市群的低CV表明该城市群的发展非常分散,缺乏集中性; 大连城市群的低PC表明该城市群的多核心化过于严重; 而吕梁城市群的低CT则表明该城市群的发展没有向城市中心集中。
进一步以中国最大的3个城市群——长江三角洲、北京—天津—唐山城市群及珠江三角洲为例,珠江三角洲的CS最高,说明空间发展格局较为紧凑; 北京—天津—唐山城市群的CS最低,说明空间发展格局蔓延程度最高。具体分析3个城市群的各项指标可以看出,就郊区密度而言,北京—天津—唐山城市群十分低,说明该地区的发展主要以低密度的扩张为主,有非常大范围的稀疏边缘带。相比之下,珠江三角洲和长江三角洲的郊区密度较高,说明郊区的土地被合理和有效利用,城市边缘带得到了充分发展。
在CV和PC方面,北京—天津—唐山城市群表现出较高的CV和较低程度的PC,而珠江三角洲和长江三角洲表现出较高的CV及较高程度的PC。此结果与现有文献中反映的3个城市群的发展情况基本吻合。北京—天津—唐山城市群的中心城市优势较为明显; 除中心城市外,其他城市的发展程度较低,发展主要集中在几个大城市中心,小城市中心无法形成与发展。相比之下,珠江三角洲和长江三角洲的中小城市集群在经济发展及城镇化过程中得到了很大发展,形成了遍地开花的局面,因此城市的发展并未集中在原有的大城市中心,城市发展较为分散。
在CT方面,与北京—天津—唐山城市群相比,珠江三角洲和长江三角洲的CT较高,说明北京—天津—唐山城市群的城市中心尚未发挥出城市中心的带动作用,发展没有向着原有的城市中心集中。
通过以上分析可以看出,本文所设计的城市蔓延指标能够合理并准确反映出城市群的空间形态信息,并可用于度量城市群的城市蔓延程度。同时,该套指标能够从4个方面反映城市群的空间格局特点,其结果与实际情况十分吻合。由此可见,这套指标能够为城市规划和政策制定部门找出城市群发展所存在的具体问题,并进行有针对性的处理。
4 结论
1)本文通过从夜间灯光(NTL)图像中提取的4项指标研究城市的扩张现象,这些指标能够从密度、发展分散度、多核心度和向心度4个方面反映城市群的城市蔓延水平。实验证明,这些指标总体上相互独立,易于计算,并可针对大区域进行对比研究。
2)然而,这些指标仍然存在着局限性。首先,NTL数据的像元值范围仅在0~63之间,且存在着过饱和现象,因此指标值会受到影响; 其次,这些指标尚无法从更深入的城市功能及社会经济角度去反映城市蔓延现象,例如城市群中的城市混合利用程度及交通交互程度。因此,建议结合此指标集与其他相关指标综合进行城市蔓延现象的研究。
3)对中国城市群的城市蔓延现象进行研究的结果表明,中国城市群存在不同程度的蔓延现象,并且每个城市群都存在不同的问题。在今后的研究中,可以根据本文的结果对中国各城市群的城市蔓延现象进行深入探讨。
4)本文的研究结果可以为城市规划和政策制定部门提供十分重要的信息,以防止城市蔓延现象的持续发生,并使城市群能以可持续的方式发展。
参考文献
The fundamental challenge in measuring sprawl:Which land should be considered?
[J].
DOI:10.1111/j.0033-0124.2005.00462.x
URL
[本文引用: 1]

Abstract Lack of agreement on how to define and measure sprawl has hampered development of policy related to its causes and consequences. We question previous work for two reasons: the use of study areas that overbound or underbound sprawl landscapes, and the failure to account for land unavailable for development. We formulate “extended urban areas,” based on housing density and commuting patterns and argue that they represent a preferable geographic basis for measuring sprawl. We operationalize with satellite imagery a way for measuring land unavailable for development in these areas. We then compute five measures of urban development using the National Land Cover Data Base and decennial census data to assess the extent of sprawl in the extended urban areas of Atlanta, Baltimore, Boston, Los Angeles, and Washington. Our sensitivity analyses reveal that the measurement of sprawl critically depends on which land area forms the basis of the analysis, and, to a lesser degree, how one accounts for land unavailable for development.
Framing Dispersal:Urban Strategies for Mexico City’s Sprawl
[D].
Towards a new epistemology of the urban?
[J].
DOI:10.1080/13604813.2015.1014712
URL
[本文引用: 1]
New forms of urbanization are unfolding around the world that challenge inherited conceptions of the urban as a fixed, bounded and universally generalizable settlement type. Meanwhile, debates on the urban question continue to proliferate and intensify within the social sciences, the planning and design disciplines, and in everyday political struggles. Against this background, this paper revisits the question of the epistemology of the urban: through what categories, methods and cartographies should urban life be understood? After surveying some of the major contemporary mainstream and critical responses to this question, we argue for a radical rethinking of inherited epistemological assumptions regarding the urban and urbanization. Building upon reflexive approaches to critical social theory and our own ongoing research on planetary urbanization, we present a new epistemology of the urban in a series of seven theses. This epistemological framework is intended to clarify the intellectual and political stakes of contemporary debates on the urban question and to offer an analytical basis for deciphering the rapidly changing geographies of urbanization and urban struggle under early 21st-century capitalism. Our arguments are intended to ignite and advance further debate on the epistemological foundations for critical urban theory and practice today.
Urban sprawl metrics:An analysis of global urban expansion using GIS
[C]//
Urban sprawl:Metrics,dynamics and modelling using GIS
[J].
DOI:10.1016/j.jag.2003.08.002
URL
[本文引用: 1]
Urban sprawl refers to the extent of urbanisation, which is a global phenomenon mainly driven by population growth and large scale migration. In developing countries like India, where the population is over one billion, one-sixth of the world population, urban sprawl is taking its toll on the natural resources at an alarming pace. Urban planners require information related to the rate of growth, pattern and extent of sprawl to provide basic amenities such as water, sanitation, electricity, etc. In the absence of such information, most of the sprawl areas lack basic infrastructure facilities. Pattern and extent of sprawl could be modelled with the help of spatial and temporal data. GIS and remote sensing data along with collateral data help in analysing the growth, pattern and extent of sprawl. With the spatial and temporal analyses along with modelling it was possible to identify the pattern of sprawl and subsequently predict the nature of future sprawl. This paper brings out the extent of sprawl taking place over a period of nearly three decades using GIS and Remote Sensing. The study also attempts to describe some of the landscape metrics required for quantifying sprawl. For understanding and modelling this dynamic phenomenon, prominent causative factors are considered.
Urban sprawl:Diagnosis and remedies
[J].DOI:10.1177/016001700761012710 URL [本文引用: 1]
Wrestling sprawl to the ground: Defining and measuring an elusive concept
[J].
DOI:10.1080/10511482.2001.9521426
URL
[本文引用: 3]
The literature on urban sprawl confuses causes, consequences, and conditions. This article presents a conceptual definition of sprawl based on eight distinct dimensions of land use patterns: density, continuity, concentration, clustering, centrality, nuclearity mixed uses, and proximity. Sprawl is defined as a condition of land use that is represented by low values on one or more of these dimensions. Each dimension is operationally defined and tested in 13 urbanized areas. Results for six dimensions are reported for each area, and an initial comparison of the extent of sprawl in the 13 areas is provided. The test confirms the utility of the approach and suggests that a clearer conceptual and operational definition can facilitate research on the causes and consequences of sprawl.
Relationship between urban sprawl and physical activity,obesity,and morbidity
[J].
DOI:10.1007/978-0-387-73412-5_37
URL
[本文引用: 1]
Purpose To determine the relationship between urban sprawl, health, and health-related behaviors. Design Cross-sectional analysis using hierarchical modeling to relate characteristics of individuals and places to levels of physical activity, obesity, body mass index (BMI), hypertension, diabetes, and coronary heart disease. Setting U.S. counties (448) and metropolitan areas (83). Subjects Adults (n = 206,992) from pooled 1998, 1999, and 2000 Behavioral Risk Factor Surveillance System (BRFSS). Measures Sprawl indices, derived with principal components analysis from census and other data, served as independent variables. Self-reported behavior and health status from BRFSS served as dependent variables. Results After controlling for demographic and behavioral covariates, the county sprawl index had small but significant associations with minutes walked (p = .004), obesity (p < .001), BMI (p = .005), and hypertension (p = .018). Residents of sprawling counties were likely to walk less during leisure time, weigh more, and have greater prevalence of hypertension than residents of compact counties. At the metropolitan level, sprawl was similarly associated with minutes walked (p = .04) but not with the other variables. Conclusion This ecologic study reveals that urban form could be significantly associated with some forms of physical activity and some health outcomes. More research is needed to refine measures of urban form, improve measures of physical activity, and control for other individual and environmental influences on physical activity, obesity, and related health outcomes.
Urban sprawl and risk for being overweight or obese
[J].DOI:10.2105/AJPH.94.9.1574 URL [本文引用: 1]
Characterizing urban sprawl using multi-stage remote sensing images and landscape metrics
[J].
DOI:10.1016/j.compenvurbsys.2005.09.002
URL
[本文引用: 1]
This study intends to explore the spatial analytical methods to identify both general trends and more subtle patterns of urban land changes. Landsat imagery of metropolitan Kansas City, USA was used to generate time series of land cover data over the past three decades. Based on remotely sensed land cover data, landscape metrics were calculated. Both the remotely sensed data and landscape metrics were used to characterize long-term trends and patterns of urban sprawl. Land cover change analyses at the metropolitan, county, and city levels reveal that over the past three decades the significant increase of built-up land in the study area was mainly at the expense of non-forest vegetation cover. The spatial and temporal heterogeneity of the land cover changes allowed the identification of fast and slow sprawling areas. The landscape metrics were analyzed across jurisdictional levels to understand the effects of the built-up expansion on the forestland and non-forest vegetation cover. The results of the analysis suggest that at the metropolitan level both the areas of non-forest vegetation and the forestland became more fragmented due to development while large forest patches were less affected. Metrics statistics show that this landscape effect occurred moderately at the county level, while it could be only weakly identified at the city level, suggesting a scale effect that the landscape response of urbanization can be better revealed within larger spatial units (e.g., a metropolitan area or a county as compared to a city). The interpretation of the built-up patch density metrics helped identify different stages of urbanization in two major urban sprawl directions of the metropolitan area. Land consumption indices (LCI) were devised to relate the remotely sensed built-up growth to changes in housing and commercial constructions as major driving factors, providing an effective measure to compare and characterize urban sprawl across jurisdictional boundaries and time periods.
Measuring urban form: Is portland winning the war on sprawl?
[J].
DOI:10.1080/01944360408976371
URL
Although many have written about urban sprawl, few have sought to measure it. In this article, we present several quantitative measures of urban form and compute these for neighborhoods of varying age in Washington County, the western portion of the Portland, Oregon, metropolitan area. Our results suggest (1) neighborhoods in Washington County have increased in single-family dwelling unit density since the 1960s; (2) internal street connectivity and pedestrian access to commercial areas and bus stops have improved since the early 1990s; (3) external connectivity continues to decline; and (4) the mixing of land uses remains limited. We conclude that while several measures appear to be improving, Portland's war on sprawl is not yet won.
Measurement and monitoring of urban sprawl in a rapidly growing region using entropy
[J].
DOI:10.1016/S0031-0182(00)00158-9
URL
Rapid urban development and dramatic change of landscape have been recently witnessed in some developing countries as a result of rapid economic development. The measurement and monitoring of land-use changes in these areas are crucial to government officials and planners who urgently need updated information for planning and management purposes. This paper examines the use of entropy in the measurement and monitoring of urban sprawl by the integration of remote sensing and GIS. The advantages of the entropy method are its simplicity and easy integration with GIS. Thee measurement of entropy is devised based on two locational factors-distances from town centers and roads-to capture and reveal spatial patterns of urban sprawl. The entropy space can be conveniently used to differentiate various kinds of urban growth patterns. The application of the method in the Pearl River Delta, one of the fastest growing regions in China, has demonstrated that it is very useful and effective for the monitoring of urban sprawl. It provides a useful tool for the quantitative measurement that is much needed for rapidly growing regions in identifying the spatial variations and temporal changes of urban sprawl patterns.
Urban sprawl measurement from remote sensing data
[J].
DOI:10.1016/j.apgeog.2010.02.002
URL
[本文引用: 1]
Conceptual ambiguity of sprawl and lack of consensus among researchers have made the measurement of urban sprawl very difficult, especially from remote sensing data. There are many scales and parameters that are in use to quantify the sprawl; however, many of them are suffered from several limitations. The objective of this article is to document and discuss these sprawl measurement techniques along with their merits and demerits towards the absolute acceptance or rejection. The paper also highlights the scope and direction of future research for the measurement of urban sprawl.
DMSP/OLS nighttime light data version 4,National Geophysical Data Center
[EB/OL].[
Spatial scaling of stable night lights
[J].
DOI:10.1016/j.rse.2010.08.021
URL
[本文引用: 1]
City size distributions, defined on the basis of population, are often described by power laws. Zipf's Law states that the exponent of the power law for rank-size distributions of cities is near 1. Verification of power law scaling for city size distributions at continental and global scales is complicated by small sample sizes, inappropriate estimation techniques, inconsistent definitions of urban extent and variations in the accuracy and spatial resolution of census administrative units. We attempt to circumvent some of these complications by using a continuous spatial proxy for anthropogenic development and treat it as a spatial complement to population distribution. We quantify the linearity and exponent of the rank-size distribution of spatially contiguous patches of stable night light over a range of brightnesses corresponding to different intensities of development. Temporally stable night lights, as measured by the Defense Meteorological Satellite Program-Operational Line Scanner (DMSP-OLS), provide a unique proxy for anthropogenic development. Brightness and spatial extent of emitted light are correlated to population density (Sutton et al., 2001), built area density (Elvidge et al., 2007c) and economic activity ( Doll et al., 2006 and Henderson et al., 2009 ) at global scales and within specific countries. Using a variable brightness threshold to derive spatial extent of developed land area eliminates the complication of administrative definitions of urban extent and makes it possible to test Zipf's Law in the spatial dimension for a wide range of anthropogenic development. Higher brightness thresholds generally correspond to more intense development while lower thresholds extend the lighted area to include smaller settlements and less intensively developed peri-urban and agricultural areas. Using both Ordinary Least Squares (OLS) and Maximum Likelihood Estimation (MLE) to estimate power law linearity and exponent of the resulting rank-size distributions across a range of upper tail cutoffs, we consistently find statistically significant exponents in the range 0.95 to 1.11 with an abrupt transition to very large, extensively connected, spatial networks of development near the low light detection limit of the sensor. This range of exponents and transition are observed at both continental and global scales. The results suggest that Zipf's Law also holds for spatial extent of anthropogenic development across a range of intensities at both continental and global scales. The implication is that the dynamics of urban growth and development may be represented as spatial phase transitions when the spatial extent and intensity of development are treated as continuous variables rather than discrete entities.
Estimating CO2 (carbon dioxide) emissions at urban scales by DMSP/OLS (defense meteorological satellite program’s operational linescan system) nighttime light imagery:Methodological challenges and a case study for China
[J].DOI:10.1016/j.energy.2014.04.103 URL [本文引用: 1]
Determining global population distribution:Methods,applications and data
[J].DOI:10.1016/S0065-308X(05)62004-0 URL [本文引用: 1]
Is Los Angeles-style sprawl desirable?
[J].
DOI:10.1080/01944369708975728
URL
[本文引用: 1]
This article reviews the literature on characteristics, causes, and costs of alternative development patterns. In doing so it debunks arguments by Gordon and Richardson in favor of Los Angeles-style sprawl. Sprawl is not suburbanization generally, but rather forms of suburban development that lack accessibility and open space. Sprawl is not a natural response to market forces, but a product of subsidies and other market imperfections. The costs of sprawl are borne by all of us, not just those creating it, and include inflated public spending, loss of resource lands, and a waning sense of community. The only realistic cure for sprawl is active planning of the sort practiced almost everywhere except the United States (and beginning to appear here out of necessity).
A study of urban expansion of prefectural-level cities in South China using night-time light images
[J].
DOI:10.1080/01431161.2015.1101650
URL
[本文引用: 1]
Because of its rapid economic development, China has been undergoing a dramatic urbanization process in recent decades. Such a process can be reflected by urban expansion, which can be represented by the change in urban built-up areas. In the literature, very little has been discussed on the extraction of built-up areas with a high frequency of acquisition for a large region. This article introduces a methodology to extract built-up areas using night-time stable light data. An improved calibration method is formulated to first eliminate the discrepancies across different satellites and years. A thresholding technique utilizing the sudden jump method is then employed to extract built-up areas for each prefectural city in each year. This method selects the best threshold by scrutinizing the sudden jump in the natural logarithms of the areas under different digital number (DN) thresholds. Moreover, the urbanization process of South China is examined using the extracted time series of built-up areas. The results show that such extracted time series represent changes in urban areas rather well when compared with the Thematic Mapper (TM) images, and a significant linear relationship between the extracted built-up areas and those of the land-use map and the China City Statistical Yearbook (CCSY) has also been established. Moreover, the empirical analyses also reveal that urban expansion took place in all cities from 1992 to 2010, especially in coastal cities, capital cities, and cities in the special economic zones.
