

0 引言
近几十年来,在全球气候变化的背景下干旱频繁发生,其影响范围之广,持续时间之长,受灾程度之重都十分罕见。据统计,每年因旱灾造成的全球经济损失高达60~80亿美元,远远超过了其他灾害[1]。我国是一个农业旱灾频发的国家,1950—2008年间,平均每年受旱面积为2 157万hm2,成灾面积为956万hm2,因旱灾损失粮食为158万t。而且干旱灾害发生次数逐年增加,特别是近几年接连不断发生在西南地区、山东省和长江中下游地区的特大干旱,给农业生产和经济发展带来巨大损失[2,3]。目前,利用遥感技术加强旱情实时监测已成为一个迫切的需求[4]。学者们针对各类卫星遥感数据,通过获取各类地表理化性质[5,6,7,8,9]监测旱情状况及变化,其中土壤含水量是反映干旱的一个最重要也是最直接的指标。通过遥感反演土壤含水量是干旱遥感监测业务中必不可少的环节。
遥感传感器在成像过程中,不可避免地会受到云、雪、气溶胶和传感器自身性能等因素的影响,使得遥感数据在空间上呈现不连续,即存在缺失数据的情况[10]。在反演土壤含水量时,若不能修补缺失数据将严重影响反演结果的实用价值与成果图件的美观效果,限制了产品的深入应用[11,12]。现有数据插补方法主要分为2大类。第一类方法是采用滤波法根据时间序列数据估算缺失数据。简易可行的一种滤波方法是Holben提出的最大值合成法[13],即按照事先规定的时间间隔,将间隔内序列中各点按数值大小排序,选取各点序列中最大值作为新图像值。另一种效果较好的滤波方法是最佳指数斜率提取法[14,15],采用滑动时间窗口识别时间序列值中的突变点,并替代噪声值。此后又相继出现了经验正交函数分解法[16]、时间窗口线性内插法[17]、基于非对称的高斯函数拟合法[18]、Savitzky-Golay滤波法[19]和局部最大值拟合法[20]等滤波方法。此类方法虽然具有较高的稳定性和准确性,但依赖于时间序列遥感数据,增加了产品生产的经济成本。并且很多遥感产品往往不具备完整的历史遥感资料,使得该方法的应用受到了限制。另一类方法是采用空间插值法根据邻近数据估算缺失数据。冯益明等和俞晓群等在解译遥感影像和分析海表叶绿素时利用Kriging插值法恢复了缺失数据[21,22];杨金红等研究了利用线性插值法去除MODIS遥感影像中的条带噪声[23]。此外,还提出了邻行插值法[24]、GIS辅助数据下的影像缺失信息恢复方法[25]、基于纹理合成技术的数据修补方法[26]和矩匹配法[27]等典型的遥感缺失数据恢复方法。但这些方法只适用于特定数据源或图像条件,难以应用于业务部门的推广应用中。
针对上述各类方法存在的局限性,本文旨在围绕土壤含水量遥感反演中的数据缺失问题,提出利用最优插值法,结合气象站点的实测数据,对缺失像元进行插值与填充,为干旱监测业务流程的完整性及准确性提供技术支持。
1 最优插值法
本文将最优插值应用于土壤含水量Z的插补中,用下标a表示分析值,g表示初始值,ob表示气象站点处土壤含水量的观测值,下标i表示目标格点的序号,k表示气象台站的序号,则将离散的气象站的观测数据转化成均匀分布的网格分析值时的线性内插公式为
Zai=
式中Pk为第k个气象台站的权重因子。该公式表示每个格点的分析值
再假设
δkl=
令E=<
E=mii-2
式中mii为i点初始值的方差,可以认为是常数。将式(4)左右同时除以mii,并令E'=E/mii,μik=mik/mii,ηk=
E'=1-2
最优插值的本质就是要寻找出使分析误差方差达到最小时的权重因子Pk,根据∂E'/∂Pk=0,(k=1,2,…,n),可导出
从而可得
E'=1-
于是Pk可以由式(6)求得,其中μik根据需求选定某种函数形式。
假设μkl随k和l这2点间的距离标量r呈指数衰减,相关系数可表示为
μkl=exp(-rkl/a) 。 (8)
式中a为常数系数,其取值越大,相关系数趋于0的距离(最大影响距离)也越大,此时对于密集的近处测站,它们的相关系数值相差很小,就不能很好反映出相关系数随距离变化的特性,最优权重系数也近似相等,将失去求相关的意义,故a的取值要根据各个测站的实际分布情况而定。本文研究实例中a取1 500 km。
2 研究方法
2.1 缺失像元识别
在土壤含水量的遥感反演过程中,遥感图像上云、雪覆盖等因素会导致反演结果出现缺失像素值。对缺失像元进行插补前需要识别缺失像元的空间位置。反演土壤含水量的干旱指数DI可表示为各类参数变量的函数,即
DI=f(X1,X2,…,Xn) , (9)
式中Xi为计算干旱指数DI所使用的遥感或物理参数变量,如不同波段的地表反射率、植被指数和地表温度等。具体方法如下:
1)对于每个变量Xi,生成一幅标记有效值区域的掩模影像Mas
2)合成最终掩模影像,对于任一像素,掩模影像合成公式为
Maskk=Mas
3)标记干旱指数DI中的缺失像元,令
DIfinalk=DIk Maskk+bgValue (1-Maskk) , (11)
式中: DIk为第k个像素处直接计算而得的干旱指数值; DIfinalk为最终的干旱指数值; bgValue为干旱指数的缺失像元填充值(如-999)。此时得到的干旱指数结果中,数值为bgValue的像元即为缺失像元。
2.2 缺失数据插补
最优插值法的核心是利用观测站点的观测值与初估值的偏差修订目标格点的值。针对干旱监测的特点,本文以气象站点为观测站点,以气象站的土壤体积含水量实测值为观测值。基于最优插值的缺失数据插补方法包括2个步骤:
1)初始背景场的构建。利用各气象站点Stationk(k=1,2,…,n)历年实测数据,计算气象站处土壤体积含水量的平均值ck,通过二阶反距离权重法插值构建土壤体积含水量的初始背景场,对于任一像元i,土壤体积含水量的初估值为
ci=
Pk,i=
式中: Pk,i为二阶反距离权重; Dk,i为第k个站点离像元i的距离。
2)缺失数据的填充。土壤含水量产品常以等时间间隔或较密集时相生产,但气象站点的实测数据可能缺少部分时期的数据。因此,在完成初始背景场的构建后,需根据不同时相的气象站点实测数据的完整性确定站点观测值的选择策略。气象站点处的土壤含水量值包含实测土壤水分值和遥感反演土壤水分值2类。本文采用如下选择策略,反演某时相的产品时,当具有实测土壤水分值的站点数量达到阈值(本文取8)时,则以实测土壤水分值作为观测值
确定站点观测值选择策略后,便可对每个缺失像元,根据式(5)逐一计算最优插值的权重P,最后根据式(1)便可得到缺失像元的插值结果。
3 研究实例
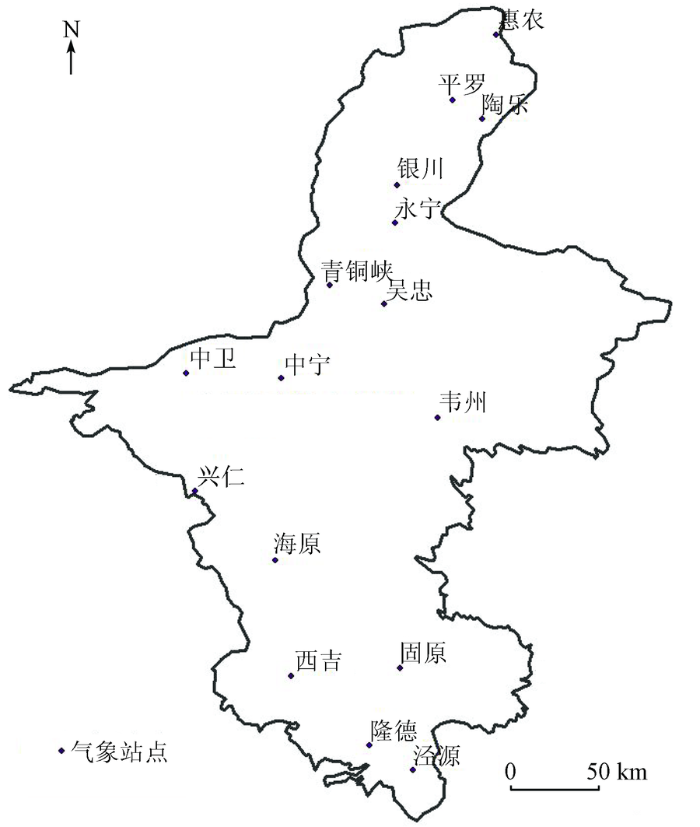
3.1 研究区及数据源概况
本文以中国西北的宁夏回族自治区为实验区(如图1所示),使用该区域内的MODIS地表反射率产品(MOD09A1)和反照率产品(MCD43B3),由美国NASA的EOS数据中心(https://wist.echo.nasa.gov/wist-bin/api/ims.cgi)下载,数据产品的时相为2001年3—9月间,是宁夏地区主要农作物的生长季节。使用前将原始数据转换为UTM投影,由红光波段与近红外波段计算归一化植被指数(normalized difference vegetation index,NDVI),构建基于NDVI-Albedo特征空间的植被条件反射率干旱指数(vegetation condition albedo drought index,VCADI
图1
3.2 缺失数据插补效果分析
本文选取了具有不同程度缺失数据的8个时相土壤体积含水量结果,即2001年的第97,105,113,153,161,185,249和257天的数据。应用本文方法,以16个气象台站的监测数据和遥感反演数据为基础,识别缺失像元并插补缺失数据。图2展示了应用插补方法恢复缺失像元前(左)后(右)的对比效果。
图2
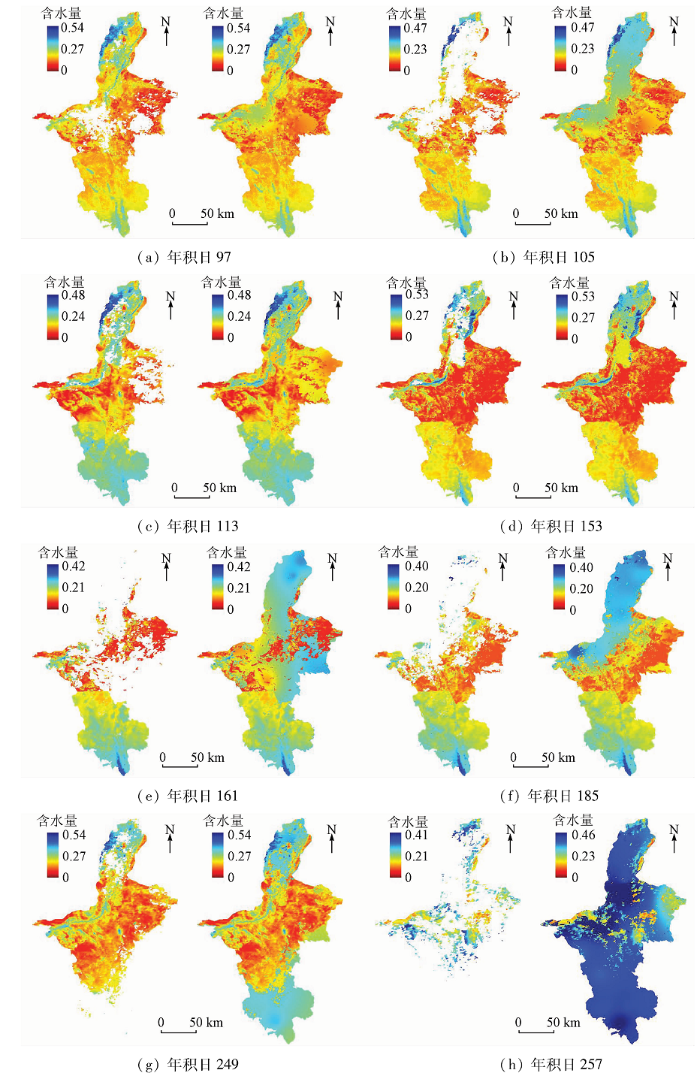
图2
2001年宁夏土壤体积含水量插补前(左)与插补后(右)对比
Fig.2
Soil moisture content of Ningxia in 2001 before (left) and after (right) interpolation process
从图2中可以看出:
1)对于像元缺失相对较少的时相,如97,113和153,插补整体效果较好,插补值与周围的旱情具有很好的空间连续性; 在时相113和153产品上,缺失数据既覆盖了高值区域,又覆盖了低值区域,插补后的数据仍然较好地反映了缺失区域的土壤体积含水量差异。
2)对于存在大面积缺失像元的时相,如105,161,185和249,本文方法仍能根据气象站点实测值估算缺失数据,有效地保证了产品的完整性,也在一定程度上体现了旱情的空间分布特征。
3)对于遥感数据几乎完全缺失的时相(如257),采用了初始背景场对缺失值进行插补,其结果虽然没有分析价值,但仍然满足了业务化监测流程的数据完整性要求。
3.3 精度分析
图3
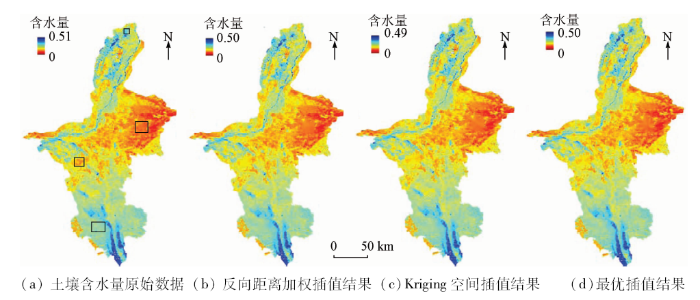
图3
最优插值与其他插值方法对比
Fig.3
Comparison between results of optimum interpolation and other interpolation methods
以土壤含水量原始数据为参照,计算3种插值方法用于各期数据的均方根误差的平均值。对于反向距离加权插值法,东、南、西、北矩形框缺失数据插补结果的均方根误差分别为0.036 1,0.039 2,0.088 1和0.079 8; 对于Kriging插值法,4块区域的均方根误差分别为0.036 9,0.034 8,0.074 4和0.108 8; 对于最优插值法,4块区域的均方根误差分别为0.031 4,0.032 7,0.054 9和0.057 8。可以看出,Kriging插值法在空间异质性较高的数据区域出现缺失时插补效果不如反向距离加权插值法,而在异质性低的区域效果较好,二者效果总体相当。与这2种方法相比,最优插值法得到的插补结果精度更高,虽然插补结果与实际数值仍然有一定偏差,但在成片数据缺失且不依赖长时序序列数据的情况下,能基本反映出数据缺失区域的整体状况。
此外,最优插值法还可以通过人工去掉数据点,模拟不同数据缺失率(10%,20%,30%和40%)的含水量(图4)。
图4
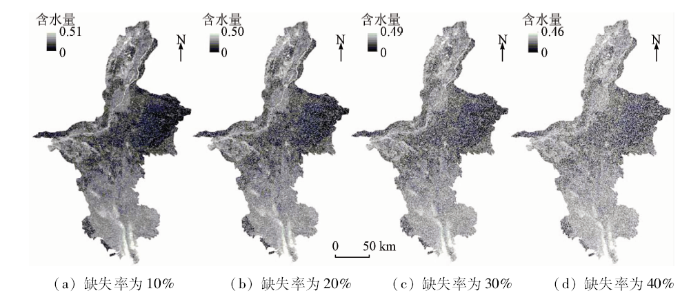
与原始数据进行对比,以均方根误差评价插补精度。当缺失率为10%时,插补误差为0.014 7; 当缺失率为20%时,插补误差为0.031 5; 当缺失率为30%时,插补误差为0.044 1; 当缺失率为40%时,插补误差为0.073 2。可以看出,在缺失比例很高时,插补结果仍然能达到较高精度,主要原因是模拟缺失数据是随机和均匀分布的,更利于依据周围数据插补真实结果。
4 结论
1)本文针对土壤含水量遥感反演过程中存在因云雪等导致的数据缺失问题,提出应用最优插值法,综合利用气象站点的实测和遥感反演数据为参考观测值,对缺失像元进行插值与填充。该方法不依赖于长时间序列的历史遥感数据,并且实测数据独立于遥感数据,降低了在成块缺失数据区域应用邻近数据估算所带来的误差。
2)选取宁夏回族自治区为研究区,以MODIS数据为数据源,根据VCADI指数与地面实测数据建立的土壤含水量反演模型,得到该区域具有不同程度数据缺失的多个时期土壤含水量。结合16个国家级气象台站观测数据,利用最优插值法对土壤体积含水量中的缺失数据进行插补。结果表明,该方法无论对少量数据缺失或大面积缺失都具有较好的效果。此外,本文分别利用反向距离加权插值法、Kriging空间插值法和最优插值法,对多期完整土壤含水量结果图进行矩形成块缺失数据含水量模拟,结果表明最优插值法具有更高插值精度。还通过不同数据缺失率模拟,测试了在高缺失率情况时最优插值法的插补效果。
3)本文方法适合于在分析区域内有足够数量实测站点且其空间分布相对均匀的情况,此外,面积较大的成块缺失数据会导致作为插补模型参考的实测数据与遥感反演数据均出现缺失,虽然本文方法给出了利用初始背景场进行填充的解决方案,但仅是为了确保产品的完整性,结果的使用需要慎重。本研究区主要包含的土壤类型为砂壤土、青壤土、黄壤土、粘土和黑垆土[34],在进行数据插补时未区分土壤类型,虽然结果满足要求,但插补方法对不同土壤类型的敏感性是今后需要研究的重要问题。
参考文献
Drought as Hazard:Understanding the Natural and Social Context
[M]
变化环境下中国干旱综合应对措施探讨
[J].我国干旱具有普遍性、连续性、季节性、地域性等特征,旱灾不仅直接影响我国的粮食安全,还进一步影响水循环及其伴生水环境、水生态和水沙过程。变化环境下,我国干旱问题显得尤为突出,表现在发生频率不断增加、受旱范围不断扩大、影响领域扩展、灾害损失加重,如何应对变化环境下的干旱,已成为我国实现和谐发展过程中亟待解决的关键问题之一。为有效综合应对我国的干旱问题,本文从三个时间层面上探讨了干旱的应对措施;从长期宏观发展战略层次上,构建与水资源承载能力相适应的经济社会发展模式(重点调整种植结构和工业产业结构),可从根本上减少干旱危害;在中尺度时段上,优化水资源调配体系是干旱综合应对的重点;在短尺度时段上,需制定有效应急预案,保障应急水源。
Integrated strategies for dealing with droughts in changing environment in China
[J].
以遥感为基础的干旱监测方法研究进展
[J].<p>总结了目前广泛应用的气象监测模型和基于遥感数据的干旱监测模型, 将目前的遥感监测方法分为植被状态监测方法、微波土壤水分监测方法、热红外遥感监测方法和基于能量平衡的遥感监测方法进行综述, 深入分析了基于遥感数据的监测方法的特点、适用条件和存在的问题。通过综述基于多源数据的干旱综合监测模型, 对未来干旱监测方法的发展方向进行研究和探讨, 指出集成多源数据的干旱综合监测模型是解决复杂的干旱监测问题的新方法。</p>
Remote sensing-based drought monitoring approach and research progress
[J].
农业干旱遥感监测研究进展
[J].
Advances in agricultural drought monitoring by remote sensing
[J].
高光谱遥感监测土壤含水量研究进展
[J].土壤含水量是监测旱情墒情的关键参量, 近年来在利用高光谱遥感数据监测土壤含水量方面, 国内外进行了大量的研究。 文章首先在分析利用不同波段监测土壤含水量的原理及优缺点基础上, 指出高光谱遥感监测的独特优势和问题。 并以此为出发点, 从机理上归纳了土壤含水量对土壤反射率的整体影响, 以及对不同波段响应的差异。 在此基础上, 从物理机理和统计方法两个方面, 总结了土壤含水量与土壤反射率的关系。 并分析和评价了各模型及统计方法中的关键问题和优缺点。 以往研究土壤含水量与土壤反射率关系的实验方法中往往存在一些问题, 文章也一一指出并提出了解决方案。 同时, 探讨了高光谱在消除植被影响, 更好地反演土壤含水量方面的可行性。 最后对未来的研究方向进行了展望
Review of monitoring soil water content using hyperspectral remote sensing
[J].
基于ΔTs-Albedo光谱信息的土壤水分监测新指数研究
[J].土壤水分的遥感监测在农业干旱和水资源管理方面具有重要的意义。 利用MODIS反射率和温度产品来获取地表昼夜温差(ΔTs)和宽波段反照率(Albedo), 构建ΔTs-Albedo光谱特征空间, 提出温差-反照率干旱指数(temperature difference albedo drought index, TDADI)用来监测土壤水分, 并利用宁夏实测0~10 cm平均土壤含水量数据验证该指数的精度, 结果表明: 它们之间的相关性较好, R2变化范围为0.36~0.52。 TDADI与TADI相比, 该指数具有更高的土壤水分监测精度。 然而, 由于数据获取的局限性, 只采用了宁夏平原数据对TDADI进行验证, 在其他区域仍需要进一步验证。
New index for soil moisture monitoring based on ΔTs-Albedo spectral information
[J].
典型农业干旱遥感监测指数的比较及分类体系
[J].
DOI:10.3969/j.issn.1002-6819.2012.14.023
URL
Magsci
[本文引用: 1]

面对多种多样的农业旱情遥感监测指数,如何进行选取是目前遥感指数应用所面临的主要难题。该文以MODIS产品为遥感数据源,比较分析了13种典型的农业干旱遥感监测指数,建立了农业干旱遥感监测指数的分类体系,阐述了不同指数类型的适用范围。结果表明,多种遥感干旱指数对农业干旱的描述并非完全一致。不同指数利用不同的地表特征变化来描述农业干旱程度,是造成这种不一致的主要原因。据此,研究将典型农业干旱遥感监测指数分为4大类:土壤水分变化类、冠层温度变化类、植被水分变化类和作物形态及绿度变化类。其中第1类指数比较适宜于农业旱情预警及土壤干旱型农业旱情的监测,这类指数中修正的垂直干旱指数MPDI可以较好地反映表层土壤水分的变化,并适宜于时序变化监测。第2类指数不仅适宜于旱情预警,更适宜于旱情监测,这类指数中推荐选择基于LAI-LST特征空间的温度植被干旱指数TVDI;第3、4类指数,较适宜于农业旱灾的预警以及灾后评估,该文为农业干旱遥感监测指数的选取提供参考。
Comparisons and classification system of typical remote sensing indexes for agricultural drought
[J].
基于热点效应的不同株型小麦LAI反演
[J].针对小麦株型对LAI反演精度的制约, 利用地面实测的多角度数据, 提出采用热点指数反演高精度的不同株型小麦LAI。 通过分析京411紧凑型和中优9507披散型两种株型小麦在红光(670 nm)和近红外波段(800和860 nm)的二向反射光谱特征, 借鉴热暗点指数HDS和归一化热暗点信息指数NDHD, 构建了改进的归一化热暗点指数MNDHD和热暗点比值指数HDRI两个新热点指数。 将HDS, NDHD, MNDHD和HDRI与NDVI, SR和EVI相乘得到的热点组合指数用于不同株型小麦LAI的反演。 分析得出对紧凑型小麦京411, 由860 nm近红外波段的NDVI与MNDHD和HDRI的组合指数反演的LAI精度分别为0.943 1和0.909 2; 对披散型小麦中优9507, 由800 nm近红外波段的SR与HDRI和MNDHD的组合指数获得的LAI反演精度分别为0.964 8和0.895 6。 表明基于冠层的热点效应反演不同株型小麦LAI的方法可行, 多角度遥感数据在作物结构参数提取方面比常规观测数据更具优势。
Inversion of LAI by considering the hotspot effect for different geometrical wheat
[J].
基于Landsat数据的条件植被温度指数升尺度转换方法
[J].
DOI:10.6041/j.issn.1000-1298.2015.07.038
URL
[本文引用: 1]
以陕西省关中平原为研究区域,应用点扩散函数、混合像素面积权重法和中值像素变异权重法将基于Landsat卫星遥感数据反演的分辨率为30 m的条件植被温度指数(VTCI)干旱监测结果上推至930 m的干旱监测结果,并与Aqua MODIS数据反演的分辨率为930 m的VTCI干旱监测结果进行对比分析,以期为两种空间尺度的干旱监测结果的综合应用提供技术支持。以MODIS数据反演的VTCI为参考,应用相关系数、均方根误差、半变异函数的估计值和图像纹理特征等对尺度上推的VTCI进行评价。结果表明,点扩散函数和混合像素面积权重法的尺度上推效果均较好,而中值像素变异权重法的尺度上推效果较差,说明点扩散函数和混合像素面积权重法均适用于研究区域VTCI干旱监测结果的尺度转换,且点扩散函数的数据处理过程更为简单。典型样点VTCI的尺度上推结果表明,空间异质性越小,尺度上推的结果越好。
Up-scaling transformation methods for vegetation temperature condition index retrieved from Landsat data
[J].
A curve fitting procedure to derive inter-annual phenologies from time series of noisy satellite NDVI data
[J].
DOI:10.1016/j.rse.2006.08.002
URL
[本文引用: 1]
Annual, inter-annual and long-term trends in time series derived from remote sensing can be used to distinguish between natural land cover variability and land cover change. However, the utility of using NDVI-derived phenology to detect change is often limited by poor quality data resulting from atmospheric and other effects. Here, we present a curve fitting methodology useful for time series of remotely sensed data that is minimally affected by atmospheric and sensor effects and requires neither spatial nor temporal averaging. A two-step technique is employed: first, a harmonic approach models the average annual phenology; second, a spline-based approach models inter-annual phenology. The principal attributes of the time series (e.g., amplitude, timing of onset of greenness, intrinsic smoothness or roughness) are captured while the effects of data drop-outs and gaps are minimized. A recursive, least squares approach captures the upper envelope of NDVI values by upweighting data values above an average annual curve. We test this methodology on several land cover types in the western U.S., and find that onset of greenness in an average year varied by less than 8days within land cover types, indicating that the curve fit is consistent within similar systems. Between 1990 and 2002, temporal variability in onset of greenness was between 17 and 35days depending on the land cover type, indicating that the inter-annual curve fit captures substantial inter-annual variability. Employing this curve fitting procedure enhances our ability to measure inter-annual phenology and could lead to better understanding of local and regional land cover trends.
Multitemporal,multichannel AVHRR data sets for land biosphere studies-Artifacts and corrections
[J].
DOI:10.1016/S0034-4257(96)00137-X
URL
[本文引用: 1]
Temporal compositing of daily optical satellite data has become an accepted methodology for obtaining frequent images of large areas for studies of the land surface. However, such composite data sets sometimes contain large “artifacts” (i.e., errors due to sources unrelated to the land surface itself). The goal of this study was to develop a series of operations and algorithms that would identify and remove as many of these errors as possible. The specific objective was to obtain, every ten days, surface reflectance in advanced very high resolution radiometer (AVHRR) channels 1 and 2 and normalized difference vegetation index (NDVI)—all referenced to a constant viewing geometry—and surface temperature. The processing steps of the resulting methodology, dubbed “ABC3” for atmospheric, bidirectional, and contamination corrections of the Canada Centre for Remote Sensing (CCRS), includes atmospheric corrections; the identification of pixels “contaminated” by clouds, snow (including subpixel), and shadows from optically thick clouds; bidirectional reflectance and thermal emissivity corrections; and the replacement of the contaminated pixels in the composites through interpolation. The resulting procedures yield surface reflectance and NDVI fully corrected for bidirectional effects; a version of NDVI corrected for solar zenith only; and surface temperature corrected for atmospheric and surface emissivity effects. An evaluation of the resulting data set shows that the procedures provide significantly improved data products compared with the raw composites, but they do not approximate a single-date image sufficiently closely, especially for AVHRR channel 1, whose reflectance values are generally low. This is attributed to the limitations of the input data and knowledge of atmospheric (and partly bidirectional) characteristics applicable to each composite pixel.
遥感时间序列数据滤波重建算法发展综述
[J].
DOI:10.3321/j.issn:1007-4619.2009.02.023
URL
Magsci
[本文引用: 1]
遥感时间序列数据(MODIS,NOAA/AVHRR,SPOT/VEGETATION等)在植被生长监测、物候信息提取、土地利用类型监测等诸多领域得到了广泛应用,是生产研究的重要数据源之一.由于传感器、云层大气等影响,遥感时间序列数据存在着严重的噪声,应用前必须进行序列滤波重建工作.综述现有各类滤波重建方法,对研究中广为采用的3类主要方法(基于最小二乘的非对称高斯函数拟合、SavitZky-Golay滤波、基于离散傅里叶的系列分析方法)集中阐述其理论基础、应用步骤和优缺点.总结当前遥感时间序列滤波重建方法需要进一步改进之处.
Review on methods of remote sensing time-series data reconstruction
[J].
Characteristics of maximum-value composite images from temporal AVHRR data
[J].DOI:10.1080/01431168608948945 URL [本文引用: 1]
The best index slope extraction (BISE):A method for reducing noise in NDVI time-series
[J].
DOI:10.1080/01431169208904212
URL
[本文引用: 1]
The Best Index Slope Extraction (BISE) is proposed as an alternative to the Maximum Value Composite (MVC) as a way of reducing noise in Normalized Difference Vegetation Index (NDVI) time-series from Advanced Very High Resolution Radiometer (AVHRR) data. The BISE method retains more valuable elements of an NDVI profile than the MVC. NDVI profiles prepared using the BISE method show strong differences in the development characteristics of various West African vegetation types.
Filtering pathfinder AVHRR land NDVI data for Australia
[J].
DOI:10.1080/01431160116874
URL
[本文引用: 1]
The Pathfinder AVHRR Land (PAL) dataset is a consistently processed 13-year time series derived from AVHRR global area coverage (GAC) data. We found significant cloud contamination and other noise present in the PAL dataset that diminished its utility. This Letter describes a simple and successful attempt to reduce these effects. The filtered dataset is available from the authors.
Reconstruction of sea surface temperature by means of DINEOF:A case study during the fishing season in the Bay of Biscay
[J].
DOI:10.1080/01431160903491420
URL
[本文引用: 1]
The Spanish surface fishery operates mainly during the summer season in the waters of the Bay of Biscay. Sea surface temperature (SST) data recovered from satellite images are being used to improve the operational efficiency of fishing vessels (e.g. reduce search time and increase catch rate) and to improve the understanding of the variations in catch distribution and rate needed to properly manage fisheries. The images used for retrieval of SST often present gaps due to the existence of clouds or satellite malfunction periods. The data gaps can totally or partially affect the area of interest. Within this study, an application of a technique for the reconstruction of missing data called DINEOF (data interpolating empirical orthogonal functions) is analysed, with the aim of testing its applicability in operational SST retrieval during summer months. In this case study, the Bay of Biscay is used as the target area. Three months of SST Moderate Resolution Imaging Spectroradiometer (MODIS) images, ranging from 1 May 2006 to 31 July 2006, were used. The main objective of this work is to test the overall performance of this technique, under potential operational use for the support of the fleet during the summer fishing season. The study is designed to analyse the sensitivity of the results of this technique to several details of the methodology used in the reconstruction of SST, such as the number of empirical orthogonal functions (EOFs) retained, the handling of the seasonal cycle or the length (number of images) of the SST database used. The results are tested against independent SST data from International Comprehensive Ocean tmosphere Data Set (ICOADS) ship reports and standing buoys and estimations of the error of the reconstructed SST fields are given. Conclusions show that over this area three months of data are enough for efficient SST reconstruction, which yields four EOFs as the optimal number needed for this case study. An extended EOF experiment with SST and SST with a lag of one day was carried out to analyse whether the autocorrelation of the SST data allows better performance in the SST reconstruction, although the experiment did not improve the results. The validation studies show that the reconstructed SSTs can be trusted, even when the amount of missing data is very high. The mean absolute deviation maps show that the error is greatest near to the coast and mainly in the upwelling areas close to the French and north-western Spanish coasts.
Correction of time series NDVI by the method of temporal window operation
[C]//
Seasonality extraction by function fitting to time-series of satellite sensor data
[J].
DOI:10.1109/TGRS.2002.802519
URL
[本文引用: 1]
A new method for extracting seasonality information from time-series of satellite sensor data is presented. The method is based on nonlinear least squares fits of asymmetric Gaussian model functions to the time-series. The smooth model functions are then used for defining key seasonality parameters, such as the number of growing seasons, the beginning and end of the seasons, and the rates of growth and decline. The method is implemented in a computer program TIMESAT and tested on Advanced Very High Resolution Radiometer (AVHRR) normalized difference vegetation index (NDVI) data over Africa. Ancillary cloud data [clouds from AVHRR (CLAVR)] are used as estimates of the uncertainty levels of the data values. Being general in nature, the proposed method can be applied also to new types of satellite-derived time-series data.
Smoothing and differentiation of data by simplified least squares procedures
[J].DOI:10.1021/ac60214a047 URL [本文引用: 1]
Adapting the LMF temporal splining procedure from serial to MPI/Linux clusters
[J].
DOI:10.3844/jcssp.2007.130.133
URL
[本文引用: 1]
Remote Sensing (RS) provides images over large areas such as provincial or country level. During the last 20 years, it plays a vital role for developing many complex applications. However, RS image includes data noises due to influence of haze or cloud especially in the rainy season. It is thus necessary to remove the noise to recover the real ground variations of information studied. Local Maximum Fitting (LMF) is a combined procedure, which helps to remove the noisy data. When dealing with sufficiently large and such complex processing with RS data, single computers time processing extends to unacceptable limits. Such as, to remove the noise from RS image with 146 bands, 38 rows and 37 columns which mean 146 X 38 X 37= 205276 pixels, the LMF procedure requires 26 minutes approximately. So, 1000 X 1000 Remote Sensing Image with 146 bands is required approximately two weeks. It is necessary to reduce the time constraint and make the LMF process executable in a suitable time limit. This study deals with the design and implementation of a distributed LMF procedure. Especially, inside the LMF procedure, a consecutive amount of pixels (pixels in a column) is processed for each row. This behavior is used in this study to make the LMF parallel. For processing the RS image (146 bands, 38 rows and 37 columns), the execution time reduces to 16.13 minutes by adding distributed computing to the program (37 columns distributed to 3 computers). Key words: LMF, MPI, remote sensing, distributed computing, cluster computers
应用空间统计学理论解译遥感影像信息“缺失”区
[J].
DOI:10.11834/jrs.20040405
Magsci
[本文引用: 1]
借助图像处理软件ERDAS、地理信息系统软件ArcInfo以及空间统计分析软件ILWIS ,在对TM遥感影像进行分类的基础上 ,运用空间统计学理论以及Kriging插值技术 ,内插了影像真实信息“缺失”斑块的信息 ,插值结果通过了精度检验。为解译影像信息“缺失”区 ,提供了一种手段和方法。
Interpretation of pixel-missing patch of remote sensing image with Kriging interpolation of spatial statistics
[J].
基于Kriging空间插补海表叶绿素遥感缺失数据的研究
[J].完整的长时间序列遥感数据是大 尺度环境监测工作顺利完成的重要保证。本文选取2007年1月至2010年12月南海北部MODIS海表叶绿素a浓度月平均遥感影像为基础数据,利用地统 计的Kriging空间插值方法对月平均影像中的缺失数据进行插补,并从多个角度对插补结果进行分析和评价。结果表明:Kriging方法的插值结果能突 出研究海域海表叶绿素a浓度一定时期的特殊变化,在一定程度上也能体现研究海域海表叶绿素a浓度的时空变化规律;但是Kriging方法空间插值操作复 杂,精度较低,可变性估计不足,均方根误差平均值为0.459 8,标准化均方根误差的平均值为2.608 2。
The spatial interpolation of missing remote sensing data in sea surface chlorophyll-a using Kriging
[J].
插值法在去除MODIS遥感影像条带噪声中的应用
[J].
DOI:10.3969/j.issn.1009-0827.2007.06.003
URL
[本文引用: 1]
采用多元并扫方式(1 km分辨率10元并扫,500 m分辨率20元并扫,250 m分辨率40元并扫)的MODIS传感器,由于各探测单元在轨响应差异而引起的条带噪声对MODIS定量产品的反演计算精度造成一定影响.为了尽可能减少这种影响,提高MODIS定量产品反演精度,本文提出了应用插值法剔除MODIS数据条带噪声.研究首先分析了传统去条带噪声方法的弊端,根据条带噪声在MODIS影像中的分布规律,以及如何准确判断条带噪声所在的行,然后应用插值法去除了MODIS波段5和波段30影像的条带噪声,取得了满意的效果,最后对图像的去除效果与传统的矩匹配法和傅立叶变换法进行了比较,并用两种评价指标做出评价.结果表明,两种评价指标得出的结果一致,也正说明了插值法是一种很好的去除MODIS数据条带噪声的方法,同时用这种方法处理后的图像还能保留原有的大部分信息.
Application of interpolation method in destriping MODIS images
[J].
MODIS影像条带噪声行的判断及去除研究
[J].
DOI:10.11873/j.issn.1004-0323.2015.3.0540
URL
Magsci
[本文引用: 1]
<p>为了提高MODIS_L1B含有条带噪声的波段5和波段27的影像质量,基于MODIS的扫描特性提出了一种通过扫描带行均最大值判断条带噪声行的方法。去除影像的噪声行时,在波段5的单行邻域插值法基础上,针对波段27提出了一种相邻多行插值方法。最后,通过对比原始数据和去条带噪声后数据的差值图、行均值图和数值分析来证实条带噪声处理效果。结果表明:该方法可以精确判断这两个波段影像的所有条带噪声行,且对条带噪声去除效果较好,去除条带过程简单且适用于复杂场景的光谱图像。</br></p>
A research on judging and removing stripe noises of MODIS image
[J].
GIS辅助数据下的影像缺失信息恢复
[J].针对遥感影像上的“缺失”区域现象,阐明了数字图像修复技术的原理和方法,分析了遥感影像缺失区域恢复的特点和难点,并提出了基于GIS辅助信息的缺失数据恢复思想,提高了图像修复的质量。
Restoring lost information on remote sensing images based on accessorial GIS data
[J].
纹理合成技术在遥感影像缺失信息恢复中的应用
[J].
Texture synjournal and it’s application in restoring missing information on remote sensing images
[J].
《神舟三号》成像光谱仪图像条带消除的一种方法
[J].图像条带是成像光谱仪采用多元并扫方式获取遥感数据而引起的新问题之一.本文对图像条带的成因进行了初步阐述,并简要介绍了国内外现有图像条带处理的方法,着重介绍了归一化经验分布函数匹配方法工作原理,并用该方法对<神舟三号>成像光谱仪图像条带消除进行了试验.结果表明:归一化经验分布函数匹配方法对<神舟三号>中分辨率成像光谱仪图像条带消除是非常有效的,图像质量明显得到改善,对以后同类仪器的资料处理具有很好的借鉴作用.
Method to destripe imaging spectroradiometer data of SZ-3
[J].
Objective Analysis of Meteorological Fields
[M].
最优插值法用于天气雷达测定区域降水量
[J].本文通过数位模拟和实测资料分析,表明用最优插值法测量区域降水量的测量精度和变分法相当,而最优插值法对雨量计的分布和密度要求较低,计算处理也简单。
Optimum interpolation method used for measuring regional precipition with weather Radar
[J].
基于GIS的黄淮海平原旱灾遥感监测研究——作物缺水指数模型的实现
[J].
DOI:10.3321/j.issn:1000-0933.2000.02.009
URL
Magsci
[本文引用: 1]
研究黄淮海平原旱灾监测中作物缺水指数模型实现的方法 ,特别是以与遥感图象相同的分辨率来计算作物缺水指数采取的对气象数据的处理 ,以及在 GIS的支持下 ,对矢量格式的地形图及遥感图象的不同处理 ,以实现图象、图形、数据的一体化。从而得到所需的研究区旱情分布图等不同形式的结果。实时监测表明 :本方法精度高 ,可靠性强 ,基本上达到了准确、实时监测干旱的目的。
Remote sensing monitoring of drought in Huanghe,Huaihe and Haihe Plain based on GIS-the calculation of crop water stress index model
[J].
海温数值预报资料同化试验I.客观分析的最优插值法试验
[J].
Assimilation experiment of prediction data of sea surface temperature I:Objective analysis of optimum interpolation
[J].
动态最优插值方法及其同化应用研究
[J].
DOI:10.3969/j.issn.1000-1565.2004.06.004
URL
[本文引用: 1]
根据常规最优插值算法,在引入时间关联的基础上,详细推导了动态最优插值法的具体同化表达形式,利用这些公式,可以处理常见的在海洋观测数据同化中存在的时间错位问题.在陆架海模式HAM-SOM基础上,以7月份的渤海海表温度为例,验证了同化公式的可行性,并得到了较好的同化结果.验证结果表明:该方案能够兼顾观测数据与背景数据双方的特性,同化后的结果更加接近实际情况.
Dynamic interpolation and its application in data assimilation
[J].
Exploration of the spectral space based on vegetation index and albedo for surface drought estimation
[J].
DOI:10.1117/1.2784792
URL
Vegetation condition albedo drought index (VCADI); surface moisture; spectral feature space; drought estimation
宁夏境内12种主要土壤类型分布区域与剖面特征
[J].
DOI:10.3969/j.issn.1002-204X.2011.09.024
URL
[本文引用: 1]
对宁夏境内分布面积较大、对农业和生态环境有重大影响的12种主要土壤类型特征、分布区域做了实地调查,并对各类土壤剖面特征做了研究,土壤剖面特征指标包括土壤质地、颜色、结构,土壤中的根系状况及新生体和(或者)嵌入体等。研究将进一步深化人们对宁夏境内土壤的性质和认识,可为工农业生产、土壤改良以及土壤调查工作提供参考资料,同时对于揭示自然与人类活动在土壤变化过程中的作用具有重要意义。
Distribution area and profile features of twelve soil types in Ningxia
[J].
