

0 引言
从20世纪60年代开始,遥感技术已经开始应用到土壤水分监测中,历年来,国内外科研工作者提出过许多模型和方法。1969年,Jordan[4]提出了最早的一种植被指数,比值植被指数(ratio vegetation index,RVI); 1977年,Kahle[5]得到第一个遥感热惯量影像; Price给出了用遥感数据计算热惯量的一般方法[6],并于1985年提出了表观热惯量(apparent thermal inertia,ATI)模型[7]; Jackson等[8]综合分析研究土壤水分、叶片温度和植被指数相互之间关系,于1981年提出了作物缺水指数法(crop water stress index,CWSI); Carlson等[9]于1994年提出了综合考虑植被指数和植被冠层温度的植被供水指数(vegetation supply water index,VSWI); 2002年,Sandholt等[10]运用陆地表面温度(land surface temperature,LST)与归一化植被指数(normalized differential vegetation index,NDVI),建立了NDVI-Ts特征空间,并提出了温度植被干旱指数(temperature vegetation dryness index,TVDI)。各种干旱指数都有其优缺点与不同的适用范围,综合多种干旱指数对土壤水分进行反演会得到更可靠的效果。因ATI模型与VSWI模型计算简便,效果良好,本文选取这2种模型进行实验。已有研究表明ATI模型只适用于低植被覆盖区域[11],而VSWI模型在作物覆盖度较高时比较有效[9],本文通过NDVI来区分地表植被覆盖度,结合ATI与VSWI模型,建立综合干旱指数(comprehensive drought index,CDI)模型,进行土壤水分的初步反演。
但是仅利用遥感数据来监测土壤水分也有不足,因为利用上述模型基于遥感影像提取到的土壤水分信息都只能反映土壤的相对干湿情况,并不是真实的土壤含水量值,对土壤含水量的定量分析和使用有较大的限制。因此,本研究引入实测的土壤含水量数据,探究CDI结果与实测土壤含水量之间的相关关系,选出一种最佳的相关模型,则可利用该模型把CDI结果转化为真实的土壤含水量数据,以期提高大区域的陆表土壤含水量监测效率,便于土壤水分产品的业务化生产。
1 研究区概况及数据源
1.1 研究区概况
图1
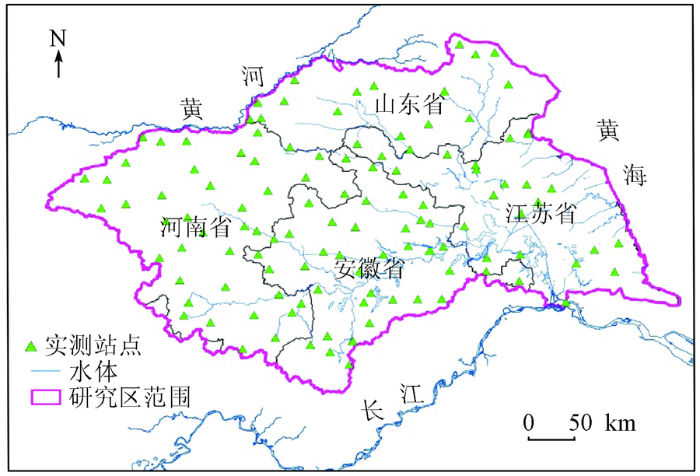
淮河流域地处我国南北气候过渡带,冬春干旱少雨,夏秋闷热多雨,冷暖和旱涝转变急剧,多年平均降水量约为920 mm,由南向北递减,山区多于平原,沿海大于内陆,旱涝时有发生。因此,对淮河流域进行业务化的土壤含水量监测具有极大的价值。因其流域面积大,地貌特征复杂,利用MODIS影像选取ATI和VSWI模型进行综合研究,是一种有效可行的方法。
1.2 数据源
1.2.1 MODIS数据
选取空间分辨率为1 000 m的MODIS 1B产品数据,即MOD021KM, 以及其对应的地理定位文件,即MOD03。使用ENVI+IDL进行编程,完成数据预处理和相关指数的计算。
1.2.2 实测数据
地面实测土壤含水量数据来自中国水利部数据中心,其墒情数据主要由水利部门的土壤墒情监测站提供。墒情监测站点以县为单元,根据气候类型、地形地貌、作物布局、灌排条件和土壤类型等因素,设置在区域范围内代表性较强的地块。墒情采集方法主要为固定监测法,即埋设固定式自动监测设备,传感器分别埋入土层深度10 cm,20 cm和40 cm处,按0~10 cm,10~20 cm和20~40 cm共3个层次监测土壤含水量,并于每月的1日、11日和21日各观测一次。
淮河流域耕地面积为1 333 hm2,农作物以冬小麦、水稻、棉花和油菜等为主。每年的5月上中旬是冬小麦的抽穗扬花期,5月中下旬为灌浆乳熟期,5月底到6月上旬为收割期,因此5月份是冬小麦生长需水的最关键时期,一旦出现旱情,则会抑制子粒灌浆及干物质向子粒的运输与积累,从而直接影响到小麦单产水平。故本文选取了2014年5月1日、11日、21日和6月1日4天作为实验日。其中5月1日、11日属于小麦生长的中后期,叶面基本覆盖农田; 5月21日和6月1日属于小麦成熟期,部分地区小麦开始收割,地表覆盖情况不一。
2 研究方法
2.1 干旱指数模型选择
目前利用卫星影像反演土壤水分的方法己经有很多,例如ATI、距平植被指数、CWSI、条件温度植被指数(vegetation-temperature condition index,VTCI)、VSWI等。现将使用比较广泛的几种方法进行介绍与分析。
2.1.1 ATI模型
土壤热惯量随土壤含水量的变化而变化,因此可建立土壤热惯量模型来监测土壤含水量。Price[7]提出的ATI是在热惯量定义的基础上,不考虑太阳高度角和纬度等因素,其形式为
ATI=(1-A)/(Tmax-Tmin) , (1)
式中: ATI为表观热惯量; A为全波段反照率,可由 MODIS数据 1和2 通道的反射率得到; Tmax和Tmin分别为一天中最高和最低温度,可分别由MODIS数据 31 通道的地表温度得到。ATI值越高,表示土壤含水量越大,反之亦然。ATI模型参数都可从遥感影像中获取,且计算简便,但仅适用于低植被覆盖区域[10]。
2.1.2 CWSI模型
CWSI以能量平衡为基础,是最常用的植被蒸散法之一,定义为[15]
CWSI=1-ET/ETp , (2)
式中: CWSI为作物缺水指数; ET为水分的日蒸散量; ETp为在水分供应充分条件下的日潜在蒸散量。ET值越小,CWSI值越大,土壤的含水量也越少,反之亦然。但是ET与ETp值不能够从遥感影像上直接获取,需要大量的地面实测资料,应用起来也比较困难。
2.1.3 VTCI模型
在NDVI-Ts构成三角形空间的基础上,王鹏新等[16]提出了VTCI模型 ,其计算公式为
VTCI=
式中: VTCI为条件植被温度指数;
2.1.4 VSWI模型
VSWI是通过计算NDVI和植物冠层温度的比值得到的,其公式为[17]
VSWI=NDVI/T , (4)
式中: VSWI为植被供水指数; T为植被的冠层温度。VSWI值越大,表明土壤含水量越大; VSWI值越小则代表土壤含水量越小。但VSWI值是根据植被覆盖状况的变化来进行反演的,所以不适用于低植被覆盖地区[18]。
2.2 建立综合干旱指数模型
淮河流域面积大,地貌特征复杂,仅用一种干旱指数无法满足监测复杂地表土壤含水量的需求。通过2.1节对各干旱指数模型的优缺点与适用性特征的分析,可知ATI与VSWI模型效果良好且计算简便,但ATI模型比较适用于低植被覆盖地区和裸土区域,而VSWI模型适用于植被覆盖度较高的地区,所以本文结合这2种模型来建立一种新的干旱指数模型——CDI模型。
由于ATI和VSWI的取值范围不在同一个尺度上,因此在综合使用这2种模型之前,需要把它们归一化到同一个区间范围内,以便最终建立CDI,其公式为
CDIi=
式中: CDIi为在任意像元点i的综合干旱指数; ATIi为任意像元点i的表观热惯量; VSWIi为任意像元点i的植被供水指数; ATImax和ATImin分别为表观热惯量的最大值和最小值; VSWImax和VSWImin分别为植被供水指数的最大值和最小值。
2.3 基于实测数据建立相关模型
根据2.2节所述的原理与公式,利用ENVI+IDL编程可以得到每个实验日的CDI结果。但CDI的结果是个无量纲常数,只能反映土壤相对的干湿情况,并不能代表土壤含水量的定量结果。为了得到CDI与实际土壤含水量之间的关系,需要在这2种数据上分别取样点进行分析,建立两者之间的函数关系,分别用经典的线性、指数和对数函数进行拟合,根据精度选择一个最佳的函数对应关系。
实测站点分布如图1所示,选择2014年5月1日的数据进行建模。因为CDI值是遥感影像反演得到的,而理论上遥感只能穿透土壤表层,所以选用0~10 cm深度的实测数据来与CDI值进行建模。根据2.2节所述,首先用ENVI编程计算得到5月1日的CDI结果; 然后用ArcGIS把实测点对应的CDI值提取出来,去掉其中CDI值为空的数据,再去掉实测点为0或极端大的异常数据; 最后留下了81组样点。这些样点均匀分布在研究区域内,基本上能代表整个研究区域的情况。
图2
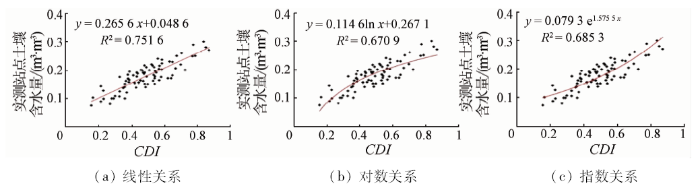
表1 淮河流域土壤含水量与CDI值之间的线性统计关系
Tab.1
| 线性模型 | N | R | R2 | F | Significance F |
|---|---|---|---|---|---|
| y=0.265 6x+0.048 6 | 81 | 0.87 | 0.75 | 434.67 | 7.43e-34 |
综上,得到了把CDI转换为真实土壤含水量值的模型,即
SM=0.265 6CDI+0.048 6 , (6)
式中SM为土壤含水量。
对该模型的可靠性进行检验,显著水平取α=0.01,R=0.87>0.283=Rn-2,α,检验通过。F=434.67>7.08=F1-α(1,n-2),检验通过。Significance F是在显著性水平下的Fα临界值,等于P值,故本例中,P=7.43e-34<0.001,故置信度达到99.9%以上。因此可以使用该线性模型把淮河流域的CDI结果转化为实际土壤含水量。
3 结果与分析
3.1 土壤含水量反演结果
如上述方法,利用MODIS影像计算出CDI指数后,根据线性模型式(6),反演出2014年5月11日、21日和6月1日3 d的淮河流域土壤含水量结果,如图3所示。
图3
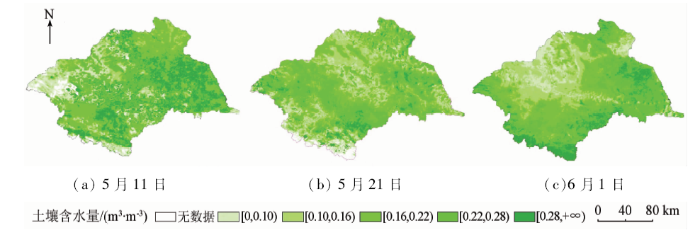
由图3可见,土壤含水量分布大致趋势为南部地区略大于北部地区,东部地区略大于西部地区。江苏省土壤含水量普遍较其他区域略高,可能与靠近海洋空气湿润有关。而河南和安徽等地区土壤含水量则相对略低,这主要是因为华北地区蒸发较强,夏季风弱,地下水位低。初步判断土壤含水量反演结果比较合理。整体看淮河流域土壤含水量大多在0.1~0.3 m3/m3之间,5月11日整体相对较高,5月21日整体相对较低。且5月11日土壤含水量分布不均匀,浮动较大,土壤含水量高与低的区域过度较不平缓。
3.2 精度验证及分析
为了验证本文提出的反演模型的可靠性,结合地面实测土壤含水量数据,对反演得到的土壤含水量结果进行精度验证。实测数据点去除数据为 0 和异常大值的记录,最终每个实验日选择了90个左右质量比较好的数据点。
图4
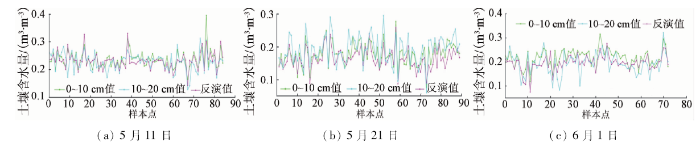
图4
淮河流域实测土壤含水量与反演土壤含水量对比
Fig.4
Comparison of measured soil moisture and estimated soil moisture in Huaihe River Basin
具体精度需要进行误差统计分析,定义地面观测土壤含水量为X,反演的土壤含水量为X0,N为参与比较的总样本数。通过对比分析,统计出最大误差(MaxE)、绝对误差(ABVR)和均方根误差(RMSE)。
3个实验日的实测0~10 cm、10~20 cm土壤含水量数据与反演得到的土壤含水量数据的误差分析如表2所示。
表2 实测土壤含水量与反演土壤含水量误差分析
Tab.2
| 深度 | 时间 | 样本数 | MaxE | ABVR | RMSE | 平均 RMSE |
|---|---|---|---|---|---|---|
| 5月11日 | 84 | 0.055 4 | 0.024 9 | 0.030 9 | ||
| 0~10 cm | 5月21日 | 89 | 0.036 5 | 0.019 7 | 0.013 6 | 0.022 3 |
| 6月1日 | 72 | 0.013 1 | 0.019 0 | 0.022 6 | ||
| 5月11日 | 85 | 0.117 4 | 0.032 9 | 0.040 3 | ||
| 10~20 cm | 5月21日 | 90 | 0.102 2 | 0.026 3 | 0.030 1 | 0.036 0 |
| 6月1日 | 72 | 0.096 3 | 0.027 6 | 0.037 8 |
根据表2中的数据可知,反演精度比较理想,特别是与0~10 cm深度土壤含水量相关性较好,平均RMSE为0.022 3。而反演结果与10~20 cm深度土壤含水量的相关性略差,因为遥感只能穿透表层土壤,随着土壤深度增加,遥感反演的精度会降低。反演结果与0~10 cm和10~20 cm深度的RMSE最小值都出现在5月21日,从图3(b)和图4(b)中可以看出,当日土壤含水量在0.1~0.2m3/m3左右,相对较低。所以推断在土壤水分较低的区域,该反演模型的结果相对更加精确。而5月11日RMSE较大,从图3(a)和图4(a)中可以看出该日土壤含水量相对较高且浮动范围比较大,特别是从图3(a)可以看出土壤含水量高与低的区域过度不太平滑,可能是由于局部灌溉造成,在此种状况下模型反演精度略有降低。
图5

图5
0~10 cm实测土壤含水量与反演土壤含水量相关性分析
Fig.5
Correlation analysis of measured 0~10 cm soil moisture and estimated soil moisture
本文基于MODIS数据与实测数据,反演了淮河流域的土壤含水量。该反演方法具有以下优点:
1)提出的CDI模型考虑了低植被覆盖区与高植被覆盖区的不同适用性特点,综合ATI和VSWI这2种模型来进行研究。CDI模型可适用于复杂的植被覆盖区域,相较使用单一的反演模型,反演精度将大大提高。
2)建立的CDI与实测土壤含水量转换模型,可对遥感反演的无量纲结果进行转换,从而得到真实的土壤含水量值。这对于土壤含水量的定量监测与分析有较大的意义。
经过精度验证,反演的土壤含水量与0~10 cm和10~20 cm深度土壤含水量的平均均方根误差分别为0.022 3和0.036 0,特别是与0~10 cm深度数据的相关性较高,R2在0.7左右,精度较好,可满足日常业务化监测需要,且简便快捷,具有较大的应用潜力。
本次实验中也存在一些误差,在2.3节建立相关模型时,选取的是2014年5月1日的样本数据,样本所选取的日期不同,可能会对数据的相关性结果产生影响,这也会对反演的精度造成影响。将来可考虑进行更多后续实验,以求获得具有更高精度、更高效率的土壤含水量成熟产品。
参考文献
Monitoring of soil moisture variability in relation to rice cropping systems in the Vietnamese Mekong Delta using MODIS data
[J].
DOI:10.1016/j.apgeog.2010.10.002
URL
[本文引用: 1]

Information on soil moisture is important for crop and water management. This study investigated soil moisture variability in relation to rice cropping systems in the Mekong Delta (MD), Vietnam, using MODIS data acquired from January to April, 2002 to 2007. The soil moisture was estimated using the temperature vegetation dryness index (TVDI). This index was empirically calculated by parameterizing the relationship between the MODIS land surface temperature (LST) and the normalized difference vegetation index (NDVI) data. The rice cropping systems were classified using time-series MODIS NDVI data for 2002 and 2006. The data were processed using empirical mode decomposition (EMD), principal component analysis (PCA) and maximum likelihood classification (MLC) methods. Various spatial and non-spatial data were also collected for accuracy validation of the TVDI and classification results. Comparisons reveal good agreement between the TVDI and daily rainfall data. The areas with low soil moisture were mainly distributed in coastal areas from 2002 to 2005, but expanded into the middle of the MD in 2006 and 2007. The largest area of low soil moisture was observed in 2006. Classification of rice cropping systems reveals an overall accuracy and Kappa coefficient for 2002 of 76.3% and 0.68, respectively while the values for 2006 were 76.9% and 0.69, respectively. To relate soil moisture with rice cropping systems, we aggregated the composite soil moisture maps (considering dry and very dry classes only) with the rice crop maps for 2002 and 2006. The results indicate a remarkable increase in the area of double and triple irrigated ice cropping systems in areas of low soil moisture (i.e., dry and very dry conditions) during this period. This study demonstrated the merits of using MODIS data for studying soil variability in relation to rice crops which is important for crop and water management.
FDR和TDR测定几种典型土壤含水量的对比分析
[J].
DOI:10.19364/j.1674-9405.2016.06.007
URL
[本文引用: 1]
针对基于时域反射(TDR)和频域反射(FDR)原理的土壤水分传感器,以潮土、红壤和黑土3种典型土样为实验对象进行室内标定,用不同标定方式对传感器与烘干法的测量值进行拟合及回归分析。结果表明:1)对于TDR和FDR,二次多项式拟合效果均优于线性及指数形式;2)在潮土中,TDR的测量精度高于FDR,而在红壤和黑土中,FDR的测量精度高于TDR;3)在3种测试土壤内,TDR相对于FDR普适性强。选择的3种土壤是中国北部、中部及南部地区的典型土壤,具有一定代表性,可为全国大部分地区土壤类型普适性研究提供实验基础。
Compaveral typical soil’s water content measuring with FDR and TDR
[J].
The ASCAT soil moisture product:A review of its specifications,validation results,and emerging applications
[J].
DOI:10.1127/0941-2948/2013/0399
URL
[本文引用: 1]
Many physical, chemical and biological processes taking place at the land surface are strongly influenced by the amount of water stored within the upper soil layers. Therefore, many scientific disciplines require soil moisture observations for developing, evaluating and improving their models. One of these disciplines is meteorology where soil moisture is important due to its control on the exchange of heat and water between the soil and the lower atmosphere. Soil moisture observations may thus help to improve the forecasts of air temperature, air humidity and precipitation. However, until recently, soil moisture observations had only been available over a limited number of regional soil moisture networks. This has hampered scientific progress as regards the characterisation of land surface processes not just in meteorology but many other scientific disciplines as well. Fortunately, in recent years, satellite soil moisture data have increasingly become available. One of the freely available global soil moisture data sets is derived from the backscatter measurements acquired by the Advanced Scatterometer (ASCAT) that is a C-band active microwave remote sensing instrument flown on board of the Meteorological Operational (METOP) satellite series. ASCAT was designed to observe wind speed and direction over the oceans and was initially not foreseen for monitoring soil moisture over land. Yet, as argued in this review paper, the characteristics of the ASCAT instrument, most importantly its wavelength (5.7 cm), its high radiometric accuracy, and its multiple-viewing capabilities make it an attractive sensor for measuring soil moisture. Moreover, given the operational status of ASCAT, and its promising long-term prospects, many geoscientific applications might benefit from using ASCAT soil moisture data. Nonetheless, the ASCAT soil moisture product is relatively complex, requiring a good understanding of its properties before it can be successfully used in applications. To provide a comprehensive overview of the major characteristics and caveats of the ASCAT soil moisture product, this paper describes the ASCAT instrument and the soil moisture processor and near-real-time distribution service implemented by the European Organisation for the Exploitation of Meteorological Satellites (EUMETSAT). A review of the most recent validation studies shows that the quality of ASCAT soil moisture product is - with the exception of arid environments - comparable to, and over some regions (e.g. Europe) even better than currently available soil moisture data derived from passive microwave sensors. Further, a review of applications studies shows that the use of the ASCAT soil moisture product is particularly advanced in the fields of numerical weather prediction and hydrologic modelling. But also in other application areas such as yield monitoring, epidemiologic modelling, or societal risks assessment some first progress can be noted. Considering the generally positive evaluation results, it is expected that the ASCAT soil moisture product will increasingly be used by a growing number of rather diverse land applications.
Derivation of leaf-area index from quality of light on the forest floor
[J].
DOI:10.2307/1936256
URL
[本文引用: 1]
Leaf-area index of a forest can be measured by determining the ratio of light at 800 mμ to that at 675 mμ on the forest floor. It is based on the principle that leaves absorb relatively more red than infrared light, and therefore, the more leaves that are present in the canopy, the greater will be the ratio.
A simple thermal model of the Earth’s surface for geologic mapping by remote sensing
[J].
DOI:10.1029/JB082i011p01673
URL
[本文引用: 1]
Thermal inertia of the earth's surface can be used in geologic mapping as a complement to surface reflectance data as provided by Landsat. Thermal inertia cannot be determined directly but must be inferred from radiation temperature measurements (by thermal IR sensors) made at various times in the diurnal cycle, combined with a model of the surface heating processes. We have developed a model which differs from models created previously for this purpose, because it includes sensible and latent heating. Tests of this model using field data indicate that it accurately determines the surface heating. When the model is used with field measurements of meteorological variables and is combined with remotely sensed temperature data, a thermal inertia image can be produced.
Thermal inertia mapping:A new view of the earth
[J].
DOI:10.1029/JC082i018p02582
URL
[本文引用: 1]
The thermal response of a substance to a time-varying surface power input is determined by its thermal inertia. Remote sensing (e.g., from satellites) can be utilized to measure this property, which is related to surface composition or to near-surface soil moisture. An algorithm is developed which relates thermal inertia to remote measurements of surface temperature and reflectance. Application to geosynchronous satellite data illustrates the contrast between irrigated and desert areas in the region north of the Gulf of California. The effect of local weather conditions (latent and sensible heat transfer to the atmosphere) must be estimated before precise values for thermal inertia can be specified.
On the analysis of thermal infrared imagery:The limited utility of apparent thermal inertia
[J].
DOI:10.1016/0034-4257(85)90038-0
URL
[本文引用: 2]
A spectral window in the thermal infrared permits observations of surface temperature by satellite radiometry. The Heat Capacity Mapping Mission (HCMM) acquired 10–12 μm data at times of day favorable for estimation of surface thermal properties and the surface energy budget. Two variables, surface wetness, which controls evaporation and hence mean surface temperature, and thermal inertia, which relates the diurnal excursion of surface temperature to ground heat flux, are responsible for most observed temperature variability. These variables may be estimated from the mid night (2:30 a.m.) and early afternoon (1:30 p.m.) data from the HCMM or from the afternoon NOAA satellites. However, the HCMM data product, “apparent thermal inertia,” is potentially misleading in agricultural areas because surface evaporation reduces the amplitude of the soil heat flux compared to the amplitude in dry areas. Thus apparent thermal inertia should not be used in regions having variability in surface moisture.
Detection of water stress in wheat by measurement of reflected solar and emitted thermal IR radiation
A method to make use of thermal infrared temperature and NDVI measurements to infer surface soil water content and fractional vegetation cover
[J].
DOI:10.1080/02757259409532220
URL
[本文引用: 2]
ABSTRACT A unique relationship between the surface soil moisture availability and the radiant temperature does not exist in the presence of variable vegetation cover. To overcome this ambiguity, the authors present a method which couples a Soil‐Vegetation‐Atmosphere‐Transfer (SVAT) model to satellite derived measurements of surface radiant temperature and Normalized Vegetation Difference Index (NDVI) to ascertain surface soil moisture availability and fractional vegetation cover.Application of the technique is demonstrated for an agricultural area in a Pennsylvania watershed. Results of surface soil moisture availability and fractional vegetation cover are qualitatively realistic but the distribution of soil moisture availability is questionable at high fractional vegetation amounts.
A simple interpretation of the surface temperature/vegetation index space for assessment of surface moisture status
[J].
DOI:10.1016/S0034-4257(01)00274-7
URL
[本文引用: 2]
A simplified land surface dryness index (Temperature egetation Dryness Index, TVDI) based on an empirical parameterisation of the relationship between surface temperature ( T s) and vegetation index (NDVI) is suggested. The index is related to soil moisture and, in comparison to existing interpretations of the T s/NDVI space, the index is conceptually and computationally straightforward. It is based on satellite derived information only, and the potential for operational application of the index is therefore large. The spatial pattern and temporal evolution in TVDI has been analysed using 37 NOAA-AVHRR images from 1990 covering part of the Ferlo region of northern, semiarid Senegal in West Africa. The spatial pattern in TVDI has been compared with simulations of soil moisture from a distributed hydrological model based on the MIKE SHE code. The spatial variation in TVDI reflects the variation in moisture on a finer scale than can be derived from the hydrological model in this case.
基于模糊物元的淮河流域城市化与生态环境系统的耦合协调测度
[J].<p>基于2010年淮河流域35个地级市城市化和生态环境指标数据,运用模糊物元分析模型建立城市化生态环境系统指标体系,采用熵值法确定指标权重,构造改进的城市化与生态环境耦合协调度函数,测度淮河流域城市化与生态环境系统交互耦合的协调程度.结果表明: 2010年,淮河流域城市化子系统的发展水平低于生态环境子系统,两者综合协调指数值为0.186,两类响应指标之间存在一定差距.城市化与生态环境耦合度的平均值为0.475,流域城市化生态环境系统处于颉颃阶段.不同城市的城市化发展子系统之间存在较大差异,而生态环境子系统现状发展水平之间差异相对较小.城市化与生态环境协调度的平均值为0.706,表明淮河流域正处于高度协调耦合阶段,城市化与生态环境建设的整体“功效”与“协同”效应较高.</p>
Coupling coordination measurement of urbanization and eco-environment system in Huaihe River Basin of China based on fuzzy matter element theory
[J].
MODIS数据预处理方法
[J].
DOI:10.11709/j.issn.1672-4623.2013.03.018
URL
[本文引用: 1]
时间、大气、太阳辐射的改变,导致获取的相邻遥感影像的对比度及光亮度产生差异,为了更好地进行分析、评价,需对遥感数据进行预处理。以新疆天山公路及其周边为研究区域,基于MODIS数据,利用ENVI软件进行数据的预处理,包括数据的几何校正、图像拼接、图像裁剪等,为其后进行的积雪研究作数据准备。
Pre-processing method of MODIS data
[J].
MODIS数据在湖北旱情监测中的应用
[J].
Application of MODIS data on the drought monitoring of Hubei Province
[J].
基于GIS的黄淮海平原旱灾遥感监测研究——作物缺水指数模型的实现
[J].
DOI:10.3321/j.issn:1000-0933.2000.02.009
URL
Magsci
[本文引用: 1]
研究黄淮海平原旱灾监测中作物缺水指数模型实现的方法 ,特别是以与遥感图象相同的分辨率来计算作物缺水指数采取的对气象数据的处理 ,以及在 GIS的支持下 ,对矢量格式的地形图及遥感图象的不同处理 ,以实现图象、图形、数据的一体化。从而得到所需的研究区旱情分布图等不同形式的结果。实时监测表明 :本方法精度高 ,可靠性强 ,基本上达到了准确、实时监测干旱的目的。
Remote sensing monitoring of drought in Huanghe, Huaihe and Haihe Plain based on GIS:The calculation of crop water stress index model
[J].
条件植被温度指数及其在干旱监测中的应用
[J].
DOI:10.3321/j.issn:1671-8860.2001.05.007
URL
[本文引用: 1]
应用NOAA-AVHRR数据,在用条件植被指数、条件温度指数和距平植被指数进行年度间相 对干旱程度监测的基础上,提出了条件植被温度指数的概念,它适用于监测某一特定年内某一时期(如旬)区域级的相对干旱程度.条件植被温度指数的定义既考虑 了区域内归一化植被指数的变化,又考虑了在归一化植被指数值相同条件下土地表面温度的变化.陕西省关中平原地区2000年3月下旬干旱的监测结果表明,条 件植被温度指数能较好地监测该区域的相对干旱程度,并可用于研究干旱程度的空间变化特征,对干旱的监测结果与用土壤热惯量模型反演的土壤表层含水量的结果 基本吻合.
Vegetation temperature condition index and its application for drought monitoring
[J].
Integration of remote sensing datasets for local scale assessment and prediction of drought
[J].
DOI:10.1016/j.scitotenv.2014.09.099
URL
PMID:25461052
[本文引用: 1]
Recent attempts to integrate remote sensing-based drought indices with precipitation data seem promising, and can compensate for potential uncertainties from image-based parameters alone, which may be unrelated to meteorological drought. However most remote sensing-based studies have been at regional or global scale and have not considered differences between different land cover types. This study examines a drought-prone region in Central Yunnan Province of China over a four-year period including a notable severe drought event in 2010. The study investigates the phase relationships between meteorological drought from image-based rainfall estimates from the Tropical Rainfall Measurement Mission (TRMM), and imaged drought from a remote sensing drought index, the Normalised Vegetation Supply Water Index (NVSWI) for different land cover types at local scale. The land cover types derived from MODIS and Landsat images were resampled to 250 m to match all datasets used. Significant differences between cover types are observed, with cropland and shrubland most highly correlated with 64 days' earlier rainfall and evergreen forest most responsive to rainfall 90 days earlier, indicating a need to consider detailed land cover information for accurate integrated drought indices. The finding that concurrent rainfall is only weakly correlated with observed drought, suggests that existing drought indices, which compute lowest weightings for the most distant lag period would be unrepresentative.
Regional drought monitoring and analyzing using MODIS data:A case study in Yunnan Province
基于遥感的旱区土壤湿度反演方法研究
[D].
Study on Soil Moisture Inversion Method Based on Remote Sensing
[D].
改进的表观热惯量法反演土壤含水量
[J].<p>提出一种改进的表观热惯量计算模型,以中科院栾城农业生态 系统试验站为基地,通过实测的模型参数,利用提出的表观热惯量模型计算不同植被覆盖下、不同实验区土壤含水量的热惯量值,并与土壤含水量进行相关性分析,以找到热惯量方法可以用来反演土壤含水量的适用条件(归一化植被指数NDVI的阈值)。实验结果表明,该模型监测土壤含水量是可行的,在植被覆盖度较低的情况下(<em>NDVI</em>≤0.35)具有较高的精度,在植被覆盖度较高(<em>NDVI</em>>0.35)时,热惯量模型失效,因此用热惯量方法反演土壤含水量植被覆盖时将<em>NDVI</em>阈值的最大值设为0.35。将该方法应用到MODIS数据中,以河北省栾城县、赵县、藁城市3 市县为研究区,分别反演该区土壤含水量,反演结果与实际情况相符合。实地取点人工监测土壤含水量为25.1%,栾城站模型计算结果为22.4%,匹配性较好,该方法在遥感数据中得到了很好的应用。</p>
The inversion of soil water content by the improved apparent thermal inertia
[J].
