

0 引言
遥感监测技术正广泛地应用于农业调查、林业调查、城市管理规划、基础地理数据库更新、土地退化和荒漠化监测、海洋和内陆水体监测、沿海区域环境监测、湿地监管、自然灾害监测以及军事侦察等社会经济各领域[1]。一方面,遥感技术应用推动着这些领域朝着更加深入的方向发展; 另一方面,领域应用的发展对监测产品的时空分辨率提出了更高的要求。因此,获取干净(无云、雾、雪及云阴影覆盖)的高时空分辨率系列影像数据至关重要。
然而,限于目前卫星技术的发展水平,卫星影像时间分辨率与空间分辨率之间存在难以调和的矛盾,加上云、雾、雪及云阴影等因素的影响,要获取干净的高时空分辨率序列影像非常困难。本文以高分一号(GF-1)卫星数据为例,在中国资源卫星应用中心网站上,设定时间范围为2013年4月26日—2016年4月1日,区域范围为北京市,能够查询到748景空间分辨率为16 m 的GF-1 WFV传感器影像; 然而,去除不能完整覆盖北京市及云、雾等遮挡严重的影像后,仅剩下68景,符合要求的影像占比不到10%。因此,研究一种影像模拟方法极具实用价值。
目前,学者们已经提出了一些影像模拟方法,其中一类是基于融合的方法,利用单一准则(例如最小红光波段)或多准则选择云量最小的“最佳”观测[2,3,4,5,6,7,8,9],将高时间分辨率低空间分辨率影像融合到高空间分辨率低时间分辨率卫星影像中,从而产生模拟影像。例如Hansen等[2]利用MODIS反演的森林覆盖产品校正缺少高时间分辨率数据的Landsat影像,实现了对刚果河森林的变化监测; Griffiths等[3]将影像获取日期、邻近像元到目标像元的距离考虑到影像模拟模型中,然后参照MODIS数据进行调整,以保证模拟影像的辐射一致性。另一类则基于像元解混技术,从低空间分辨率影像推算出高空间分辨率像元反射率,进而生成模拟影像。邬明权等[10]利用MODIS和Landsat影像数据结合土地利用分类数据综合对比了基于LORENZO模型、LIU模型和统计模型等利用像元解混技术的模拟方法。这些方法虽然取得了较好的效果,但是需要多源数据(即获取目标日期前后2景干净的高空间分辨率卫星影像以及若干低空间分辨率卫星影像),而且高空间分辨率影像的时间间隔直接影响到模拟影像的精度。本文将研究一种基于傅里叶谐波模型的能够利用单一数据源时间序列影像的模拟方法,旨在有效提高GF-1卫星影像时间分辨率。
1 研究区概况及数据源
1.1 研究区概况
本文以北京市为研究区。北京市地处华北平原与太行山脉以及燕山山脉的交接处,地理范围为E115°25'~117°30',N39°26'~41°03'; 区内植被、人工建筑物、水体等地物丰富,区块分布明显,极具代表性,利于验证模型的正确性与适用性。此外,北京市是我国政治、文化中心,科技创新中心和国际交往中心,对该区域进行研究具有典型的应用价值和意义。
1.2 数据源及其预处理
首先对2013年4月26日—2016年4月1日间所获取到的GF-1卫星WFV影像数据进行初步筛选,剔除对北京市地区覆盖不全和明显有云、雾覆盖的影像,得到68景影像; 接着使用ENVI5.3软件对初步筛选出的影像分别进行辐射校正、大气校正、几何纠正和裁剪等预处理,裁剪后的数据只覆盖北京市地区,小部分裁剪后的影像仍然存在少量云、雾覆盖的情况,这部分影像也被剔除; 然后选定1景影像作为基准影像进行配准,配准后所有影像的空间分辨率均重采样到16 m; 再次裁剪影像,使所有影像具有相同的幅宽和起始地理坐标,最终得到了46景实验影像。
2 基于谐波模型的地表反射率模型
简单模型只有4个参数,第一个参数
式中:
高级模型在简单模型的基础上引入
式中
完全模型则是在还有更多可用观测数据的情况下,在高级模型的基础上引入
式中
Verbesselt等[15]基于卫星时间序列影像,将一种类似的模型成功运用于森林扰动近实时检测。
图1(反射率已扩大104倍)显示了运用3种不同的地表反射率模型对北京市GF-1卫星影像波段1中心像元的拟合情况。从图1可以看出,简单模型(红色)只能模拟地表年内随着时间变化产生的简单变化,而高级模型(绿色)与完全模型(蓝色)则表现了影像数据随时间产生的复杂变化。理论上,越复杂的模型,精度越高。对于高空间分辨率影像中每个波段的每个像元,均需要拟合一个谐波模型。研究表明[13],为了使模型评估结果具有准确性和稳定性,观测数至少是模型系数个数的3倍。因此,如果观测数为12~18个,只能使用简单模型模拟地表反射率; 如果观测数在18~24个之间,则可使用高级模型模拟地表反射率; 如果观测数≥24,就可使用完全模型模拟地表反射率。针对不同的观测数可以使用的模型如表1所示。
图1
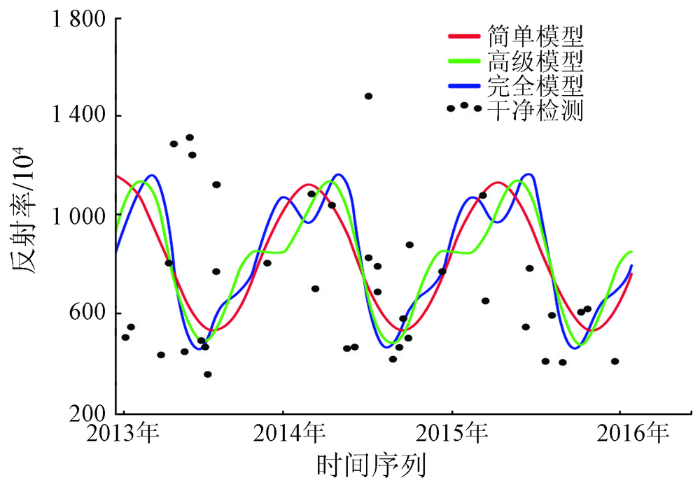
表1 观测数与模型选择
Tab.1
| 观测数 | 模型 |
|---|---|
| 0 | 置为背景值 |
| 1 | 置为该观测值 |
| 2~11 | 加权平均 |
| 12~17 | 简单模型 |
| 18~23 | 高级模型 |
| ≥24 | 完全模型 |
由于本研究获取了46景无云、雾、雪及云阴影覆盖的遥感影像,使用其中4景作为验证影像,还剩余42景作为建模输入,故可以采用完全模型对地表反射率进行模拟。3 实验结果与分析
3.1 实验过程
本研究包含2个实验,实验一的目的是以完全模型为例探究谐波模型模拟方法的精度与稳定性,实验二则是研究简单、高级和完全模型的适用性。
实验一的步骤包括模型生成与影像模拟。①以42景干净的GF-1 WFV影像作为输入数据,通过最小二乘法为每个波段每个像元解算出一个谐波地表反射率模型; ②指定2013年4月26日—2016年4月1日期间任意日期,并将该日期转换为儒略日作为步骤①生成的地表反射率模型的输入,估算单个像元的地表反射率,对模型覆盖范围内每个波段每个像元进行计算,即可模拟1景指定日期的GF-1卫星影像。为了评估基于谐波模型的影像模拟方法的精度与稳定性,本研究选用了简单的线性插值影像模拟方法与本文方法进行对比,即选取距离目标影像最近的前后2个时期的高空间分辨率影像,通过距离加权插值方法模拟目标影像。实验输入与精度验证影像参数设置详见表2(以影像获取日期为文件名)。
表2 实验一的输入与精度验证影像参数设置
Tab.2
| 模型 | 输入影像 | 目标影像 | 验证影像 |
|---|---|---|---|
| 谐波模型 | 2013年4月26日—2016年4月1日间42景干净影像 | 20150130① 20150518 20150815 20151101 | 20150130 20150518 20150815 20151101 |
| 线性模型 | 20150106,20150225 20150309,20150525 20150602,20150820 20151008,20151204 |
①以影像获取日期为文件名。
实验二分为5个小实验(分别编号为A,B,C,D,E),其基本步骤与实验一相同; 不同的是每个小实验的输入数据量不同,即从42景GF-1 WFV干净影像中选择不同景数影像分别实验,选择的模拟模型分别是简单、高级和完全模型中的一种,不再使用线性模型; 目标影像和验证影像均为20150130,实验输入影像与模型选择如表3所示。
表3 实验二的输入设置与模型选择
Tab.3
| 小实验编号 | 输入影像 | 模型 |
|---|---|---|
| A | 2015年内13景干净影像 | 简单模型 |
| B | 2014—2015年间26景干净影像 | 完全模型 |
| C | 2013—2016年间42景干净影像 | 简单模型 |
| D | 2013—2016年间42景干净影像 | 高级模型 |
| E | 2013—2016年间42景干净影像 | 完全模型 |
3.2 精度评定
为了评估模拟算法的精度,首先从视觉上对几组模拟影像与真实影像进行定性比较; 然后计算真实影像与模拟影像之间的差值影像,并对差值影像进行统计,从差值影像各波段直方图、最小值、最大值、平均值、标准差以及均方根误差(root mean square error,RMSE)几个维度对算法的影像模拟精度进行定量估计。
3.2.1 视觉对比
评估模拟影像准确性最简单的办法就是将模拟影像与同一日期真实影像进行对比。本研究模拟的4景GF-1影像,分属2015年的4个季节,都能获取到真实的覆盖北京地区的GF-1影像,能够评估算法在时间和空间上的适用性(图2)。
图2
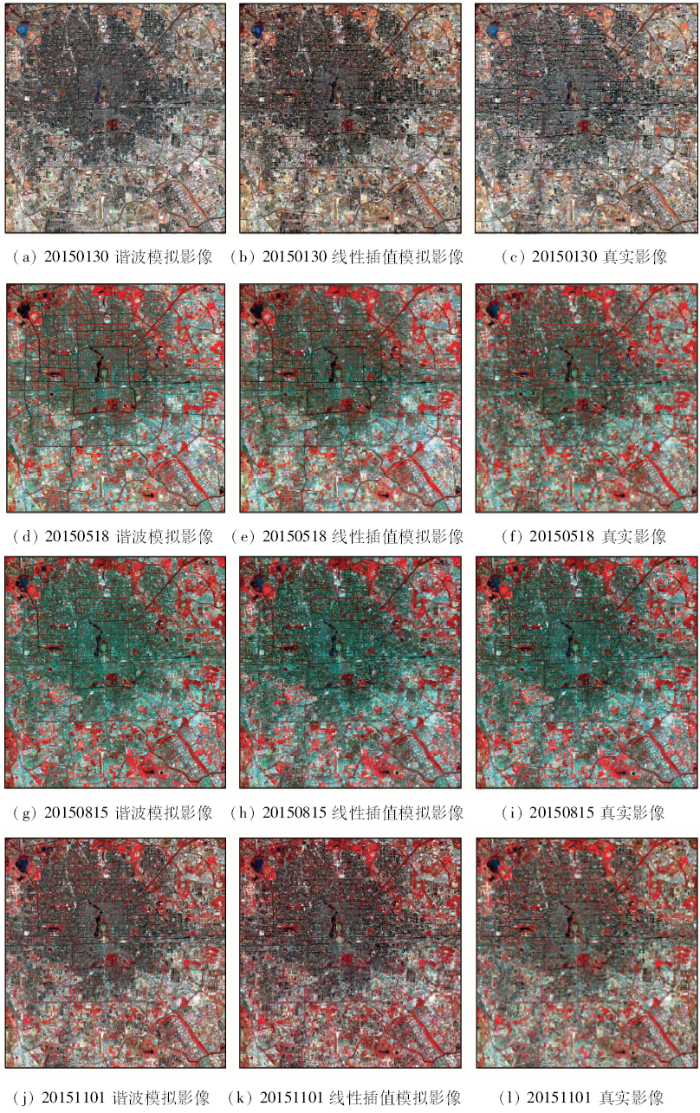
图2
基于谐波模型、线性插值模型生成的模拟影像与真实影像(B4(R),B3(G),B2(B)假彩色合成影像)
Fig.2
Synthetic images generated by harmonic model and linear interpolation model and real images
图3
3.2.2 定量评估
图4
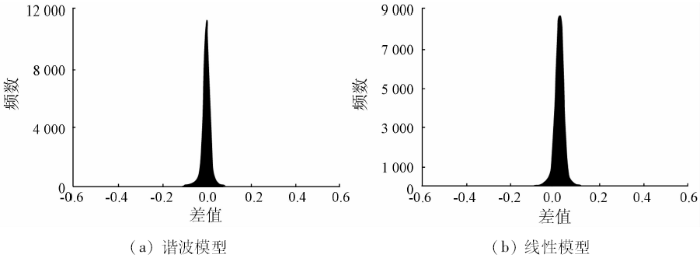
图4
模拟影像与真实影像波段1差值影像直方图
Fig.4
Histograms of difference image between synthetic image and real images
表4 模拟影像与真实影像之间差值影像统计
Tab.4
| 波段 | 模型 | 最小值 | 最大值 | 平均值 | 标准差 | RMSE |
|---|---|---|---|---|---|---|
波段1 | 谐波模型 | -0.574 1 | 0.452 4 | 0.002 4 | 0.018 4 | 0.019 0 |
| 线性插值模型 | -0.507 6 | 0.604 1 | -0.009 3 | 0.018 7 | 0.019 4 | |
波段2 | 谐波模型 | -0.531 9 | 0.317 7 | -0.015 1 | 0.021 3 | 0.027 5 |
| 线性插值模型 | -0.703 0 | 0.575 5 | -0.063 9 | 0.027 2 | 0.069 5 | |
波段3 | 谐波模型 | -0.491 0 | 0.401 4 | -0.037 3 | 0.026 4 | 0.051 0 |
| 线性插值模型 | -0.747 3 | 0.492 2 | -0.079 4 | 0.030 6 | 0.085 1 | |
波段4 | 谐波模型 | -0.374 1 | 0.547 3 | -0.003 0 | 0.020 5 | 0.022 9 |
| 线性插值模型 | -0.589 7 | 0.578 8 | -0.063 6 | 0.022 4 | 0.067 4 |
3.3 谐波模型适用性研究
表5 2015年1月30日模拟影像与真实影像之间的RMSE
Tab.5
| 波段 | A | B | C | D | E |
|---|---|---|---|---|---|
| 波段1 | 0.021 3 | 0.087 5 | 0.033 2 | 0.048 7 | 0.019 0 |
| 波段2 | 0.029 5 | 0.032 2 | 0.030 1 | 0.027 6 | 0.027 5 |
| 波段3 | 0.043 4 | 0.040 9 | 0.035 6 | 0.040 4 | 0.051 0 |
| 波段4 | 0.028 9 | 0.034 8 | 0.060 5 | 0.031 5 | 0.022 9 |
表6 2015年1月30日模拟影像与真实影像差值标准差
Tab.6
| 波段 | A | B | C | D | E |
|---|---|---|---|---|---|
| 波段1 | 0.020 5 | 0.021 5 | 0.023 5 | 0.020 4 | 0.018 4 |
| 波段2 | 0.028 9 | 0.031 8 | 0.028 1 | 0.027 0 | 0.021 3 |
| 波段3 | 0.033 2 | 0.036 1 | 0.034 0 | 0.034 4 | 0.026 4 |
| 波段4 | 0.025 7 | 0.028 4 | 0.026 6 | 0.027 8 | 0.020 5 |
表5中融合影像与真实影像之间的RMSE结果表明,当数据量增大时,简单模型由于过拟合导致精度下降(C),而完全模型精度则随着数据量增大而增高(E)。
表6所示差值影像标准差表明,当数据量较大时,简单模型出现了过拟合的情况,稳定性降低; 而完全模型则没有出现过拟合,数据量增大时,模型稳定性增加。对比实验C,D和E(模型依次为简单、高级、完全,数据量相同),表5与表6中的数据均表明,融合准确性及稳定性与模型的复杂度并不是正相关的,例如完全模型(表5,E)第3波段准确性低于高级模型(表5,D),其他波段高于高级模型; 高级模型(表6,D)模拟影像第4波段稳定性低于存在过拟合问题的简单模型(表6,C),而第1波段高于简单模型(表6,C)。可见,每一种模型的准确性和稳定度是模型复杂度、输入影像数量和影像波段特性综合作用的结果,实际应用中应根据模拟影像精度评定结果确定使用的模型。
4 结论
1)通过使用国产高分一号(GF-1)卫星已有的观测数据和基于谐波的地表反射率模型模拟影像,利用时间序列影像挖掘地表反射率的年内变化,弥补在特定时期内不能获取足够接近目标日期的输入影像造成的精度影响,有效地提高了GF-1卫星影像的时间分辨率,模拟的高分辨率影像具有较高的精度与稳定性。
2)因为谐波地表反射率模型可以模拟季节性的地表反射率变化,模拟影像将不受太阳角度变化的影响。
3)该方法3种模型的准确性和稳定性是由模型复杂度、输入影像数量和影像波段特性综合作用共同决定的,实际应用中应该根据模拟影像精度评定结果确定使用的模型。
基于谐波模型的影像模拟方法应用于GF-1影像虽然取得了较好效果,但是还有许多问题需要深入研究。首先,最小二乘法容易出现过拟合问题,所以需要考虑更稳健的模型解算方法; 其次,模型不能够模拟人为造成的地表突变,限制了该方法在实际生产环境中的应用,需要进一步探索相应的解决方案。
参考文献
A method for integrating MODIS and Landsat data for systematic monitoring of forest cover and change in the Congo Basin
[J].DOI:10.1016/j.rse.2007.11.012 URL [本文引用: 2]
A pixel-based Landsat compositing algorithm for large area land cover mapping
[J].
DOI:10.1109/JSTARS.2012.2228167
URL
[本文引用: 2]

Information on the changing land surface is required at high spatial resolutions as many processes cannot be resolved using coarse resolution data. Deriving such information over large areas for Landsat data, however, still faces numerous challenges. Image compositing offers great potential to circumvent such shortcomings. We here present a compositing algorithm that facilitates creating cloud free, seasonally and radiometrically consistent datasets from the Landsat archive. A parametric weighting scheme allows for flexibly utilizing different pixel characteristics for optimized compositing. We describe in detail the development of three parameter decision functions: acquisition year, day of year and distance to clouds. Our test site covers 42 Landsat footprints in Eastern Europe and we produced three annual composites. We evaluated seasonal and annual consistency and compared our composites to BRDF normalized MODIS reflectance products. Finally, we also evaluated how well the composites work for land cover mapping. Results prove that our algorithm allows for creating seasonally consistent large area composites. Radiometric correspondence to MODIS was high (up to R-2 > 0.8), but varied with land cover configuration and selected image acquisition dates. Land cover mapping yielded promising results (overall accuracy 72%). Class delineations were regionally consistent with minimal effort for training data. Class specific accuracies increased considerably (similar to 10%) when spectral metrics were incorporated. Our study highlights the value of compositing in general and for Landsat data in particular, allowing for regional to global LULCC mapping at high spatial resolutions.
Evaluation of compositing algorithms for AVHRR data over land
[J].
DOI:10.1109/36.295057
URL
[本文引用: 1]
The objective of this study was to evaluate alternative methods for producing both Normalized Difference Vegetation Index (NDVI) and single-channel composite images of land surfaces from the Advanced Very High Resolution Radiometer (AVHRR). As a goal, it was specified that the composite image should approximate as much as possible a single-date image with a constant, near-nadir geometry. The comparative performance of three single-step [maximum NDVI (MaN), maximum apparent temperature (MaT), maximum difference of channels 2 minus 1 (MaD)] and two two-step [maximum NDVI followed by maximum temperature (MaNMaT) or by minimum scan angle (MaNMiSc)] criteria in creating composite images was evaluated for three land cover types, namely, cropland, coniferous forest, and deciduous forest within a boreal ecosystem. The assessment was carried out using 18 images obtained with various acquisition geometries in mid-summer over a 1000脳1000 km area in Manitoba, Canada. In addition, MaT performance was compared with that of MaN for all Canada during two compositing periods. It was found that among the five criteria tested, MaT and MaNMiSc were the most effective one- and two-step criteria, respectively. MaN preferentially selected off-nadir pixels from the forescatter region, the degree varying with land cover type; the overall NDVI values were higher than for MaT. MaD showed a very strong preference for high backscatter region pixels, regardless of land cover type. Depending on cover type, the NDVI values resulting from Mao were higher or lower than those from a nadir image. Based on ranking of the five techniques using statistics of the differences between composite and reference images, it was found that MaT and MaNMiSc performed similarly, and better than the remaining criteria. Results of the tests show that although statistically reasonable approximations of the reference image could be produced by one or more methods, none of the criteria could consistently yield composites closely resembling the nadir image on a pixel basis, even for a reasonably long compositing period. Therefore, pixel-specific applications of the composites relying on individual channels will likely have to be based on data corrected for bidirectional effects. The results suggest that such corrections are also required for NDVI and, by analogy, for other AVHRR channel combinations
Characteristics of maximum-value composite images from temporal AVHRR data
[J].DOI:10.1080/01431168608948945 URL [本文引用: 1]
Developing clear-sky,cloud and cloud shadow mask for producing clear-sky composites at 250-meter spatial resolution for the seven MODIS land bands over Canada and North America
[J].DOI:10.1016/j.rse.2008.06.010 URL [本文引用: 1]
Web-enabled Landsat data (WELD):Landsat ETM+ composited mosaics of the conterminous United States
[J].DOI:10.1016/j.rse.2009.08.011 URL [本文引用: 1]
Viewing geometry of AVHRR image composites derived using multiple criteria
[J].
DOI:10.1016/S0924-2716(97)00008-7
URL
[本文引用: 1]
Abstract The U.S. Geological Survey currently generates composites of A VHRR imagery based on a single objective - maximizing the Normalized Difference Vegetation Index (NDVI) - as a means of reducing cloud contamination. Our research supports the findings of others that, in some cases, NDVI is maximized at the expense of optimal viewing geometry; that is, satellite zenith angles are often further off-nadir than necessary to ensure cloud-free viewing. We explore various compositing methods by systematically varying weights on NDVI, satellite zenith angle, and maximum apparent temperature. A test composite of California from September 1990 appears to be superior to the maximum NDVI and maximum apparent temperature composites in several respects. First, the satellite zenith angle distribution is more closely clustered about nadir, which minimizes atmospheric path length, spatial distortion) and bidirectional reflectance effects. Second, neighboring pixels are more frequently selected with similar viewing geometry and atmospheric conditions.
Pixel-based image compositing for large-area dense time series applications and science
[J].
DOI:10.1080/07038992.2014.945827
URL
[本文引用: 1]
Free and open access to the more than 40 years of data captured in the Landsat archive, combined with improvements in standardized image products and increasing computer processing and storage capabilities, have enabled the production of large-area, cloud-free, surface reflectance pixel-based image composites. Best-available-pixel (BAP) composites represent a new paradigm in remote sensing that is no longer reliant on scene-based analysis. A time series of these BAP image composites affords novel opportunities to generate information products characterizing land cover, land cover change, and forest structural attributes in a manner that is dynamic, transparent, systematic, repeatable, and spatially exhaustive. Herein, we articulate the information needs associated with forest ecosystem science and monitoring in a Canadian context, and indicate how these new image compositing approaches and subsequent derived products can enable us to address these needs. We highlight some of the issues and opportunities associated with an image compositing approach and demonstrate annual composite products at a national-scale for a single year, with more detailed analyses for two prototype areas using 15 years of Landsat data. Recommendations concerning how to best link compositing decisions to the desired use of the composite (and the information need) are presented, along with future research directions.
多源遥感数据时空融合模型应用分析
[J].
DOI:10.3724/SP.J.1047.2014.00776
Magsci
[本文引用: 1]
<p>多源遥感数据时空融合模型是解决目前遥感数据获取能力不足问题的重要方法之一,当前主要融合方法的研究,集中于平原区域,缺乏复杂条件下的多源遥感数据融合技术的应用研究。针对我国南方复杂条件,本文对比研究了多源遥感数据时空融合模型在我国南方复杂条件下的应用能力。针对LORENZO模型、LIU模型、统计回归模型、STARFM和ESTARFM 5种主流多源遥感数据时空融合模型,采用Landsat-ETM+和MODIS数据,以江苏省南京市的小块区域为实验区,利用5种模型生产融合影像,以真实Landsat-ETM+数据为模板,定性和定量评价融合效果的好坏。结果表明:除LORENZO模型外,其余4种模型获得的融合影像与真实影像之间都具有较高的相关性,相关系数均高于0.6,其中,ESTARFM模型的融合影像与真实影像间的相关性最高,融合效果最好,其次为STARFM模型,再次为LIU模型和统计模型法。在融合过程中采用距离、时间和光谱等信息越多,融合效果越好,在复杂地区的适用能力越强,融合影像更能反映地物的细节特征。</p>
Assessing the accuracy of spatial and temporal image fusion model of complex area in South China
[J].
Continuous change detection and classification of land cover using all available Landsat data
[J].
DOI:10.1016/j.rse.2014.01.011
URL
[本文引用: 2]
61A new algorithm for Continuous Change Detection and Classification of land cover61All available (a total of 519) Landsat images from Path 12 Row 31 were used.61It can detect many kinds of land cover change continuously.61It can provide land cover maps for any given time.61The results were accurate both in change detection and classification.
Generating synthetic Landsat images based on all available Landsat data:Predicting Landsat surface reflectance at any given time
[J].DOI:10.1016/j.rse.2015.02.009 URL [本文引用: 1]
Near real-time disturbance detection using satellite image time series
[J].
DOI:10.1016/j.rse.2012.02.022
URL
[本文引用: 1]
78 We propose a new time series based near real-time change monitoring approach. 78 The method is robust, fast and does not require gap filling or smoothing. 78 A wide range of in-situ and remote sensing data series can be analysed. 78 Drought related disturbances are detected in southern Somalia as an example. 78 Functionality is available via the 'bfast' package for R.
