

0 引言
水循环促进了自然界的物质运动和能量交换,对气候的形成与变化产生了深刻影响。流域降水量是影响流域水循环最重要的因素。有“亚洲水塔”之称的青藏高原是亚洲大江大河的发源地,印度河、恒河、雅鲁藏布江、长江和黄河均源自青藏高原[1,2]。因此,青藏高原的流域的降水资料对我国乃至全球的水文、气象、生态和农业等领域的发展具有重要的研究意义。与气象站点降水资料相比,卫星资料空间覆盖连续,有助于解决研究区站点数量不足、分布不均匀的问题。但是,由于探测平台的限制,卫星遥感降水产品的分辨率仍然无法满足流域尺度研究的要求。为进一步了解青藏高原流域尺度上降水的时空分布特征,需要开展青藏高原遥感降水数据的空间降尺度方法的研究。
目前,空间降尺度方法主要有动力降尺度和统计降尺度2种。空间动力降尺度是借助全球环流模式(global climate models, GCMs)和嵌套区域气候模式(regional climate models, RCMs)来提高气象要素的空间分辨率。该方法不受观测资料的影响,但其计算量大、模型不易构造,获得的气象要素的空间分辨率不能满足区域尺度的要求[4]。统计降尺度充分考虑到局地气候不仅以大尺度气候为背景,且顾及下垫面特征的影响,利用下垫面特征信息建立大尺度和小尺度气候变量的联系[5]。与空间动力降尺度方法相比,统计降尺度方法构造的模型更加灵活多样,引入较高空间分辨率的区域下垫面特征变量,能大大提高遥感降水资料的空间分辨率[6]。2009年Immerzeel团队以欧洲南部伊比利亚半岛为例,基于降水与植被的关系,采用热带降水测量计划卫星(Tropical Rainfall Measuring Mission, TRMM)降水数据与SPOT -VEGETATION 归一化植被指数(normalized difference vegetation index, NDVI)数据,建立了的指数回归降尺度模型,最终将TRMM降水数据降尺度为1 km分辨率。基于Immerzeel的研究,2011年贾绍凤研究团队开展了柴达木盆地降水降尺度研究,同时引入了植被数据SPOT-VEGETATION NDVI和航天飞机雷达地形测绘任务地形数据(Shuttle Radar Topography Mission,SRTM) 数字高程模型(digital elevation model,DEM)因子作为流域降水的影响因子,建立了多元线性回归模型,也得到了1 km空间分辨率的降水数据 [8]。与Immerzeel团队的研究相比,后者引入DEM变量代表地形因子参与建模,并对降水的降尺度结果进行了误差分析,进一步提高了降水资料的准确性。此外,非线性时间序列可以提高降水的预测精度[16]。在诸多非参数统计回归模型中,随机森林算法在分类和预测方面对自变量的多元共线性不敏感,可以同时输入多个影响因子,在很大程度上解决了过度拟合的问题等。因此,本文基于Immerzeel和贾绍凤研究团队的研究和随机森林算法的优势,选择NDVI,DEM,坡度、坡向和经纬度信息,针对青藏高原流域的长时间序列TRMM遥感降水数据,开展了空间统计降尺度分析研究。
1 研究区概况
受孟加拉湾暖湿空气的影响,雅鲁藏布江大拐弯区域年降水十分充沛; 高原的腹地湖泊数量较多,湖泊集聚区的降水分布普遍高于周围地区; 而受喜马拉雅山体影响,来自印度洋的水汽输送受到阻挡,喜马拉雅山北坡的降水明显少于周围地区。总体而言,青藏高原降水空间分布呈现自东南向西北递减、自南向北逐渐减少的趋势[14]。
2 数据源及其处理
2.1 TRMM卫星降水数据与气象站降水数据
TRMM是世界上第一颗搭载测雨雷达的卫星,携带了微波成像仪、可见光和红外扫描仪[15]。TRMM3B43产品综合了4类相互独立的降水数据,包括微波、近红外等传感器融合估算数据,以及美国国家海洋、大气管理局和全球降水气候中心的降水雨量计分析数据等[14],是卫星降水数据与其他降水数据联合反演的最佳降水产品。本文选用2000—2012年间空间分辨率为0.25°×0.25°的TRMM3B43日降水产品,对青藏高原地区进行降水数据降尺度研究,数据由中国气象科学数据共享服务网站提供。此外,采用研究区内92个站点气象站点在2000—2012年间降水观测数据作为参照。与站点实测降水量相比,TRMM3B43数据产品普遍存在高估的现象(图1)。已有学者研究发现,利用最小二乘方法建立TRMM3B43与站点降水数据的幂函数回归模型,可以取得较好的校准效果[8]。
图1

图1
气象站与TRMM降水数据的回归分析图
Fig.1
Regression analysis of precipitation data from weather station and TRMM
图1中,纵坐标表示气象站点年总降水量,横坐标是TRMM年均降水量,幂函数作为回归方程时,判断系数为0.78,拟合方程为
式中: v为气象站年均实测降雨量; u为校准后的TRMM3B43年均降雨量。图中虚线为y=x线,由此可见经校准模型修正后的数据较好地克服了TRMM原始数据在研究区内对降雨量高估的问题。图2为青藏高原地区TRMM校准后的多年平均降水分布情况。
图2

图2
2001年青藏高原TRMM降水量空间分布图
Fig.2
Spatial distribution of TRMM precipitation in the Tibet Plateau in 2001
式中: ll(i,j)表示第i列第j行像元的经纬度比; lon(i,j)和lat (i,j)分别表示第i列第j行像元的经度和纬度。
2.2 归一化差值植被指数数据
本文采用最大合成算法(maximum value composite,MVC)计算每个像元的月最大值,并计算每一年12个月最大NDVI数据的年平均值,应用最邻近像元法将8 km分辨率数据重采样为0.25°分辨率。图3以2001年为例,青藏高原地区年平均NDVI空间分布,可知植被分布的总体趋势,与降水量分布的总体趋势大致相同。
图3

图3
2001年青藏高原NOAA-AVHRR NDVI空间分布图
Fig.3
Spatial distribution of NDVI from NOAA-AVHRR in the Tibet Plateau in 2001
2.3 SRTM DEM数据
梭雷达地形测量任务是由美国国家地理空间情报局(NGA)和NASA共同推行的国际研究项目。其雷达系统可获得56°S~60°N近全球覆盖范围的数字高程模型,空间分辨率有30 m和90 m两种。本次研究采用青藏高原地区90 m分辨率的DEM数据,并变换为0.25°尺度。数据由http: //gdem.ersdac.jspacesystem.org提供。在模型建立的过程中,除DEM外,并根据青藏高原DEM数据提取坡向和坡度数据[21]。
3 方法
3.1 降尺度方法
3.1.1 随机森林算法
随机森林算法(random forest,RF)在分类和预测方面具有优势,目前已被广泛地应用于降水和生态等诸多领域。20世纪80年代Breiman等人将分类树方法发展成为随机森林算法。与神经网络算法相比,其计算量小且精度较高。该算法的优点在于: ①对多种资料,可以产生高准确度的分类器; ②可处理大量的输入变量; ③在决定类别时,能够评估变量的重要性。鉴于降水与多个变量存在相关关系,模型不仅需要多个输入变量,而且有大量数据作为训练样本。因此,本次研究采用随机森林算法建立降尺度模型是可行的。
本文应用R软件中随机森林程序包作为建模工具,针对本文的研究问题进行建模,表1简单地罗列了该程序包中包含的主要函数。
表1 随机森林包主要函数名与功能
Tab.1
| 函数名 | 函数功能 |
|---|---|
| Random Forest | 建立随机森林模型 |
| Plot | 绘制误差曲线 |
| Predict | 模型预测 |
3.1.2 模型的假设
已有研究表明,NDVI是降水量降尺度模型的重要输入因子。由于本文研究区内存在水体,它们对分析植被与降水的统计关系有很大的影响。因此,在建立模型的过程中不考虑NDVI小于等于零的样本,将其视为异常值从数据中剔除。
3.1.3 模型的准备与建立
本次研究基于随机森林算法,以2001年为例对校准后的TRMM降水数据进行降尺度方法的研究,步骤如下: ①分别将8个变量:降雨量(precipitation),降水与归一化差值植被指数(NDVI)、数字高程(DEM)、经纬度比值(ll)、坡向(aspect),坡度(slope),经度(lontitude)及纬度(lattitude)读入数组中,使每个数组对应位置的元素值代表图像中同一个像元的特征,并写入同一个矩阵中; ②剔除异常值; ③将数据随机分成大小相同的两组,组1数据作为建模样本,组2数据用来检验; ④利用R软件的建模工具,建立Random Forest模型; ⑤输入组2模型进行检验。
3.1.4 模型的应用
对上节中建立的模型进行有效性检验后,本节将对降水数据进行降尺度计算,具体步骤为: ①采用最邻近像元法将NDVI,DEM,ll,slope及aspect原始数据重采样为8 km×8 km分辨率数据; ②按照模型输入变量的数据格式,创建经纬度和经纬度比值数据; ③剔除异常值; ④输入已建立随机森林,计算8 km分辨率的降水量; ⑤采用最邻近像元法,对未进行降雨量预测的异常值像元进行降雨量插值; ⑥将上文获得的订正误差与预测值求和,计算得到降尺度结果; ⑦采用最邻近像元法获得与气象站位置对应像元降尺度结果,与气象站数据进行回归分析。
3.2 降水量的预测
降水量变化是典型的非线性时间序列,其中包含了大量的时序动态变化特征。由表2 可知,降水量与环境具有强相关性。目前常见的预测方法是将相关因子作为输入向量,建立多元回归预测模型,这种方法考虑了环境因子对降水时序变化的影响,但是缺乏时序动态分析,不能反映内部变化规律; 另一种常见的方法是时间序列分析,该方法充分考虑了降水变化的内部因子,却忽略了降水与外在因子之间的关联,进而影响预测精度。
表2 降水与其他变量的线性相关性
Tab.2
| 变量 | TRMM | NDVI | DEM | ll | aspect | slope | lon | lat |
|---|---|---|---|---|---|---|---|---|
| TRMM | 1.000 | 0.570 | -0.277 | 0.788 | 0.001 | 0.432 | 0.398 | -0.703 |
| NDVI | 0.570 | 1.000 | -0.277 | 0.702 | -0.022 | 0.280 | 0.682 | -0.391 |
| DEM | -0.277 | -0.277 | 1.000 | -0.204 | 0.076 | -0.086 | -0.476 | -0.171 |
| ll | 0.788 | 0.701 | -0.203 | 1.000 | -0.004 | 0.345 | 0.675 | -0.780 |
| aspect | 0.001 | -0.021 | 0.076 | -0.004 | 1.000 | 0.009 | -0.009 | 0.001 |
| slope | 0.432 | 0.280 | -0.086 | 0.345 | 0.009 | 1.000 | 0.137 | -0.318 |
| lon | 0.398 | 0.682 | -0.476 | 0.675 | -0.009 | 0.137 | 1.000 | -0.074 |
| lat | -0.703 | -0.391 | -0.171 | -0.780 | 0.001 | -0.318 | -0.074 | 1.000 |
为了提高降水量预测精度,本次研究在考虑降水变化时序动态变化特征的同时,引入了环境因子,基于随机森林算法建立降水量的预测模型。步骤如下: 首先,需要为模型定阶,即判断降水受自身发生量影响的时效长短,采用F测验进行逐步比较确定,本次研究采用2000—2012年均降水数据作为研究对象,预测时效期为预测时间点的前5 a; 然后,将时效时间段内的发生量作为降水内部变化的描述因子,并选择NDVI作为外在影响因子,基于随机森林算法建立非线性预测模型; 将2000—2004年和2005年降水数据和2005年NDVI数据作为输入向量,建立预测模型,随后将2001—2005年降水数据和2006年NDVI数据作为输入向量,预测2006年降水量。4 结果分析与检验
4.1 降尺度模型的检验
图4

图4
随机森林模型预测值与校准的TRMM3B43检验值拟合图
Fig.4
Random forest model predictions and calibrated TRMM3B43 values
图4中,纵坐标代表对模型输入检验数据集的自变量后,输出的降水量的预测值,横坐标代表检验数据集中的TRMM校正值,两者的判断系数R2为 0.87。
4.2 模型的比较
鉴于贾绍凤团队采用线性回归模型,对柴达木盆地的TRMM降水产品进行降尺度研究,其模型取得了较好的检验精度。本文建立降水量与其他自然地理变量之间的线性回归模型,与随机森林模型比较。如表2列出了降水与归一化差值植被指数(NDVI)、数字高程(DEM)、经纬度比值(ll)、坡向(aspect)、坡度(slope)和经纬度(lon和lat)的线性相关性。
根据变量之间的线性相关系数明显可知,降雨量与另外7个变量之间的相关性差别较大。因此,本文采用向后逐步回归的方法,在0.25°分辨率下从模型包含所有预测变量开始,一次删除一个变量直到会影响模型变量(Akaike information criterion, AIC)为止,即
式中: k为参数的数量; L为对数似然值; n为样本数目; sse为残差平方和。AIC的大小取决于L和k。k取值越小,AIC越小; L取值越大,AIC值越小。k小表明模型简洁,L大表明模型精确。因此AIC和修正的决定系数类似,在评价模型是兼顾了简洁性和精确性。
经后向逐步回归分析后本文建立了降水与NDVI,DEM,slope,lon,lat和ll,6个变量(X1,X2,X3,X4,X5和X6)间多元线性回归模型(图5)。模型预测值与检验值的判断系数为0.77。鉴于模型拟合效果不如基于随机森林的降尺度模型效果好,本文选择后者对青藏高原地区降水数据进行降尺度研究。
图5

图5
多元线性模型预测值与校准的TRMM3B43检验值拟合图
Fig.5
Multivariate linear model predictions and calibrated TRMM3B43 values
4.3 降尺度结果与精度检验
图6

图6
2001年青藏高原TRMM降水校准值空间分布图
Fig.6
Spatial distribution of TRMM precipitation calibration value of Tibet Plateau in 2001
图7

图7
2001年青藏高原随机森林输出结果空间分布图
Fig.7
Spatial distribution of random forest output in the Tibet Plateau in 2001
图8
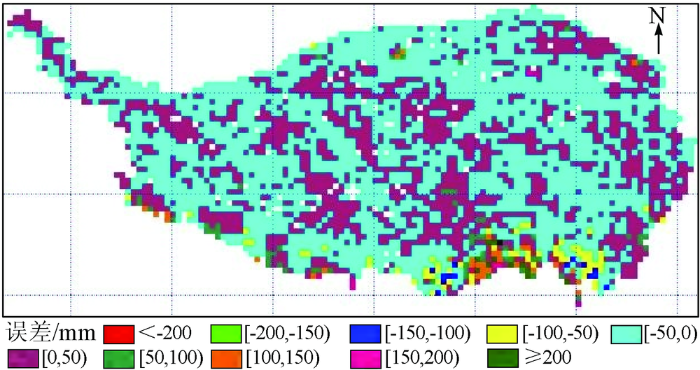
图8
8 km×8 km空间分辨率误差分布图
Fig.8
8 km × 8 km spatial resolution error distribution
图9

图10

图10
TRMM校准值和降尺度结果与站点降水量回归分析图
Fig.10
TRMM calibration and downscaling results with site precipitation analysis
4.4 降水量预测方法结果与检验
图11分别为研究区内5个观测站点降水量测量值和预测结果随时间变化的曲线。5个站点依次为昌都站(31.15°N,97.17°E)、那曲站(31.48°N,92.07°E)、林芝站(29.67°N,94.33°E)、拉萨站(29.7°N,91.13°E)和日喀则站(29.25°N,88.88°E)。分析表明,在5个观测站点处的降水量预测值有效地描述了降水的年际变化趋势和降水量的数量级。
图11

图11
5个站点观测值与预测值的年际变化曲线
Fig.11
Interannual variation of observed and predicted values for five sites
采用上述预测方法,预测结果与原始TRMM降水数据的拟合系数见表3。
表3 2006—2012年预测结果与校准后的TRMM降水量拟合系数
Tab.3
| 年份 | 2006 年 | 2007 年 | 2008 年 | 2009 年 | 2000 年 | 2010 年 | 2011 年 | 2012 年 |
|---|---|---|---|---|---|---|---|---|
| R2 | 0.87 | 0.87 | 0.85 | 0.81 | 0.85 | 0.87 | 0.85 | 0.87 |
4.5 降水数据精度对结果精度的影响
本文采用TRMM3B43产品进行降尺度研究。该产品综合了4类相互独立的降水数据,包括微波、近红外等传感器融合估算数据,以及美国国家海洋、大气管理局和全球降水气候中心的降水雨量计分析数据等[14],是卫星降水数据与其他降水数据联合反演的最佳降水产品。首先,数据产品本身存在误差,该误差可能由2方面引起: ①在观测4类相互独立降水数据的过程中引入了误差; ②使用联合反演算法进行数据融合的过程中引入了误差。其次,本次研究采用站点观测数据虽对TRMM3B43原始数据进行了校准,但所用的站点数据较少且分布不匀,导致校准模型在校准过程中引入了误差。以上各种误差均可影响降水数据的真实性,进而降低了降尺度结果的精度。
4.6 输入变量对结果精度的影响
降水是受多种因素影响的气象要素。本次研究仅仅考虑了植被和地形因素对其产生的作用,忽略了气候带、海陆位置、季风和人类活动等因素对降水的影响。另外,本次研究模型的输入变量并不具有相互独立性,在一定程度上降低了模型的有效性,因而影响了降尺度结果的准确性。
影响预测结果精度的因素主要有2个方面: ①统计模型缺乏物理机制,无法充分描述内部和外部因子对降水变化的影响。②本次研究所采用的降水数据为TRMM3B43的2000—2012年间的年均降水数据,时间尺度较短,因而影响了时间序列分析的有效性和准确性,使预测结果无法达到理想的精度。
5 结论
基于已有青藏高原的遥感降水等资料,本文根据降水与植被和地形因子的相关关系,使用TRMM3B43降水、NOAA-AVHRR NDVI和SRTM DEM等数据,采用随机森林算法建立了0.25°尺度下的降尺度模型,并求出了该尺度下的误差分布,采用最邻近像元方法插值为8 km分辨率,结合8 km模型预测值计算得出了青藏高原降水分布的降尺度结果。经分析验证,降尺度结果与地面站点降水量观测数据的R2为0.89,高于TRMM3B43校准值与地面站点降水量观测数据的R2(0.81)。此外,综合考虑内部因子和外部因子对降水变化的影响,基于随机森林算法,融合时间序列分析和多元回归分析,建立降水量预测模型,有效地描述了降水的年际变化趋势和降水量的数量级,并且2000—2012年均降水量预测结果与TRMM3B43降水数据拟合系数均达到0.8以上。因此本研究得出了下述认识:
1)基于下垫面因子和随机森林算法的降尺度方法,能够较准确地估计实际降水情况,不仅可提高卫星遥感降水产品的空间分辨率,同时可提高原始数据的反演精度。
2)融合时间序列分析的降水预测模型,可以有效地描述降水的年际变化趋势和降水量的数量级。
参考文献
我国青藏高原气候动力学研究的近期进展
[J].
Recent progress in the study of the Qinghai-Xizang plateau climate dynamics in China
[J].
Van Beek L P H,Bierkens M F P.Climate change will affect the Asian water towers
[J].
TRMM3B43降水产品在西藏地区的精度检验和应用
[J].以西藏地区38个国家基准站和基本站的实测降水资料,利用双线性插值、相关系数、散点斜率和相对误差等指标,对热带降水测量卫星(TRMM)的3B43降水产品的精度进行检验和分析。结果表明:月尺度上,整体而言TRMM3B43降水产品与实测降水量具有较好的一致性,其中西藏西部和东部喜马拉雅山脉东段北麓地区相关性相对较差,平均相对误差较大。年尺度上TRMM3B43降水产品的相关性不如月尺度好,平均相对误差随统计数值的增大而减小。在应用TRMM3B43降水产品进行流域面雨量估算时,采用气象站点实测降水资料校准TRMM3B43降水产品的T-G联合法,对TRMM3B43降水产品进行订正。
Application and accuracy testing of TRMM3B43 rainfall product in Tibetan Region
[J].
气象资料的统计降尺度方法综述
[J].<p>统计降尺度是解决由气象模式输出的低分辨率资料到流域尺度资料转换的手段之一,已成为一个重要的研究领域。统计降尺度方法十分丰富,分为传递函数法、天气形势法和天气发生器3类,3类之间并无严格的界限。统计降尺度涉及到时间与空间降尺度、随机型与确定型降尺度、时间自相关与空间相关性以及面向格点与面向站点的降尺度这4个方面的属性与分类问题,各种具体方法在这些方面的表现有所不同。近年来,相似法、隐马尓可夫模型、广义线性模型、Poisson点过程以及乘性瀑布过程获得了较大的发展和应用,并诞生了各种非线性模型以及物理—统计模型等新方法,已有一些影响较大的统计降尺度模型软件。新的方法在不断涌现,其中非线性模型、气候情境随机模拟技术、短期预报资料降尺度技术以及结合物理机理的统计降尺度方法是未来的主要发展趋势。</p>
A summary of methods for statistical downscaling of meteorological data
[J].
Stochastic characterization of regional circulation patterns for climate model diagnosis and estimation of local precipitation
[J].DOI:10.1175/1520-0442(1995)008<1023:SCORCP>2.0.CO;2 URL [本文引用: 1]
A spatiotemporal model for downscaling precipitation occurrence and amounts
[J].
DOI:10.1029/1999JD900119
URL
[本文引用: 1]

A stochastic model that relates synoptic atmospheric data to daily precipitation at a network of gages is presented. The model extends the nonhomogeneous hidden Markov model (NHMM) of Hughes et al. by incorporating precipitation amounts. The NHMM assumes that multisite, daily precipitation occurrence patterns are driven by a finite number of unobserved weather states that evolve temporally according to a first-order Markov chain. The state transition probabilities are a function of observed or modeled synoptic scale atmospheric variables such as mean sea level pressure. For each weather state we evaluate the joint distribution of daily precipitation amounts at n sites through the specification of n conditional distributions. The conditional distributions consist of regressions of transformed amounts at a given site on precipitation occurrence at neighboring sites within a set radius. Results for a network of 30 daily precipitation gages and historical atmospheric circulation data in southwestern Australia indicate that the extended NHMM accurately simulates the wet-day probabilities, survival curves for dry- and wet-spell lengths, daily precipitation amount distributions at each site, and intersite correlations for daily precipitation amounts over the 15 year period from 1978 to 1992.
Spatial downscaling of TRMM precipitation using vegetative response on the Iberian Peninsula
[J].
DOI:10.1016/j.rse.2008.10.004
URL
Precipitation data with accurate, high spatial resolution are crucial for improving our understanding of basin scale hydrology. We explore the relation between precipitation estimates derived from the Tropical Rainfall Monitoring Mission (TRMM) and the normalized difference vegetation index (NDVI) for different spatial scales on the Iberian Peninsula in southern Europe, using time series from 2001 to 2007. Analysis shows that NDVI is a good proxy for precipitation. On an annual basis an exponential function best describes the relation between NDVI and precipitation. The optimum relation between NDVI and precipitation is found at an approximate scale of 75 100 km. This is an intermediate scale and it is likely that at smaller scales NDVI is determined primarily by anthropogenic land use and at larger scales factors such as geology, soils, and temperature play an increasingly important role. The fact that both TRMM and NDVI are subject to bias due to orbital deviations, atmospheric conditions and imperfect retrieval algorithms could also influence the scale dependency. The derived relation between NDVI and precipitation is used to develop a new downscaling methodology that uses coarse scale TRMM precipitation estimates and fine scale NDVI patterns. The downscaled precipitation estimates are subsequently validated using an independent precipitation dataset. The downscaling procedure resulted in significant improvements in correlation, bias, and root mean square error for average annual precipitation over the whole period, for a dry year (2005), and a wet year (2003).
A statistical spatial downscaling algorithm of TRMM precipitation based on NDVI and DEM in the Qaidam Basin of China
[J].DOI:10.1016/j.rse.2011.06.009 URL [本文引用: 2]
On the use of NDVI for estimating rainfall fields in the Kalahari of Botswana
[J].
DOI:10.1006/jare.1996.0172
URL
Abstract This article presents the results of an experiment to estimate rainfall from the normalized difference vegetation index (NDVI). The study was carried out in the semi-arid region of south and southern Botswana, principally the Kalahari desert, where few rainfall-reporting stations exist. A statistical regression between NDVI and rainfall is developed for four areas with diverse soil conditions. These are used to estimate rainfall at an independent station or group of stations. The estimates reliably capture both the seasonal cycle and inter-annual variability. These regressions are used to produce a map of mean annual rainfall for the period 1982 to 1993, based on NDVI data, for the region 22 to 27 S and 20 to 26 E. The estimates are verified using all data available in the Meteorological Services' archive for these years.
NDVI-rainfall relationship in the Semliki watershed of the equatorial Nile
[J].
DOI:10.1016/j.pce.2009.06.004
URL
The use of remotely sensed data to describe, study, monitor and provide greater understanding on watershed’s landscape dynamics have proven to be useful worldwide, especially where timely and reliable ground information are neither available nor accessible like in most of the developing world. This paper, thus presents the first documented relationship between NDVI and rainfall in humid central Africa, and serves as a precursor in the understanding of the interaction between catchment characteristics and water resources of the Semliki region. This study investigates spatial and temporal relationship between NDVI and satellite-derived rainfall. Normalized Difference Vegetation Index (NDVI) time series derived from the NOAA–AVHRR (National Oceanic and Atmospheric Administration–Advanced Very High Resolution Radiometer) satellite data and FEWS satellite-derived rainfall are analyzed. The Semliki watershed (23,621 km 2) of the equatorial Nile basin is the study area. Monthly NDVI time series of 21 Semliki’s subcatchments (S3–S23) over 7 years (2001–2007) were processed and extracted with Windisp 5.1 from 10-day NDVI maximum value composite images. At the monthly time step, only 12 subcatchments had weak positive correlation (0.23–0.42) at 5% significance level and the rest were not significantly correlated. Incorporating a 1-month lag effect increased the correlation coefficients between the two variables (0.28–0.68) with 17 subcatchments being significantly correlated at the designated level. The topography within the catchment was found to play a defining role for NDVI values. S15, S16, S18 and S20, the subcatchments covering the Mount Ruwenzori characterized by elevations up to 4862 m above sea level, consistently recorded the lowest values of NDVI over time and no significant correlation could be established between rainfall and NDVI.
NDVI prediction over Mongolian grassland using GSMaP precipitation data and JRA-25/JCDAS temperature data
[J].DOI:10.1016/j.jaridenv.2008.12.007 URL [本文引用: 1]
The Tropical Rainfall Measuring Mission (TRMM) sensor package
[J].DOI:10.1175/1520-0426(1998)015<0809:TTRMMT>2.0.CO;2 URL [本文引用: 1]
The TRMM multisatellite precipitation analysis (TMPA):Quasi-global,multiyear,combined-sensor precipitation estimates at fine scales
[J].DOI:10.1175/JHM560.1 URL
基于TRMM数据的青藏高原降水的空间和季节分布特征
[J].<p>庞大的青藏高原不仅影响其周围的气候,也影响整个亚洲甚或全球的气候,而且本身还形成了独特的高原气候。但高原上气象观测站点极为稀少,降水资料奇缺,难以完整、深刻地认识高原降水的时空分布格局。选用热带降雨测量计划卫星(Tropical Rainfall Measuring Mission,TRMM)3B43 月尺度降水率数据,并根据114 个气象站点数据与TRMM数据的差额和克里格球形插值模型对原数据进行了修正,克服了原数据低值高估、高值低估的问题,并以此分析了青藏高原1998~2011 年的多年平均降水的空间格局与季节分布特征。研究结果证实了青藏高原降水的空间格局呈现自东南向西北递减、自南向北逐渐减少的基本分布规律,包括喜马拉雅山北坡雨影区、高原西北部“寒旱核心”的存在;还发现了一些新的规律,包括阿里喀喇昆仑山少雨区、高原腹地相对湿润区、横断山脉中心相对干旱区等。高原降水的季节分配不均匀,其中,西、北部春(3~5 月)、秋(9~11 月)和冬(12~2 月)的降水占全年降水比例均为20%~30%,夏季(6~8 月)降水稍多,比例为30%~40%;东南部降水主要集中在夏季,比例高达40%~60%,春、秋降水比例为20%~30%,冬季降水比例低于10%。</p>
TRMM-Data-Based spatial and seasonal patterns of precipitation in the Qinghai-Tibet Plateau
[J].
基于R语言的面向需水预测的随机森林方法
[J].
时间序列模型在降水量预测中的应用研究
[J].
Research on precipitation prediction based on time series model
[J].
Use of remotely sensed precipitation and leaf area index in a distributed hydrological model
[J].
DOI:10.1016/S0022-1694(02)00046-X
URL
[本文引用: 1]
Remotely sensed precipitation from METEOSAT data and leaf area index (LAI) from NOAA AVHRR data is used as input data to the distributed hydrological modelling of three subcatchments (82,000 km 2) in the Senegal River Basin. Further, root depths of annual vegetation are related to the temporal and spatial variation of LAI. The modelling results are compared with results based on conventional input of precipitation and vegetation characteristics. The introduction of remotely sensed LAI shows improvements in the simulated hydrographs, a marked change in the relative proportions of actual evapotranspiration comprising canopy evaporation, soil evaporation and transpiration, while no clear trend in the spatial pattern could be found. The remotely sensed precipitation resulted in similar model performances with respect to the simulated hydrographs as with the conventional raingauge input. A simple merging of the two inputs did not result in any improvement.
Relationship between satellite-derived land surface temperatures,arctic vegetation types,and NDVI
[J].DOI:10.1016/j.rse.2007.09.008 URL [本文引用: 1]
Remote sensing based estimation of evapotranspiration rates
[J].
DOI:10.1080/01431160310001647975
URL
[本文引用: 1]
A remote sensing based method is presented for calculating evapotranspiration rates (位E) using standard meteorological field data and radiometric surface temperature recorded for bare soil, maize and wheat canopies in Denmark. The estimation of 位E is achieved using three equations to solve three unknowns; the atmospheric resistance (rae), the surface resistance (rs) and the vapour pressure at the surface (es) where the latter is assessed using an empirical expression. The method is applicable, without modification, to dense vegetation and moist soil, but for a dry bare soil, where the effective source of water vapour is below the surface, the temperature of the evaporating front (Ts*) can not be represented by the measured surface temperature (Ts). In this case (Ts-Ts*) is assessed as a linear function of the difference between surface temperature and air temperature. The calculated 位E is comparable to latent heat fluxes recorded by the eddy covariance technique.
NDVI-rainfall relationship in the Semliki watershed of the equatorial Nile
[J].
DOI:10.1016/j.pce.2009.06.004
URL
[本文引用: 1]
The use of remotely sensed data to describe, study, monitor and provide greater understanding on watershed’s landscape dynamics have proven to be useful worldwide, especially where timely and reliable ground information are neither available nor accessible like in most of the developing world. This paper, thus presents the first documented relationship between NDVI and rainfall in humid central Africa, and serves as a precursor in the understanding of the interaction between catchment characteristics and water resources of the Semliki region. This study investigates spatial and temporal relationship between NDVI and satellite-derived rainfall. Normalized Difference Vegetation Index (NDVI) time series derived from the NOAA–AVHRR (National Oceanic and Atmospheric Administration–Advanced Very High Resolution Radiometer) satellite data and FEWS satellite-derived rainfall are analyzed. The Semliki watershed (23,621 km 2) of the equatorial Nile basin is the study area. Monthly NDVI time series of 21 Semliki’s subcatchments (S3–S23) over 7 years (2001–2007) were processed and extracted with Windisp 5.1 from 10-day NDVI maximum value composite images. At the monthly time step, only 12 subcatchments had weak positive correlation (0.23–0.42) at 5% significance level and the rest were not significantly correlated. Incorporating a 1-month lag effect increased the correlation coefficients between the two variables (0.28–0.68) with 17 subcatchments being significantly correlated at the designated level. The topography within the catchment was found to play a defining role for NDVI values. S15, S16, S18 and S20, the subcatchments covering the Mount Ruwenzori characterized by elevations up to 4862 m above sea level, consistently recorded the lowest values of NDVI over time and no significant correlation could be established between rainfall and NDVI.
青藏高原札达地区多年冻土遥感技术圈定方法与应用
[J].
Remote sensing technology delineation method and its application to permafrost of Zhada area in the Tibetan Plateau
[J].
