

0 引言
土地覆被是地球表层各种物质类型及其自然属性与特征的综合体,其空间分布反映了人类社会经济活动过程,地表的水热和物质平衡,生物地球化学循环和气候变化[1]。全球或区域尺度土地覆被信息已成为自然资源调查、环境监测、生物多样性保护、地理国情普查、气候变化及生态建模等领域的重要基础数据[2,3,4,5,6]。近10 a来,随着时间分辨率和空间分辨率的提高,遥感数据已经成为大尺度土地覆被制图的重要数据源。一些全球及区域尺度的土地覆被产品陆续出现[7,8,9,10],继2008年Landsat数据实现免费获取之后,全球各个国家及组织开始尝试研制30 m分辨率的全球尺度土地覆被遥感产品,并已取得了显著成果,例如Globeland30和FROM-GLC-agg的相继问世[11,12]。尽管每种土地覆被遥感产品在研制过程中,均进行了精度验证,但由于验证所采用的参考数据、验证方法各不相同,计算所获取的各种精度指标并不能直接进行比较,导致用户难以选择合理的数据作为气候、水文、生态等模型的输入信息,阻碍了上述数据在各个领域的协同使用。因此采用统一的参考数据对现有的土地覆被遥感产品进行全球或大区域尺度的精度验证,已成为该领域亟待解决的问题。
针对上述问题,本文以中国区域为研究范围,以现有的FROM-GLC-agg(简称FROM),MODIS COLLECTION5,GLOBCOVER和ESACCI 4种全球尺度土地覆被数据集为研究对象,采用GLC2000,GLCNMO,GLOBCOVER,The System for Terrestrial Ecosystem Parameterization(简称STEP)、The Visible Infrared Imaging Radiometer Suite(简称VIIRS)、GEOWIKI等土地覆被产品研发团队提供的参考数据,从面积一致性、类别混淆等传统手段在整体上对4种土地覆被数据集进行精度评价。本文的研究成果将揭示4种土地覆被遥感数据集在中国区域的类别精度及其空间分布特征,它既为研究区域从事生态环境建模、土地覆被变化、自然资源调查等领域的科学研究提供了数据选择的依据,也可为未来大尺度土地覆被遥感制图的重点研究方向提供参考。
1 数据源及其预处理
1.1 土地覆被遥感数据
表1列出了本文待验证土地覆被遥感产品的基本信息,其中FROM由清华大学研制,为30 m分辨率土地覆被遥感产品,该数据的时间基点为2010年,共采用8 903景Landsat TM/ETM+数据,其中约80%遥感影像的获取时间为2009—2011年间,该数据采用2级分类体系,其中一级分类包含10个类别,二级分类包含27个类别。为了保持和其他3种土地覆被遥感产品的空间分辨率一致,本文所采用的FROM并非原始的30 m分辨率产品,而是由俞乐等人采用比例聚类法变尺度转换后的250 m分辨率数据,该数据全球尺度的总体精度为69.5%[12]。GLOBCOVER 由欧洲空间局研制,时间基点为2009年,该产品以2009年1—12月MERIS 传感器的13个波段数据作为输入数据,采用 Plate-Carrée投影,其空间分辨率为 300 m,采用联合国联农组织的土地覆被分类系统(land cover classification system,LCCS),共包含22个类别,经研发团队验证该数据在全球尺度的总体精度为70.7%[13]; MODIS COLLECTION5(以下简称MODIS)由美国波士顿大学研制,时间基点为2010年,该产品采用2010年1月— 2010年 12 月的 TERRA/MODIS影像数据作为输入信息,空间分辨率为500 m,采用 IGBP 土地覆盖分类系统,包含17个类别,全球尺度该数据的总体精度为74.8%[8]; 欧洲航空航天局为了满足全球气候演化模型对于土地覆被信息的需求,以MERIS地表反射率合成数据、时间序列SPOT-VGT数据为输入信息,采用时空聚类及机器学习分类算法,分别研制了300 m分辨率的2000年,2005年和2010年3个时间基点的全球尺度土地覆被遥感产品(ESACCI),该产品采用LCCS分类体系,包含22个类别,本文所用数据的时间基点为2010年,全球尺度该数据的总体精度为74.4%[14]。
表1 多源土地覆被遥感产品信息表
Tab.1
| 土地覆被遥感产品 | FROM | ESACCI | MODIS | GLOBCOVER |
|---|---|---|---|---|
| 空间分辨率/m | 250 | 300 | 500 | 300 |
| 分类数据 | Landsat TM/ETM+ | MERIS地表放射率及 SPOT-VGI数据 | 每月的EVI,LST和1—7波段的8 d合成数据 | MERIS 10 d合成数据 |
| 时间基点 | 2010年 | 2010年 | 2010年 | 2009年 |
| 分类方法 | 支持向量机和图像分割技术 | 时空聚类和机器学习分类 | 监督决策树分类 | 时空聚类及专家判读 |
1.2 参考数据
本文共涉及6种全球尺度土地覆被遥感产品验证数据集,这些数据集均可从互联网免费下载(下载网址为http: //www.gofcgold.wur.nl/sites/gofcgold_refdataportal-glc2k.php; http: //geo-wiki.org/),供各国研究者在验证时参考使用。GLC2000参考数据是在原始GLC2000参考数据基础上,再次通过野外实地调查、Google Earth影像对比等手段获取的改进版本,删除了原始数据中存在类别错分的样本,该数据采用分层采样策略,全球共有1 253个样本,共分为11种土地覆被类别,经验证其类别精度为95%以上[10]。GLOBCOVER产品的参考数据由经全球分层随机采样的4 258个样本构成,每个样本在解译过程中除了参考对应时期的Google Earth影像外,产品研发方还提供了2000—2007年的NDVI数据,以便从物候特征角度提高样本的解译精度,解译过程由全球范围内土地覆被制图领域相关专家完成,这些专家均具备扎实的理论基础和丰富的遥感图像处理经验。为了降低尺度效应对于土地覆被遥感产品的验证精度的影响,GLOBCOVER参考数据要求每个样本的覆盖范围为1 500 m×1 500 m。本文所用参考数据是在原始数据基础上,经过地表土地覆被类别均质性筛选的500个样方,且每个样方均进行了野外实地验证,其精度达100%[15]。The System for Terrestrial Ecosystem Parameterization (STEP)参考数据最初是为了验证全球陆表生态模型所需的土地覆被信息精度,该参考数据以GIS软件中通用的多边形格式存储,为了保证参考数据的实时性,研发团队定期对其进行更新,该数据采用IGBP分类体系[16]。VIIRS参考数据以全球气候分区为依据,采用随机分层抽样方式在全球布设500个样本点,每个样本覆盖范围为5 km×5 km,样本多选择在大尺度土地覆被制图过程中景观异质性较强及类别组成较为复杂区域,为了保持与当前土地覆被遥感产品空间分辨率的一致性,在每个样本覆盖范围内二次划分为25个1 km×1 km的空间格网,每个格网内的土地覆被类别及组成均由遥感专家在植物生长季内空间分辨率不低于2 m的高分遥感数据上完成[17]。GEO_WIKI是以Google Earth为平台开发的一个免费的全球尺度土地覆被验证数据库,其数据由世界各国土地覆被遥感制图领域专业人员提供,数据库中的每条记录描述了陆表特定经纬度交叉点的土地覆被类别组成,在向数据库提交记录时需提供该验证站点的信任度级别(包括绝对确认、非常确认、确认和不确认4个等级)。本文所用的GEO_WIKI验证数据库在中国区域验证站点数目为3 406个。为了保证验证数据的可靠性,根据数据库提供的关于GEO_WIKI验证数据的类别准确度级别,选择验证点准确度级别为0(绝对准确)和1(非常准确)的验证点作为验证数据。经此条件过滤,中国区域共有2 187条可供使用的数据[18]。GLCNMO参考数据是由全球制图国际委员会为评价全球尺度GLCNMO产品的精度而采用的验证数据,该数据采用IGBP分类体系,但并不包含建设用地、冰雪等类别[19]。6种参考数据在中国区域的空间分布如图1所示。
图1
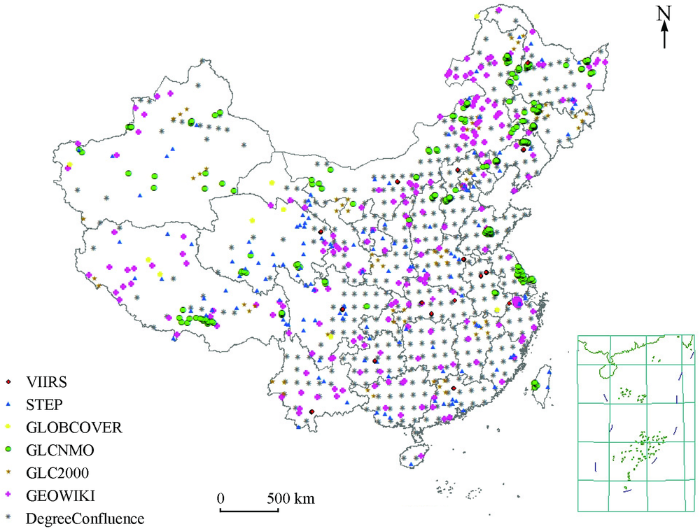
图1
中国区域参考数据空间分布图(审图号: GS(2016)2885号)
Fig.1
The spatial distribution of referenced data in China
本文所采用的参考数据集均为以ArcGIS SHP格式存储的点类型,每个点所代表的土地覆被类别为对应参考样方中心点处土地覆被信息。在精度评价过程中,通过ArcGIS软件中的点属性提取功能,获取待验证土地覆被数据集对应位置的土地覆被类别,并将类别假设为该点所在像元的土地覆被类别,通过逐点之间的一一比较,构建土地覆被类别误差矩阵。
1.3 数据预处理
为了完成研究区域异源土地覆被遥感产品的精度评价,首先将各种待评价土地覆被遥感产品及参考数据统一到相同的空间参考框架下,鉴于本文重点研究各种产品土地覆被类别的面积精度,因此选择阿尔伯斯等积投影作为空间参考基准,将所有的待验证数据及参考数据在ArcGIS软件中完成空间参考转换。由于GLOBCOVER和ESACCI的空间分辨率为300 m,而FROM和MODIS数据的空间分辨率则分别为250 m和500 m,为了实现空间分辨率的统一,参考已有研究[20],采用最邻近像元插值法将FROM和MODIS这2种数据集的的空间分辨率重采样为300 m。
如1.1所述,FROM,MODIS,ESACCI和GLOBCOVER 4种土地覆被遥感产品及参考数据所采用的分类体系在描述陆表覆被信息的详细程度上有所差异。例如,FROM数据并没有对林地的物候作出细分; GLOBCOVER和ESACCI定义了较多的混合类别; GEOWIKI仅将参考样本划分为林地、草地、灌木、耕地等9个一级类别,没有考虑木本及草本类别的物候及郁闭度。为了验证的可行性,需要将所有的待验证数据及参考数据统一到同一分类体系,在已有研究基础上[16,17,18,19],将待验证数据及参考数据的土地覆被类别聚合为林地、灌木、草地、耕地、水域/湿地、建设用地、永久性冰雪及裸地 8个类别,表2中详细列举了每种聚合后类别所对应的不同土地覆被遥感数据的原有类别编码,例如,林地在FROM数据中的类别编码为20,而在GLOBCOVER数据中的类别编码为40,50,60,70,80,90,100,110,160和170,而在MODIS数据中对应的编码为1,2,3,4,5,其他类别以此类推。由于STEP和VIIRS数据采用和MODIS完全相同的分类体系及类别聚合方法,因此在表2中并未列出。
表2 聚合土地覆被类别与原始土地覆被数据类别对应表
Tab.2
| 土地覆被类别 | FROM | GLOBCOVER | MODIS | ESACCI | GEOWIKI | GLCNMO | GLC2000 |
|---|---|---|---|---|---|---|---|
| 林地 | 20 | 40—110,160,170 | 1—5 | 50-100,160,170 | 1 | 1—5 | 1—10 |
| 灌木 | 40,71 | 130 | 6—9 | 120 | 2 | 7 | 11,12 |
| 草地 | 30,72 | 120,140 | 10 | 110,130,140 | 3 | 8,9 | 13 |
| 耕地 | 10 | 11—30 | 12,14 | 10—40 | 4 | 11,12,13 | 16—18 |
| 湿地水域 | 50,60 | 180,210 | 11,17 | 180,210 | 6,8 | 15 | 15,20 |
| 建设用地 | 80 | 190 | 13 | 190 | 7 | - | 22 |
| 冰雪 | 100 | 220 | 15 | 220 | 10 | - | 21 |
| 裸地 | 90 | 150,200 | 16 | 150,200 | 9 | 10,16,17 | 14,19 |
表3揭示了聚合后的中国区域参考数据类别结构。从表中可以看出,参考数据中各种类别的比例并不均衡,存在较大的数量差异。其中耕地、建设用地、林地、草地4种类别的数量较大,其总和约占参考数据总量的83%; 而水域、灌木、裸地及冰雪的参考数据则较少,尤其是水域和裸地,仅占参考数据总量的0.98%和1.75%。
表3 中国区域参考数据土地覆被类别及组成
Tab.3
| 类别代码 | 类别名称 | 验证点数目 | 所占比例/% |
|---|---|---|---|
| 1 | 林地 | 537 | 18.12 |
| 2 | 灌木 | 171 | 5.77 |
| 3 | 草地 | 381 | 12.85 |
| 4 | 耕地 | 845 | 28.51 |
| 5 | 水域/湿地 | 29 | 0.98 |
| 6 | 城市及建设用地 | 692 | 23.35 |
| 7 | 永久性冰雪 | 257 | 8.67 |
| 8 | 裸地 | 52 | 1.75 |
2 研究方法
误差矩阵是土地覆被遥感产品精度评价最常见的方法之一。该方法主要通过比较参考数据和待验证数据在特定位置处的类别一致性,进而建立二者之间的交叉二维表格(即类别误差矩阵),并以此为基础,计算出能够表达待验证产品精度的生产者精度、用户精度、总体精度等一系列指标。各指标计算公式[20]为:
式中: xii为i类土地覆被类别正确分类的像元数(本文中i的取值为1,2,3,4,5,6,7,8); n为研究区域总的像元数; xi+为待验证土地覆被产品中i类别的像元总数; x+i为参考数据中i类别的像元总数。
误差矩阵尽管可以从宏观上揭示不同土地覆被数据的类别精度,但无法从空间上展示数据间类别的一致性。为此,笔者在GIS软件中将4种土地覆被数据在空间上进行叠加,从像元尺度揭示4种数据类别的一致性分布特征。计算的结果将归纳4个类别,分别为: ①完全一致,4种数据在对应像元表现出完全相同的土地覆被类别; ②基本一致,4种数据在对应像元表现出仅有2种土地覆被类别; ③不一致,4种数据在对应像元呈现出3种不同的土地覆被类别; ④完全不一致,4种数据在对应像元呈现出4种完全不同的土地覆被类别。
3 结果与分析
3.1 土地覆被类别面积一致性比较
图2揭示了FROM,MODIS,GLOBCOVER和ESACCI 4种土地覆被遥感产品不同类别的面积一致性。从图2中可以看出,林地、草地、耕地和裸地是研究区域的主要土地覆被类别,而灌木、水域/湿地、建设用地及永久性冰雪则相对较少。4种产品的林地面积相对较为接近,分别占研究区域总面积的22.9%,18.5%,17.7%和21.3%,其最大面积差为研究区总面积的5.2%; 对于草地而言,FROM,MODIS和ESACCI 3种产品的草地面积均明显高于GLOBCOVER,其中FROM,MODIS和ESACCI的草地面积比例分别为26.2%,30.1%和24.7%,而GLOBCOVER则仅为11.4%; 与草地面积比例相反,GLOBCOVER的耕地面积比例最高,为34.2%,高于FROM的13.6%,MODIS的20.0%和ESACCI的28.6%; 对于裸地,FROM和GLOBCOVER这2种产品面积百分比几乎相同,分别占研究区总面积的29.9%和30.0%,高于MODIS的22.13%和ESACCI的20.45%。由于灌木、水域/湿地、建设用地和永久性冰雪4种类别面积较少,4种产品的类别面积一致性较高,差异较小。
图2
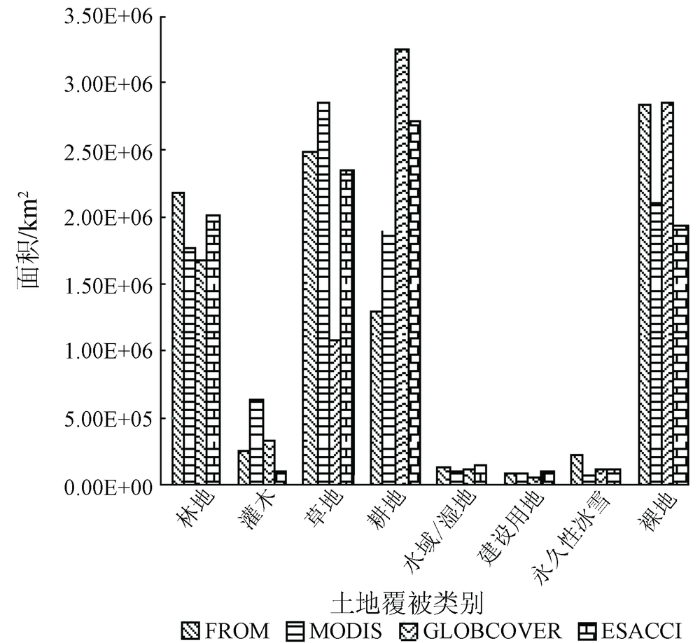
图2
4种土地覆被遥感产品类别面积一致性比较
Fig.2
Area consistent analysis of 4 land cover products
3.2 基于误差矩阵的类别精度分析
根据式(1)—(3),计算参考数据与待评价4种土地覆被遥感产品在研究区域的误差矩阵,获取不同土地覆被类别的总体精度、用户精度和生产者精度。结果表明: FROM产品和参考数据具有最高的总体一致性,其总体精度为0.69,MODIS和ESACCI次之,其总体精度分别为0.67和0.65,GLOBCOVER的总体精度最低,为0.55。尽管总体精度可以从宏观上表达每种土地覆被遥感产品的可靠性,但对于特定的科学应用领域,具体的类别精度显得更为重要。
图3
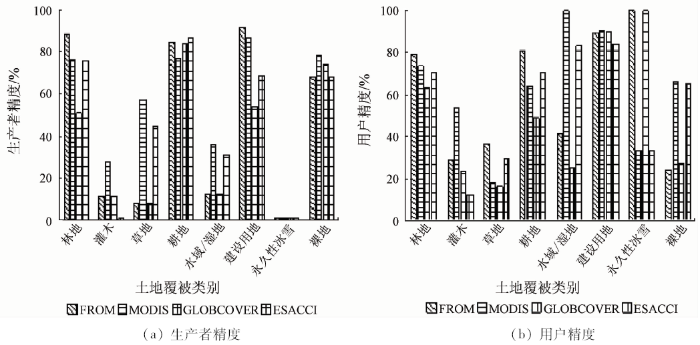
图3
不同土地覆被类别的生产者精度和用户精度比较
Fig.3
Comparison between different land cover products about producer accuracy and user accuracy
图3(b)显示,所有土地覆被类别中,林地、耕地和建设用地的用户精度较高,且相互差异较小,灌木、水域和裸地的用户精度存在较大差异,如FROM产品灌木的用户精度为55.56%,而ESACCI产品灌木的用户精度仅为10.25%,两者相差45.31%,FORM产品水域/湿地的用户精度达100%,说明该产品该类别具有非常高的类别质量,而GLOBCOVER产品的水域/湿地的用户精度仅为22.23%,两者相差77.77%。
图3表明4种土地覆被遥感产品灌木类别的生产者精度和用户精度均较低,除MODIS产品该类别的用户精度高于50%外,其余均低于30%,这说明,对于大尺度土地覆被制图而言,现有的分类算法难以精准获取陆表灌木类别的分布信息,因此如何提高灌木类别精度,降低其与林地、草地、耕地的混淆是未来土地覆被制图领域亟需解决的重要问题。
3.3 多源数据类别空间一致性分析
图4从空间角度阐明了FROM,MODIS,GLOB- COVER和ESACCI4种数据在中国区域的类别一致性特征。结果表明,完全空间一致性区域约占研究区总面积的39.03%,主要分布于我国东北的林业、农业区,西北的裸地荒漠区和华北的耕地区,这些地区陆表土地利用类型较为简单,地物光谱特征比较容易识别且呈现出一定的物候规律特征; 基本一致区域的分布符合土地覆被类别的区域变量特点,其主要位于完全一致区域的周边,其面积约占研究区总面积的40.67%,具体分布在青海省与西藏自治区交接处、四川省中部和内蒙古自治区东北部,这些地区陆表的土地利用类型主要表现为裸地、草地及二者的混合类别; 不一致区域的面积约占研究区总面积的18.56%,主要分布于青藏高寒区中部、辽宁省南部、黑龙江、吉林、辽宁三省与内蒙古自治区交界的条带区域,相对于上述2个分区,这些地区土地覆被类别较为复杂,陆表土地类别呈现明显的异质性特征,耕地、林地、灌木和草地交错分布; 完全不一致区域约占研究区总面积的1.74%,主要分布于甘肃省中部。
图4
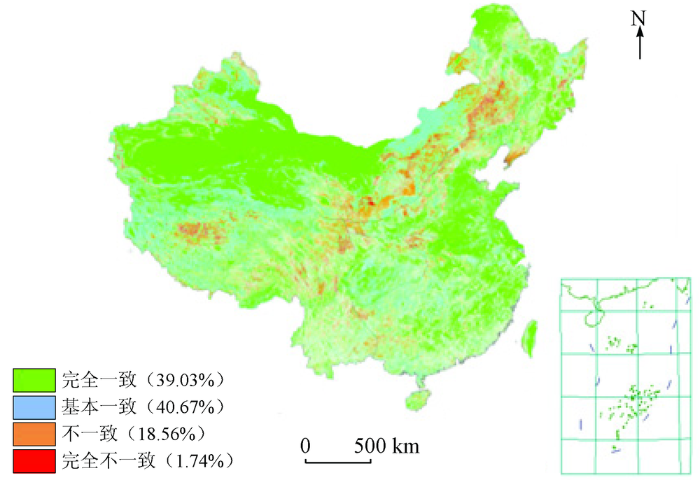
图4
中国区域多源数据类别一致性空间特征(审图号: GS(2016)2885号)
Fig.4
The spatial map of different land cover category consistencyin China
4 结论与讨论
1)4种大尺度土地覆被遥感产品的林地、耕地、建设用地和裸地等类别均具有较高的生产者精度和用户精度。因此,对于全球或国家尺度森林面积调查、粮食产量预测、城市用地扩张等研究领域,4种数据均可提供较为精准的基础数据; 相对于上述类别,4种产品灌木类别的生产者精度和用户精度均较低,其类别混淆主要发生于林地、草地和耕地之间,因此未来如何提高大尺度低分辨率遥感数据灌木类别的识别精度,有效降低该类别与耕地、林地和草地间的错分是当前亟待解决的问题.
2)研究表明FROM产品和MODIS产品在总体上表现出较高的类别精度,优于GLOBCOVER和ESACCI两种产品。GLOBCOVER尽管采用的基础数据为300 m分辨率地表反射率信息,但其总体精度则低于500 m分辨率的MODIS数据。这说明对于土地覆被遥感制图而言,除了需关注原始数据的空间分辨率外,采用适合的影像分类算法同样可以提高土地覆被信息的提取出精度。
3)多源数据类别一致性图谱表明,4种数据土地覆被类别结构单一区域具有较好的类别一致性,可以准确识别林地、耕地、裸地等均质性较强的土地覆被类别。但对于青藏高寒区、中国西南区域等景观异质性区域,则表现出较差的类别一致性。
4)本文以国际组织发布的权威数据为参考,从国家尺度验证了当前的4种土地覆被遥感产品的类别精度。但已有研究表明,土地覆被类别精度具有空间分异特征,国家尺度的精度特征并不能代表全球或区域尺度,因此从全球及区域尺度对4种产品分别进行精度评价是今后要开展的必要工作。尽管国际组织发布的验证数据的精度较高,但其数量相对较少,且各种类别所占的数量比例不均衡,无法满足地理分层抽样理论对于与土地覆被遥感产品精度验证的要求。自从2007年公众自发地理信息(volunteered geographic information,VGI)的概念出现以来,这类数据日益增多,已被广泛应用于生态评价、冰川调查、植被分类等众多研究领域。因此如何利用自发地理信息来补充现有验证数据在数量上的不足,进而实现土地覆被遥感产品地理分层抽样验证也是未来需要开展的工作。
参考文献
全球陆表水体高分辨率遥感制图
[J].
High-resolution remote sensing mapping of global land water
[J].
全球地表覆盖高分辨率遥感制图
[J].
DOI:10.3969/j.issn.1672-1586.2011.02.002
URL
[本文引用: 1]

全球地表覆盖分布及变化是气候变化研究、生态环境评估、地理国情监测、宏观调控分析等不可或缺的重要基础信息。国际上现有全球五套地表覆盖数据产品的空间分辨率为1km或300m,数据精度、分类体系、时空分辨率等均存在不足。为了满足全球变化研究与地球模式模拟的需求,应该研制具有较高时空分辨率、更符合全球变化需要、精度较好的全球地表覆盖数据产品。本文简要介绍了全球地表覆盖遥感制图的情况和数据产品的不足,讨论了对新一代地表覆盖数据产品的需求,介绍了我国研制全球30m地表覆盖数据产品的863重点项目。
Higher resolution global land cover mapping
[J].
Effects of climate and land cover on hydrology in the southeastern U.S.:Potential impacts on watershed planning
[J].DOI:10.1111/1752-1688.12304 URL [本文引用: 1]
A simple landscape design framework for biodiversity conservation
[J].
DOI:10.1016/j.landurbplan.2014.11.006
URL
[本文引用: 1]
Local government planning agencies play an important role in conserving biodiversity in human-altered landscapes. Such agencies frequently have a limited knowledge of wildlife biology and few resources to carry out research, and therefore require simple, practical guidelines for biodiversity conservation. We propose a landscape design framework for biodiversity conservation that is sequential, prescriptive, and supported by current landscape ecological science. Unlike existing guidelines, our framework can be implemented in any given landscape using only land cover data and it explicitly considers constraints on land use planning. The steps of our framework, in the order in which they should be implemented are: (1) select land cover data and decide which land cover classes constitute unaltered or altered land covers; (2) list the constraints on land use planning (e.g., economic, social) that exist for the landscape; (3) maximize the total amount and diversity of unaltered land cover, especially near water; (4) minimize human disturbance within altered land cover, especially near water; and (5) aggregate altered land covers associated with high-intensity land uses, especially away from water. We illustrate the utility of our approach by applying it to a hypothetical landscape and comparing the outcome to those from the application of traditional ecological guidelines to inform land use planning.
Climate change modifies risk of global biodiversity loss due to land-cover change
[J].
DOI:10.1016/j.biocon.2015.04.016
URL
[本文引用: 1]
Climate change and land-cover change will have major impacts on biodiversity persistence worldwide. These two stressors are likely to interact, but how climate change will mediate the effects of land-cover change remains poorly understood. Here we use an empirically-derived model of the interaction between habitat loss and climate to predict the implications of this for biodiversity loss and conservation priorities at a global scale. Risk analysis was used to estimate the risk of biodiversity loss due to alternative future land-cover change scenarios and to quantify how climate change mediates this risk. We demonstrate that the interaction of climate change with land-cover change could increase the impact of land-cover change on birds and mammals by up to 43% and 24% respectively and alter the spatial distribution of threats. Additionally, we show that the ranking of global biodiversity hotspots by threat depends critically on the interaction between climate change and habitat loss. Our study suggests that the investment of conservation resources will likely change once the interaction between climate change and land-cover change is taken into account. We argue that global conservation efforts must take this into account if we are to develop cost-effective conservation policies and strategies under global change.
Model‐based characterization and monitoring of runoff and soil erosion in response to land use/land cover changes in the Modjo watershed,Ethiopia
[J].
Development of a global land cover characteristics database and IGBP DISCover from 1 km AVHRR data
[J].DOI:10.1080/014311600210191 URL [本文引用: 1]
McIver D K,Hodges J C F,et al.Global land cover mapping from MODIS:Algorithms and early results
[J].
DOI:10.1016/S0034-4257(02)00078-0
URL
[本文引用: 2]
Until recently, advanced very high-resolution radiometer (AVHRR) observations were the only viable source of data for global land cover mapping. While many useful insights have been gained from analyses based on AVHRR data, the availability of moderate resolution imaging spectroradiometer (MODIS) data with greatly improved spectral, spatial, geometric, and radiometric attributes provides significant new opportunities and challenges for remote sensing-based land cover mapping research. In this paper, we describe the algorithms and databases being used to produce the MODIS global land cover product. This product provides maps of global land cover at 1-km spatial resolution using several classification systems, principally that of the IGBP. To generate these maps, a supervised classification methodology is used that exploits a global database of training sites interpreted from high-resolution imagery in association with ancillary data. In addition to the IGBP class at each pixel, the MODIS land cover product provides several other parameters including estimates for the classification confidence associated with the IGBP label, a prediction for the most likely alternative class, and class labels for several other classification schemes that are used by the global modeling community. Initial results based on 5 months of MODIS data are encouraging. At global scales, the distribution of vegetation and land cover types is qualitatively realistic. At regional scales, comparisons among heritage AVHRR products, Landsat TM data, and results from MODIS show that the algorithm is performing well. As a longer time series of data is added to the processing stream and the representation of global land cover in the site database is refined, the quality of the MODIS land cover product will improve accordingly.
Townshend J R G,et al.Global land cover classification at 1 km spatial resolution using a classification tree approach
[J].DOI:10.1080/014311600210209 URL [本文引用: 1]
GLC2000:A new approach to global land cover mapping from Earth observation data
[J].
DOI:10.1080/01431160412331291297
URL
[本文引用: 2]
A new global land cover database for the year 2000 (GLC2000) has been produced by an international partnership of 30 research groups coordinated by the European Commission's Joint Research Centre. The database contains two levels of land cover information—detailed, regionally optimized land cover legends for each continent and a less thematically detailed global legend that harmonizes regional legends into one consistent product. The land cover maps are all based on daily data from the VEGETATION sensor on‐board SPOT 4, though mapping of some regions involved use of data from other Earth observing sensors to resolve specific issues. Detailed legend definition, image classification and map quality assurance were carried out region by region. The global product was made through aggregation of these. The database is designed to serve users from science programmes, policy makers, environmental convention secretariats, non‐governmental organizations and development‐aid projects. The regional and global data are available free of charge for all non‐commercial applications from http://www.gvm.jrc.it/glc2000.
Global land cover mapping at 30 m resolution:A POK-based operational approach
[J].
DOI:10.1016/j.isprsjprs.2014.09.002
URL
[本文引用: 1]
Global Land Cover (GLC) information is fundamental for environmental change studies, land resource management, sustainable development, and many other societal benefits. Although GLC data exists at spatial resolutions of 300m and 1000m, a 30m resolution mapping approach is now a feasible option for the next generation of GLC products. Since most significant human impacts on the land system can be captured at this scale, a number of researchers are focusing on such products. This paper reports the operational approach used in such a project, which aims to deliver reliable data products. Over 10,000 Landsat-like satellite images are required to cover the entire Earth at 30m resolution. To derive a GLC map from such a large volume of data necessitates the development of effective, efficient, economic and operational approaches. Automated approaches usually provide higher efficiency and thus more economic solutions, yet existing automated classification has been deemed ineffective because of the low classification accuracy achievable (typically below 65%) at global scale at 30m resolution. As a result, an approach based on the integration of pixel- and object-based methods with knowledge (POK-based) has been developed. To handle the classification process of 10 land cover types, a split-and-merge strategy was employed, i.e. firstly each class identified in a prioritized sequence and then results are merged together. For the identification of each class, a robust integration of pixel-and object-based classification was developed. To improve the quality of the classification results, a knowledge-based interactive verification procedure was developed with the support of web service technology. The performance of the POK-based approach was tested using eight selected areas with differing landscapes from five different continents. An overall classification accuracy of over 80% was achieved. This indicates that the developed POK-based approach is effective and feasible for operational GLC mapping at 30m resolution.
Improving 30 m global land-cover map FROM-GLC with time series MODIS and auxiliary data sets:A segmentation-based approach
[J].DOI:10.1080/01431161.2013.798055 URL [本文引用: 2]
GlobCover:The most detailed portrait of Earth
[J].ABSTRACT The Medium Resolution Imaging Spectrometer (MERIS) of Envisat environmental satellite produced a new map of Earth's surface. ESA is responsible for the production of the MERIS 300 m Full Resolution Full Swath (FRS) products. The map data can be used to study the land-cover trends, ecosystem, and climate change. The online information about the map can be found on the map server tool on ESA's GlobCover web site. The GlobCover products provide the detailed information of land cover and land surface. These information are useful for studying sustainable management of natural resources, environmental protection, food security, climate change, and humanitarian programs. The GlobCover is able to provide maps of croplands, wetlands, forest, artificial surfaces, water bodies, snow, and ices. The GlobCover has a GlobCover software, the execution environment, and the associated hardware.
Spatial accuracy assessment and integration of global land cover datasets
[J].
DOI:10.3390/rs71215804
URL
[本文引用: 1]
Along with the creation of new maps, current efforts for improving global land cover (GLC) maps focus on integrating maps by accounting for their relative merits, e.g., agreement amongst maps or map accuracy. Such integration efforts may benefit from the use of multiple GLC reference datasets. Using available reference datasets, this study assesses spatial accuracy of recent GLC maps and compares methods for creating an improved land cover (LC) map. Spatial correspondence with reference dataset was modeled for Globcover-2009, Land Cover-CCI-2010, MODIS-2010 and Globeland30 maps for Africa. Using different scenarios concerning the used input data, five integration methods for an improved LC map were tested and cross-validated. Comparison of the spatial correspondences showed that the preferences for GLC maps varied spatially. Integration methods using both the GLC maps and reference data at their locations resulted in 4.5%鈥13% higher correspondence with the reference LC than any of the input GLC maps. An integrated LC map and LC class probability maps were computed using regression kriging, which produced the highest correspondence (76%). Our results demonstrate the added value of using reference datasets and geostatistics for improving GLC maps. This approach is useful as more GLC reference datasets are becoming publicly available and their reuse is being encouraged.
Global land-cover map validation experiences:Toward the characterization of quantitative uncertainty
[M] //
MODIS Collection 5 global land cover:Algorithm refinements and characterization of new datasets
[J].
DOI:10.1016/j.rse.2009.08.016
URL
[本文引用: 2]
Information related to land cover is immensely important to global change science. In the past decade, data sources and methodologies for creating global land cover maps from remote sensing have evolved rapidly. Here we describe the datasets and algorithms used to create the Collection 5 MODIS Global Land Cover Type product, which is substantially changed relative to Collection 4. In addition to using updated input data, the algorithm and ancillary datasets used to produce the product have been refined. Most importantly, the Collection 5 product is generated at 500-m spatial resolution, providing a four-fold increase in spatial resolution relative to the previous version. In addition, many components of the classification algorithm have been changed. The training site database has been revised, land surface temperature is now included as an input feature, and ancillary datasets used in post-processing of ensemble decision tree results have been updated. Further, methods used to correct classifier results for bias imposed by training data properties have been refined, techniques used to fuse ancillary data based on spatially varying prior probabilities have been revised, and a variety of methods have been developed to address limitations of the algorithm for the urban, wetland, and deciduous needleleaf classes. Finally, techniques used to stabilize classification results across years have been developed and implemented to reduce year-to-year variation in land cover labels not associated with land cover change. Results from a cross-validation analysis indicate that the overall accuracy of the product is about 75% correctly classified, but that the range in class-specific accuracies is large. Comparison of Collection 5 maps with Collection 4 results show substantial differences arising from increased spatial resolution and changes in the input data and classification algorithm.
A global land-cover validation data set,part I:Fundamental design principles
[J].
DOI:10.1080/01431161.2012.674230
URL
[本文引用: 2]
A number of land-cover products, both global and regional, have been produced and more are forthcoming. Assessing their accuracy would be greatly facilitated by a global validation database of reference sites that allows for comparative assessments of uncertainty for multiple land-cover data sets. We propose a stratified random sampling design for collecting reference data. Because the global validation database is intended to be applicable to a variety of land-cover products, the stratification should be implemented independently of any specific map to facilitate general utility of the data. The stratification implemented is based on the K02ppen climate/vegetation classification and population density. A map of the K02ppen classification was manually edited and intersected by two layers of population density and a land water mask. A total of 21 strata were defined and an initial global sample of 500 reference sites was selected, with each site being a 565×655 km block. The decision of how to allocate the sample size to strata was informed by examining the distribution of the sample area of land cover for two global products resulting from different sample size allocations to the 21 strata. The initial global sample of 500 sites selected from the K02ppen-based stratification indicates that these strata can be used effectively to distribute sample sites among rarer land-cover classes of the two global maps examined, although the strata were not constructed using these maps. This is the first article of two, with the second paper presenting details of how the sampling design can be readily augmented to increase the sample size in targeted strata for the purpose of increasing the sample sizes for rare classes of a particular map being evaluated.
Geo-Wiki.Org:The use of crowdsourcing to improve global land cover
[J].
DOI:10.3390/rs1030345
URL
[本文引用: 2]
Global land cover is one of the essential terrestrial baseline datasets available for ecosystem modeling, however uncertainty remains an issue. Tools such as Google Earth offer enormous potential for land cover validation. With an ever increasing amount of very fine spatial resolution images (up to 50 cm 50 cm) available on Google Earth, it is becoming possible for every Internet user (including non remote sensing experts) to distinguish land cover features with a high degree of reliability. Such an approach is inexpensive and allows Internet users from any region of the world to get involved in this global validation exercise. The Geo-Wiki Project is a global network of volunteers who wish to help improve the quality of global land cover maps. Since large differences occur between existing global land cover maps, current ecosystem and land-use science lacks crucial accurate data (e.g., to determine the potential of additional agricultural land available to grow crops in Africa), volunteers are asked to review hotspot maps of global land cover disagreement and determine, based on what they actually see in Google Earth and their local knowledge, if the land cover maps are correct or incorrect. Their input is recorded in a database, along with uploaded photos, to be used in the future for the creation of a new and improved hybrid global land cover map.
Production of global land cover data-GLCNMO
[J].
DOI:10.1080/17538941003777521
URL
[本文引用: 2]
Global land cover is one of the fundamental contents of Digital Earth. The Global Mapping project coordinated by the International Steering Committee for Global Mapping has produced a 1-km global land cover dataset Global Land Cover by National Mapping Organizations. It has 20 land cover classes defined using the Land Cover Classification System. Of them, 14 classes were derived using supervised classification. The remaining six were classified independently: urban, tree open, mangrove, wetland, snow/ice, and water. Primary source data of this land cover mapping were eight periods of 16-day composite 7-band 1-km MODIS data of 2003. Training data for supervised classification were collected using Landsat images, MODIS NDVI seasonal change patterns, Google Earth, Virtual Earth, existing regional maps, and expert's comments. The overall accuracy is 76.5% and the overall accuracy with the weight of the mapped area coverage is 81.2%. The data are available from the Global Mapping project website (http://www.iscgm.org/). The MODIS data used, land cover training data, and a list of existing regional maps are also available from the CEReS website. This mapping attempt demonstrates that training/validation data accumulation from different mapping projects must be promoted to support future global land cover mapping.
不同耕地数据集在中国区域的对比研究
[J].
A comparative analysis of five global cropland datasets in China
[J].
G.A review of assessing the accuracy of classifications of remotely sensed data
[J].
DOI:10.1046/j.1365-2249.2000.01137.x
URL
This paper reviews the necessary considerations and available techniques for assessing the accuracy of remotely sensed data. Included in this review are the classification system, the sampling scheme, the sample size, spatial autocorrelation, and the assessment techniques. All analysis is based on the use of an error matrix or contingency table. Example matrices and results of the analysis are presented. Future trends including the need for assessment of other spatial data are also...
