

0 引言
悬浮物浓度遥感反演算法主要分为经验算法和半分析算法2类。经验算法利用遥感数据与实时或准实时的地面观测悬浮物浓度数据,建立其间的统计回归模型[4]。该算法具有简单易用,估算精度较高的优点,但2类水体的光学特性复杂多变,具有很强的季节性和区域性特点。半分析算法基于光在水下的辐射传输理论,通过光谱反射率推算水体组分的吸收系数和散射系数,构建悬浮物含量和水体固有光学参数的关系,以估算水体悬浮物浓度,该算法具有较好的物理解释和适用性。但是,受到各种观测仪器的限制,该算法中很多参数以现有的设备无法获取,因此很难广泛应用[5]。此外,模型中某些参数常通过经验或半经验的方法计算,从而影响模型的精度[6]。由于近岸水体光学性质复杂及悬浮物组分多变,应用半分析算法反演水体悬浮物浓度仍然存在难度,目前仍以经验算法为主[7],常用算法有单波段算法、波段比值算法、多波段算法与光谱微分法。Ahn等[8]利用625 nm波段成功地估算了我国黄海外海的悬浮物浓度; 宋庆君等[9]对比研究了悬浮物浓度与实测遥感反射波谱数据之间的相关性大小,发现750 nm处的反射率值与其相关性最高,据此构建了适用于秋季太湖的单波段反演算法,取得了较好的效果; Ma等[10]通过对珠江口水体悬浮物浓度与实测高光谱反射率的关系研究发现,利用810 nm波段处的反射峰及其邻近的吸收谷所围成的面积反演水体悬浮物浓度具有较高的反演精度。
1 数据与方法
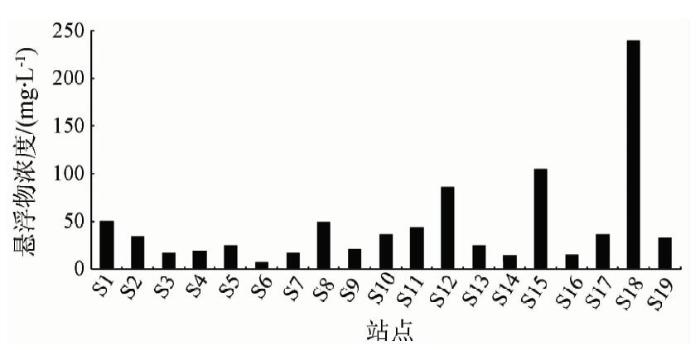
1.1 数据获取
图1
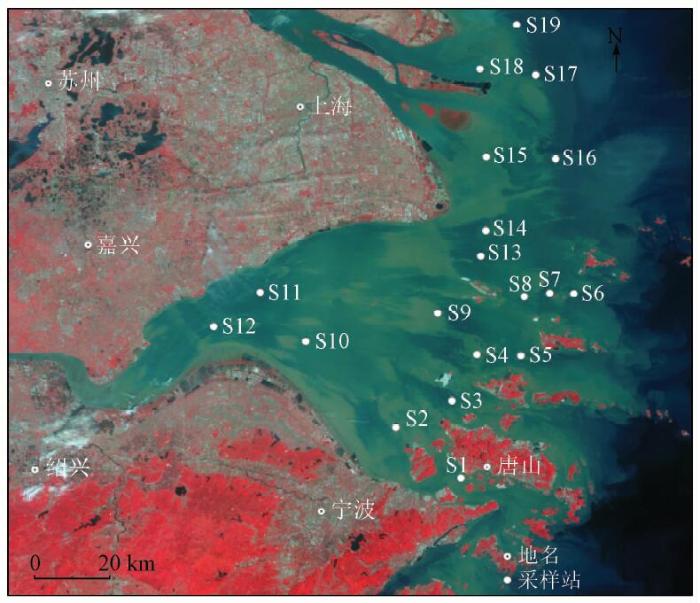
图2
1.2 数据处理
由于350~1 000 nm以外的波段易受仪器本身的影响,可能含有噪声,故选用400~900 nm波段光谱进行研究。采用累加平均方法将仪器所测的原始光谱模拟计算出HICO数据的光谱,计算公式为
式中:
表1 HICO主要参数
Tab.1
| 参数 | 性能 |
|---|---|
| 轨道 | 近圆形轨道 |
| 倾角/(°) | 51.6 |
| 轨道高度/km | 343 |
| 重返周期/d | 3 |
| 视场角/(°) | 6.92 |
| 幅宽/km | 42 |
| 波谱范围/nm | 360~1 080 |
| 波段数/个 | 128 |
| 光谱分辨率/nm | 5.7 |
| 空间分辨率/m | 100 |
| 信噪比 | >200 |
| 偏振灵敏度/% | <5(430~1 000 nm) |
| 数据格式 | BIL,BSQ,HDF5 |
1.3 精度评价
采用统计方法作为检验反演值和实测值是否一致的标准。统计标准分别采用均方根误差(root-mean-square error,RMSE)和相对误差(relative error,RE)2种,表达式分别为
式中:
2 结果与分析
2.1 光谱特征分析
由实测光谱模拟得到的HICO光谱曲线如图3所示。
图3
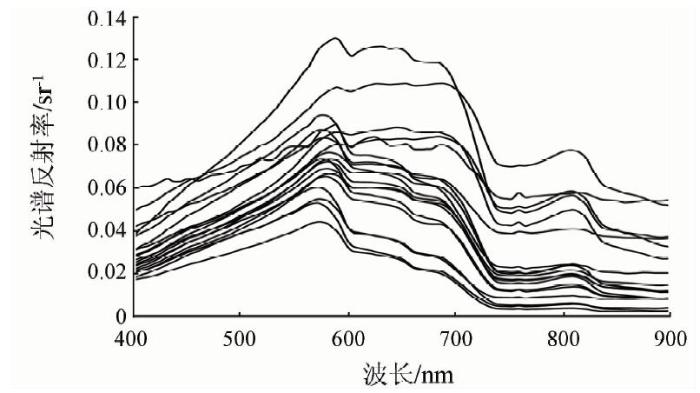
图3
19个站点的模拟HICO光谱反射率曲线
Fig.3
Spectral cuves of simulated HICO at 19 stations in Hangzhou Bay
2.2 单波段算法
单波段算法适用于光谱反射率与悬浮物浓度密切相关的情况,实测悬浮物浓度与模拟HICO光谱反射率的相关系数如图4所示。
图4
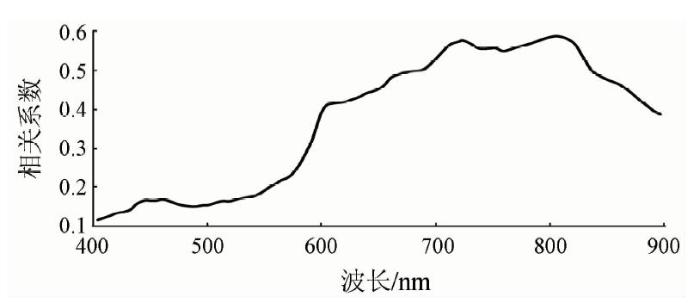
图4
模拟HICO光谱反射率与悬浮物浓度之间的相关系数
Fig.4
Correlation coefficients between TSM concentration and single bands of simulated HICO
由图4可以看出,悬浮物浓度与HICO光谱反射率呈明显的正相关,这是因为当水体中的悬浮物浓度较高时,水体的后向散射较大,从而离水辐射也增加,光谱反射率也会相应增加。随着波长的增加,光谱反射率与悬浮物浓度的相关性也在逐渐增大,这是因为随着波长的增加,水体中悬浮颗粒物和有色可溶性有机物的吸收系数占总吸收系数的比例在逐渐减小。
根据杭州湾海域现场测量得到的水体光谱数据和同步实测的悬浮物浓度,通过分析模拟HICO光谱所有波段与悬浮物浓度之间的相关性。结果表明,HICO第72波段即810.76 nm处的相关系数最大,据此建立了悬浮物浓度的反演模型,该模型的决定系数R2为0.356 9,反演得到的悬浮物浓度与实测悬浮物浓度之间的RMSE为36.09 mg/L,平均RE为37.5%(图5)。
图5
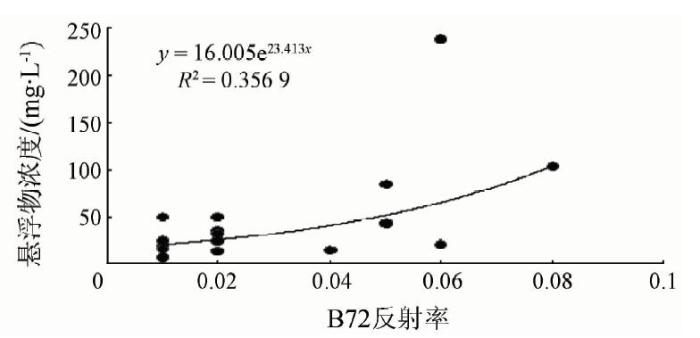
图5
不同光谱反射率与悬浮物浓度之间的关系
Fig.5
Relationship between the different remote sensing reflectance and TSM concentration
2.3 波段比值算法
波段比值算法是利用2个波段反射率的比值反演水质参数,有利于校正大气和光照等环境背景对测量结果的影响[20]。本文为寻找模拟HICO反演悬浮物浓度的最佳波段比值,在Matlab软件的支持下,分析了所有波段比值与悬浮物浓度的相关性。结果表明,相关系数较高的区域基本集中在蓝绿光波段,其中第57波段(724.84 nm)与第12波段(461.36 nm)光谱反射率的比值与悬浮物浓度相关性最高。故基于这2个波段建立了反演该海域悬浮物浓度的比值模型,模型的决定系数为0.925 2,反演得到的悬浮物浓度与实测悬浮物浓度之间的RMSE为14.09 mg/L,平均RE为5.2%(图6)。实测悬浮物浓度与反演值对比如图7所示。
图6
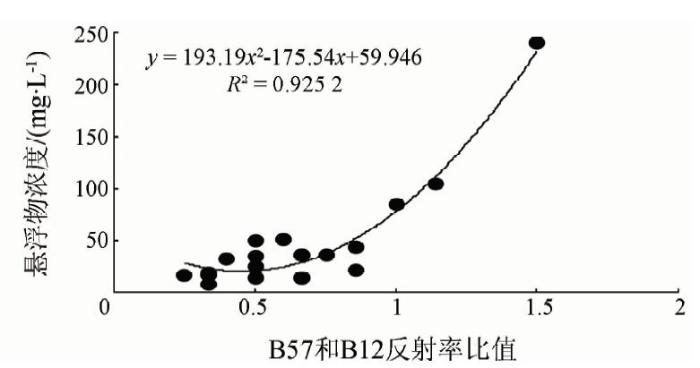
图7
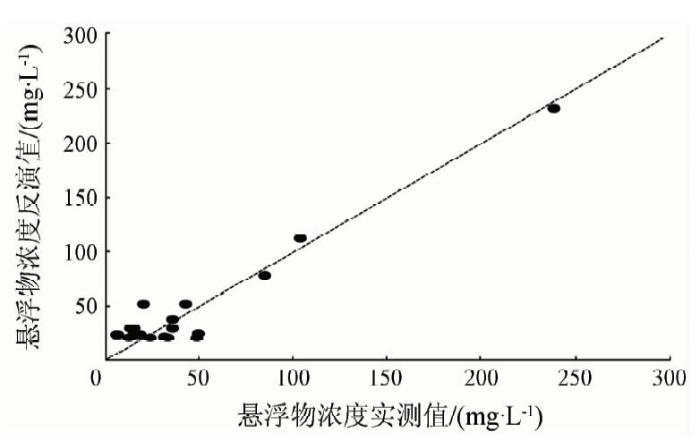
由图7可以看出,反演得到的悬浮物浓度与实测悬浮物浓度基本均匀地分布在1∶1线附近,表明该模型可有效反演该海域该时间段的悬浮物浓度。
2.4 近红外波段反射峰面积反演算法
图8
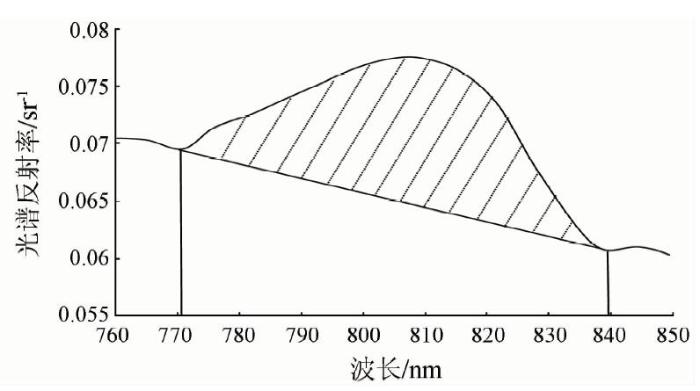
图8
水体悬浮物在近红外波段的反射峰面积示意图
Fig.8
Illustration of normalized peak area in near-infrared region
通过研究水体悬浮物在近红外波段反射峰的面积与悬浮物浓度之间的关系表明,反射峰面积与水体悬浮物浓度之间的决定系数为0.719 3,利用反射峰面积算法反演得到的悬浮物浓度与实测悬浮物浓度之间的RMSE为21.63 mg/L,平均RE为23.6%(图9)。
图9
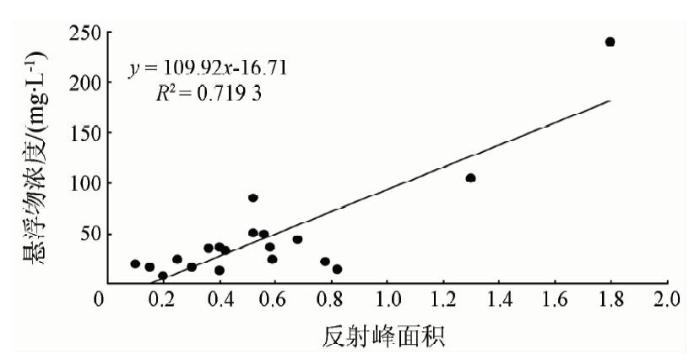
图9
反射峰面积与悬浮物浓度的相关关系
Fig.9
Relationship between normalized peak area and TSM concentration
3 结论
2010年7月下旬,本研究在杭州湾及其邻近海域进行野外光谱与同步悬浮物采样,采用累加平均的方法将实测原始光谱模拟成HICO光谱,对模拟光谱与悬浮物浓度之间的相关性进行了分析并构建模型。
1)利用724.84 nm与461.36 nm波段光谱反射率的比值建立的悬浮物浓度反演模型可获得较高的精度。
2)二类水体的组分是比较复杂的,不同区域水体,其光学特性各不相同,对于同一海域,季节不同,水体光学性质往往也是不同的。因此,利用光谱模型精确反演近海岸水体悬浮物浓度面临着巨大挑战。HICO作为全球第一颗针对近海岸遥感而设计的星载高光谱传感器,在水体悬浮物遥感方面具有极大的应用潜力。本研究成果对利用HICO模拟数据反演近海岸水体悬浮物具有一定的参考意义和应用价值。
参考文献
Estimation of the depth of sunlight penetration in the sea for remote sensing
[J].
DOI:10.1364/AO.14.000413
URL
PMID:20134900
[本文引用: 1]

Abstract The penetration depth of light in the sea is defined for remote sensing purposes as the depth above which 90% of the diffusely reflected irradiance (excluding specular reflectance) originates. It is demonstrated that for a homogeneous ocean, this is the depth at which the downwelling in-water irradiance falls to 1/e of its value at the surface. Penetration depths as a function of wavelength are presented for a variety of water types, and a mean penetration depth z (90) for a broadband sensor is defined and applied to the MSS on ERTS-1. The maximum z (90) expected for ERTS-l is found to be somewhat less than 20 m.
分季节的太湖悬浮物遥感估测模型研究
[J].
DOI:10.3321/j.issn:1003-5427.2007.03.003
URL
[本文引用: 1]
根据1996-2002年无锡太湖监测站的水质资料分析,太湖悬浮物具有季节性特征,因而分季节的悬浮物估测模型比单一的模型可能更加适合用来估测太湖全年的悬浮物浓度.在分析太湖水体光谱特征的基础上,根据太湖悬浮物的季节性分布特征,使用春夏秋冬四季的Landsat TM/ETM图像和准同步的水质采样数据,建立了太湖分季节的悬浮物估算模型.结果表明:估测因子(B2+B3)/(B2/B3)在舂、秋、冬三季都能很好地估测出悬浮物的浓度(R~3>0.52).夏季由于叶绿素的干扰性较大,悬浮物的估测效果不理想.冬季的估测效果最好(R~2=0.81),模型为lnSS=14.656×(B2+B3)/ (B2/B3)
Seasonal suspended sediment models in Lake Taihu using remote sensing data
[J].
A regional remote sensing algorithm for total suspended matter in the East China Sea
[J].
DOI:10.1016/j.rse.2012.06.014
URL
[本文引用: 1]
78 A new remote sensing algorithm for total suspended matter (TSM) is developed. 78 This algorithm combines a semi-analytical approach with empirical approaches. 78 The algorithm is based on a complex proxy from four indices of reflectance. 78 The performance is evaluated using a large number of in situ measurements. 78 The algorithm is suitable for coastal waters with a wide range of TSM.
Using geostationary satellite ocean color data to map the diurnal dynamics of suspended particulate matter in coastal waters
[J].
DOI:10.1016/j.rse.2013.01.023
URL
[本文引用: 1]
78 An atmospheric correction algorithm for turbid waters was proposed for GOCI. 78 A regional TSM algorithm in Hangzhou Bay was developed for GOCI. 78 GOCI-derived TSM diurnal variations matched the buoy data well.
A regional remote sensing algorithm for total suspended matter in the East China Sea
[J].
DOI:10.1016/j.rse.2012.06.014
URL
[本文引用: 1]
78 A new remote sensing algorithm for total suspended matter (TSM) is developed. 78 This algorithm combines a semi-analytical approach with empirical approaches. 78 The algorithm is based on a complex proxy from four indices of reflectance. 78 The performance is evaluated using a large number of in situ measurements. 78 The algorithm is suitable for coastal waters with a wide range of TSM.
Estimating suspended sediment concentrations from ocean colour measurements in moderately turbid waters;the impact of variable particle scattering properties
[J].
DOI:10.1016/j.rse.2004.11.002
URL
[本文引用: 1]
This study investigates the use of single-band reflectance at visible wavelengths for the derivation of suspended sediment concentrations in the Irish Sea. A reasonably strong relationship was observed between irradiance reflectance at 665 nm ( R 665) and mineral suspended sediment (MSS) concentrations. Variability in the Reflectance SS relationship was found to be the consequence of changes in the mass-specific scattering coefficient ( b MSS*) brought about by differences in particle properties such as grain size and composition. A systematic increase in the slope of the Reflectance SS relationship was observed with increasing b MSS*. A reflectance model is presented that highlights the dependence of reflectance on b MSS* and suggests that the errors in predicted MSS concentrations can be reduced from 56% to as little as 12% with prior knowledge of the scattering properties of the sediments under study. This paper highlights the need for a complete understanding of the scattering properties of particles in order to accurately estimate MSS concentrations from reflectance measurements. It is suggested that in order to obtain quantitative estimates of MSS in moderately turbid waters from space, it may be necessary to pre-determine scattering efficiencies, b MSS*, for the area of interest.
Retrieval of total suspended matter concentration in the Yellow and East China Seas from MODIS imagery
[J].
DOI:10.1016/j.rse.2009.09.016
URL
[本文引用: 1]
A retrieval algorithm, of total suspended matter (TSM) concentration in the Yellow Sea (YS) and East China Sea (ECS) was developed using observations made in the 2003 Spring and Autumn cruises over the YS and the ECS. Analysis of the in-situ backscattering coefficients of the suspended particles ( b bp) indicates that the accuracy becomes worse when the concentration of TSM ( C TSM) is higher than 20 mg/l. The accuracy of the b bp is improved by using a bio-optical model in which b bp is optimized with a non-linear least-square Levenberg arquardt method. The remote sensing reflectance ( R rs) is obtained by means of the optimization. The optimized R rs for waters with C TSM higher than 20 mg/l, together with the measured R rs for waters with C TSM lower than 20 mg/l, are used to establish the relationships between R rs(748), R rs(869) and R rs(645), which are used in the iterative method for atmospheric correction. Two atmospheric correction algorithms are switched according to the water turbidity. The shortwave infrared wavelengths (SWIR) method is used for waters with high-turbidity, and the iterative method is used otherwise. Results of the atmospheric correction were then applied to the Tassan model modified in this paper to compute the C TSM. Comparison between the retrieval results from MODIS imagery and the in-situ measurements indicates that the algorithms described in this paper can provide a reliable estimation of the C TSM distributions in the YS and ECS.
Development of suspended particulate matter algorithms for ocean color remote sensing
[J].
秋季太湖悬浮物高光谱估算模型
[J].
Models of estimated total suspend matter concentration base on hyper-spectrum in Lake Taihu,in autumn
[J].
Using the normalized peak area of remote sensing reflectance in the near-infrared region to estimate total suspended matter
[J].
DOI:10.1080/01431161.2010.524673
URL
[本文引用: 1]
The normalized peak area (NPA) of remote-sensing reflectance (R rs) in the near-infrared region was used to estimate the concentration of total suspended matter (C TSM) in coastal waters. A linear regression model between C TSM and S NPA (R 265=650.83) was established, where S NPA is the area encompassed by the reflectance curve and the straight line between wavelengths 768 and 840 nm where there is a maximum of R rs near 715 nm. In the Pearl River estuary of South China, this NPA model performed better than other single-band and multi-band regression models, with a root mean square error (RMSE) of 4.07 mg l–1. This model may be widely applied to in situ measurements of TSM.
Estimation of chlorophyll-a concentration in productive turbid waters using a hyperspectral imager for the coastal ocean? The Azov Sea case study
[J].
DOI:10.1088/1748-9326/6/2/024023
URL
[本文引用: 1]
We present here the results of chlorophyll-a (chl-a) concentration estimation using the red and near infrared (NIR) spectral bands of a Hyperspectral Imager for the Coastal Ocean (HICO) in productive turbid waters of the Azov Sea, Russia. During the data collection campaign in the summer of 2010 in Taganrog Bay and the Azov Sea, water samples were collected and concentrations of chl-a were measured analytically. The NIR-red models were tuned to optimize the spectral band selections and chl-a concentrations were retrieved from HICO data. The NIR-red three-band model with HICO-retrieved reflectances at wavelengths 684, 700, and 720 nm explained more than 85% of chl-a concentration variation in the range from 19.67 to 93.14 mg mand was able to estimate chl-a with root mean square error below 10 mg m. The results indicate the high potential of HICO data to estimate chl-a concentration in turbid productive (Case II) waters in real-time, which will be of immense value to scientists, natural resource managers, and decision makers involved in managing the inland and coastal aquatic ecosystems.
HICO-based NIR-red models for estimating chlorophyll-concentration in productive coastal waters
[J].
DOI:10.1109/LGRS.2013.2287458
URL
[本文引用: 1]
We present here results that demonstrate the potential of near-infrared (NIR)-red models to estimate chlorophyll- a (chl- a) concentration in coastal waters using data from the spaceborne Hyperspectral Imager for the Coastal Ocean (HICO). Since the recent demise of the MEdium Resolution Imaging Spectrometer (MERIS), the use of sensors such as HICO has become critical for coastal ocean color research. Algorithms based on two- and three-band NIR-red models, which were previously used very successfully with MERIS data, were applied to HICO images. The two- and three-band NIR-red algorithms yielded accurate estimates of chl- a concentration, with mean absolute errors that were only 10.92% and 9.58%, respectively, of the total range of chl- a concentrations measured over a period of several months in 2012 and 2013 on the Taganrog Bay in Russia. Given the uncertainties in the radiometric calibration of HICO, the results illustrate the robustness of the NIR-red algorithms and validate the radiometric, spectral, and atmospheric corrections applied to HICO data as they relate to estimating chl- a concentration in productive coastal waters. Inherent limitations due to the characteristics of the sensor and its orbit prohibit HICO from providing anywhere near the level of frequent global coverage as provided by standard multispectral ocean color sensors. Nevertheless, the results demonstrate the utility of HICO as a tool for determining water quality in select coastal areas and the cross-sensor applicability of NIR-red models and provide an indication of what could be achieved with future spaceborne hyperspectral sensors in estimating coastal water quality.
Performance evaluation of normalized difference chlorophyll index in northern Gulf of Mexico estuaries using the hyperspectral imager for the coastal ocean
[J].
DOI:10.1080/15481603.2014.895581
URL
[本文引用: 1]
The Hyperspectral Imager for the Coastal Ocean (HICO) was used to derive chlorophyll-a (chl-a) based on the normalized difference chlorophyll index (NDCI) in two Gulf of Mexico coastal estuaries. Chl-a data were acquired from discrete in situ water sample analysis and above-water hyperspectral surface acquisition system (HyperSAS) remote sensing reflectance in Pensacola Bay (PB) and Choctawhatchee Bay (CB). NDCI algorithm calibrations and validations were completed on HICO data. Linear and best-fit (polynomial) calibrations performed strongly with R2 of 0.90 and 0.96, respectively. The best validation of NDCI resulted with an R2 of 0.74 and root-mean-square error (RMSE) of 1.64 脗碌g/L. A strong spatial correspondence was observed between NDCI and chl-a, with higher NDCI associated with higher chl-a and these areas were primarily located in the northern PB and eastern CB at the river mouths. NDCI could be effectively used as a qualitative chl-a monitoring tool with a reduced need for site-specific calibration.
Assessing water quality in the northern Adriatic Sea from HICO TM data
[J].
DOI:10.1080/2150704X.2013.830203
URL
[本文引用: 1]
This letter focuses on water-quality estimation in the northern Adriatic Sea using physically-based methods applied to image obtained with the Hyperspectral Imager for the Coastal Ocean (HICO64). Optical properties of atmosphere and water were synchronously measured to parameterise such methods. HICO64-derived maps of chlorophyll-a (chl-a) and suspended particulate matter (SPM) indicated low values, in the range of 0–302mg02m613 and 0–402g02m613, respectively, correlating significantly with field data (R202=020.71 for chl-a and R202=020.85 for SPM). The results, on analysis, identify clear waters in the open sea and moderately turbid waters near the coast due to river sediment discharge and organic matter from coastal lagoons. These findings support the use of HICO64 data to assess water-quality parameters in coastal zones and suggest the feasibility of integrating them with future-generation space-borne hyperspectral images.
Remote sensing of selected water-quality indicators with the hyperspectral imager for the coastal ocean (HICO) sensor
[J].
DOI:10.1080/01431161.2014.894663
URL
[本文引用: 1]
The Hyperspectral Imager for the Coastal Ocean (HICO) offers the coastal environmental monitoring community an unprecedented opportunity to observe changes in coastal and estuarine water quality across a range of spatial scales not feasible with traditional field-based monitoring or existing ocean colour satellites. HICO, an Office of Naval Research-sponsored programme, is the first space-based maritime hyperspectral imaging instrument designed specifically for the coastal ocean. HICO has been operating since September 2009 from the Japanese Experiment Module – Exposed Facility on the International Space Station (ISS). The high pixel resolution (approximately 9502m at nadir) and hyperspectral imaging capability offer a unique opportunity for characterizing a wide range of water colour constituents that could be used to assess environmental condition. In this study, we transform atmospherically corrected ISS/HICO hyperspectral imagery and derive environmental response variables routinely used for evaluating the environmental condition of coastal ecosystem resources. Using atmospherically corrected HICO imagery and a comprehensive field validation programme, three regionally specific algorithms were developed to estimate basic water-quality properties traditionally measured by monitoring agencies. Results indicated that a three-band chlorophyll a algorithm performed best (R202=020.62) when compared with in situ measurement data collected 2–402hours of HICO acquisitions. Coloured dissolved organic matter (CDOM) (R202=020.93) and turbidity (R202=020.67) were also highly correlated. The distributions of these water-quality indicators were mapped for four estuaries along the northwest coast of Florida from April 2010 to May 2012. However, before the HICO sensor can be transitioned from proof-of-concept to operational status and its data applied to benefit decisions made by coastal managers, problems with vicarious calibration of the sensor need to be resolved and standardized protocols are required for atmospheric correction. Ideally, the sensor should be placed on a polar orbiting platform for greater spatial and temporal coverage as well as for image synchronization with field validation efforts.
Fearns P R C S,Mckinna L I W.Detecting trend and seasonal changes in bathymetry derived from HICO imagery:A case study of Shark Bay,Western Australia
[J].
DOI:10.1016/j.rse.2014.03.010
URL
[本文引用: 1]
61We investigate challenges faced in temporal analysis of HICO derived bathymetry.61Optimized shallow water inversion model yields precise retrievals in bathymetry.61Retrieved bathymetry can detect temporal changes in depth of less than 1m.61HICO geolocation requires sub-pixel accuracy before use in time series analysis.61New post-processing techniques to image enhancements and tide correction are given.
Remote Sensing of Ocean Colour in Coastal,and Other Optically-complex,Waters[R].Dartmouth:the International Ocean-
Optical properties of the clearest natural waters(200-800 nm)
[J].
DOI:10.1364/AO.20.000177
URL
PMID:20309088
[本文引用: 1]
A new UV submersible spectroradiometer has been employed to determine the diffuse attenuation coefficient for irradiance in the clearest natural waters [K(w)(lambda)] with emphasis on the spectral region from 300 to 400 nm. K(w)(lambda) can be related to the inherent optical properties of pure water, in particular the total absorption coefficient a(w)(lambda) and the molecular scattering coefficient b(m)(lambda), by means of equations derived from radiative transfer theory. We present an analysis showing that limiting values of K(w)(lambda) can be estimated from a(w)(lambda) and vice versa. Published a(w)(lambda) data, which show discrepancies much larger than their estimated accuracies, are briefly reviewed and then compared, via our analysis, with K(w)(lambda) data (our own new and previously published data as well as relevant data of others). This comparative analysis and new data allow a consistent and accurate set of optical properties for the clearest natural waters and for pure fresh water and saltwater to be estimated from 300 to 800 nm.
Absorption spectrum (380-700 nm) of pure water.II.Integrating cavity measurements
[J].DOI:10.1364/AO.36.008710 URL [本文引用: 1]
Lake water quality classification with airborne hyperspectral spectrometer and simulated MERIS data
[J].
DOI:10.1016/S0034-4257(01)00238-3
URL
[本文引用: 1]
We study the use of airborne and simulated satellite remote sensing data for classification of three water quality variables: Secchi depth, turbidity, and chlorophyll a. An extensive airborne spectrometer and ground truth data set obtained in four lake water quality measurement campaigns in southern Finland during 1996 1998 was used in the analysis. The class limits for the water quality variables were obtained from two operational classification standards. When remote sensing data is used, a combination of them proved to be the most suitable. The feasibility of the system for operational use was tested by training and testing the retrieval algorithms with separate data sets. In this case, the classification accuracy is 90% for three Secchi depth classes, 79% for five turbidity classes, and 78% for five chlorophyll a classes. When Airborne Imaging Spectrometer for Applications (AISA) data was spectrally averaged corresponding to Envisat Medium Resolution Imaging Spectrometer (MERIS) channels, the classification accuracy was about the same as in the case of the original AISA channels.
