

0 引言
浑善达克沙地是内蒙古4大沙地之一,是中国京津冀经济区重要的生态屏障。沙地榆树疏林是一种极具区域特色的植被类型,由于它主要分布于温带地区,并且与分布于热带、亚热带地区的稀树草原(savanna)非常相似,一些研究就称之为温带savanna[1,2,3]。榆树疏林是浑善达克沙地生态系统的重要组成部分,它的退化会直接导致沙地生态系统的退化和荒漠化的扩张,因此保护好榆树疏林对于防治沙地荒漠化扩张很有必要[4]。准确的榆树疏林覆盖数据是其他科学合理研究的前提条件,其准确的监测结果是管理决策者重要参考依据。由于常规的野外树木调查入库花费人力、财力很大,寻找一种替代的收集榆树疏林覆盖数据的方法很有必要。近年来,遥感技术发展十分迅速,影像空间分辨率有了很大提高,高空间分辨率遥感影像的可选择性越来越高,遥感已成为一种分析大范围林地生态系统的重要工具。用高空间分辨率遥感影像提取树冠轮廓,可有效提高调查效率,减少外业工作强度,对摸清榆树疏林的规模和分布状况,从而制定合理的保护管理对策有实际意义。但如何有效提取树冠仍是一个难题,也是近几年来国内外遥感领域研究的热点。
目前,国内对榆树疏林的研究多局限于生态方面[5,6],运用遥感技术对榆树疏林树冠提取的研究较少。面向地理对象影像分析技术(geographic object based image analysis,GEOBIA)是将影像分割为有意义的地理对象,利用对象的光谱、几何和纹理等信息,发展与应用自动化或半自动化遥感影像解译分析的理论、方法和工具,提高影像解译准确度及效率,节省人力、物力和财力,被认为是处理遥感中各种复杂特征识别问题的一种有效方法[7]。GEOBIA已在非洲、澳大利亚和美国等稀树草原树冠提取上得到很好应用。Laliberte等使用QuickBird数据,采用多尺度分层分割和CART决策树方法提取干旱区灌木[8]; Gibbes等使用IKONOS数据,基于面向对象分类的方法提取稀疏树木[9]; Boggs使用SPOT-5和QuickBird数据,利用基于像素的归一化植被指数(normalized difference vegetation index,NDVI)阈值方法和面向对象分类方法分别提取研究区稀疏树冠,结果表明面向对象方法要比阈值提取结果精度普遍高[10]; 施敏燕等基于QuickBird数据,采用面向对象多层次分割方法提取额济纳胡杨林树冠信息,结果表明该方法可准确示出植株的分布情况[11]。
国外关于Savanna的研究可为榆树疏林的研究提供有益的参考价值,本文探讨使用国产高空间分辨率数据利用遥感技术提取榆树覆盖的方法。该方法将很大程度降低外业调查的工作量,拓宽国产高空间分辨率影像在疏林草原生态系统上的应用前景。
1 研究区概况及数据源
1.1 研究区概况
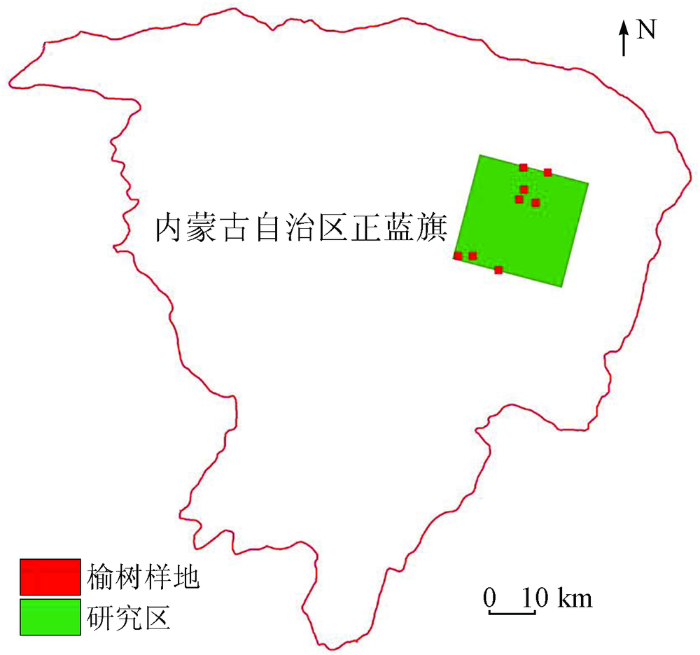
研究区位于内蒙古自治区正蓝旗,该区为天然沙地榆集中分布区,以“蓝旗榆”著称,其北部为浑善达克山地腹地,南部为低山丘陵,该区地理坐标为: E115°00'~116°42',N41°56'~43°11'。正蓝旗气候属于干旱、半干旱大陆性季风气候,年平均气温为1.7 ℃,年平均降水量为350 mm左右,年平均蒸发量为2 700 mm左右,呈现“收入少,支出多”的特点。研究区属于欧亚草原区,植物物种丰富,是一个含有散生沙地榆树林的温带型干旱地区,榆树疏林群落结构和组成均单一,很少有其他树种。根据锡林郭勒盟森林资源统计,1976年正蓝旗内榆树疏林面积达2 482 hm2[12]。沙地榆树多呈丛状分布,每丛3~5株,最多达20余株,根据树龄不同可分为5 a以下幼苗、5~30 a幼树、30~70 a成熟树及70 a以上老龄树,最大高度约9~10 m,最大胸径约90 cm,最大冠幅约9~12 m[13]。沙地榆树在每年5月初开始萌动,于10月底落叶,另外考虑到8月底—9月初是该地区打草季节,为减少草地对榆树信息提取的影响,本研究首选影像成像时间是9月中旬—10月底或5月底—7月初。研究区地理位置如图1所示。
图1
1.2 数据源
1)遥感数据及预处理。本研究选取了一景GF-2数据,获取时间为2016年9月16日。数据的预处理包括辐射校正、几何纠正和影像融合等。辐射校正是在ENVI5.3软件中FLAASH模型下进行,以消除因辐射误差而引起的影像畸变; 几何纠正是在ERDAS9.2软件下进行,参考影像是空间分辨率为2 m高精度正射校正后ZY-3数据,几何纠正的绝对误差小于1个像元。对几何纠正后影像进行投影转换为WGS84 UTM Zone 50N。影像融合算法为NNDiffuse Pan Sharpening,该算法能很好地保留影像的色彩、纹理和光谱信息。GF-2卫星传感器具体参数如表1所示。
表1 GF-2卫星传感器参数
Tab.1
| 参数 | 参数值 | ||
|---|---|---|---|
| 光谱范围/μm | 全色 | 0.45~0.90 | |
| 多光谱 | 0.45~0.52 | ||
| 0.52~0.59 | |||
| 0.63~0.69 | |||
| 0.77~0.89 | |||
| 空间分辨率/m | 全色 | 1 | |
| 多光谱 | 4 | ||
| 幅宽/km | 45 (2台相机组合) | ||
| 轨道高度/km | 631 | ||
| 重访周期 | 不侧摆时,69 d可完成全球无缝覆盖观测, 侧摆时,重访周期不大于5 d | ||
2)地面调查数据。自2011年开始连续6 a对浑善达克沙地及其周边开展野外调查,获得了大量野外样地实测资料。其中,2014—2016年间重点对正蓝旗境内榆树疏林进行3次地面调查,设置大小为50 m×50 m样地,调查内容包括样地内每木经纬度、胸径、冠幅(包括东西、南北2个方向)和树高,同时拍摄样地照片作为补充。本研究所用的GF-2影像区域内含8个实测榆树样地,140棵单木。为弥补GPS定位误差,结合外业调查数据与目视解译判读结果,在融合后影像上目视手动勾绘150个图斑作为参考数据,用于榆树区粗提取过程阈值及条件的设置,其中有24个榆树群和126棵榆树单木。
2 研究方法
为提高识别精度和数据处理速度,本研究以融合后的GF-2影像为数据源,先建立NDVI阈值初步判断,再采用GEOBIA方法深度分析研究区的典型沙地榆树,这对北方干旱、半干旱地区典型树种识别具有重要参考意义; 同时对评价该地区的生态环境也具有重要的现实意义。
2.1 榆树区粗提取
由于研究区榆树大多分布在沙质土壤上,并且分布稀疏,可用NDVI初步掩模非榆树区。NDVI能够很好地区分植被区与非植被区,但阈值太小会保留大面积林下植被,阈值过大会排除一些小榆树。树冠反射率受光合物质叶子和非光合物质枝干的共同影响,与其他植被类型相比,尤其是草地,它们有较明显的光谱变化。因此,基于影像对象的空间和光谱信息提取榆树,可通过对NDVI设置阈值生成对象,使用对象的NIR标准差作为区分树冠的一个指标。为防止大面积背景参与分类,结合统计数据,设置面积阈值大于20 m2且小于3 000 m2的限制条件。单棵榆树或小面积榆树群的形状接近椭圆形,利用其圆度和椭圆度几何特征可以很好地将其识别。NDVI计算公式为
式中:
图2
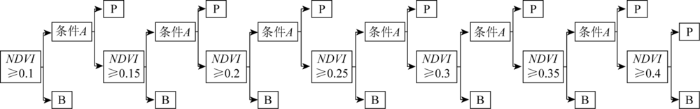
根据统计目视勾绘的参考样本特征值设置NDVI阈值及条件A。本文参考数据特征值统计结果见表2。
表2 参考数据特征值统计
Tab.2
| 对象特征 | 最小值 | 最大值 | 均值 | 公式① |
|---|---|---|---|---|
| NDVI均值 | 0.13 | 0.73 | 0.52 | |
| NIR标准差 | 488 | 1 123 | 713 | |
| 面积 | 40 | 2 236 | 250 | |
| 椭圆度 | 0.43 | 0.96 | 0.86 | — |
| 圆度 | 0.04 | 1.2 | 0.26 |
①: b为NDVI均值; n为对象内像素数量;
2.2 基于GEOBIA方法的榆树区准确提取
本研究使用GEOBIA方法对粗提取结果进一步准确提取。此方法从提出到现在10余a内,已广泛应用于城市监测、灾害监测等很多领域,但在干旱区植被提取方面应用很少[14,15],其优势是以对象为处理单元克服像素级分类的椒盐现象,且能够充分利用影像对象的光谱、几何和纹理等特征,但特征选择和规则集构建的不确定性是制约其发展的关键因素。因此,本研究基于分离阈值(separability and thresholds,SEaTH)算法优选特征及自动构建规则集。该算法由Nussbaum等人提出,是一种基于J-M(Jeffries-Matudita)距离评价2个类别在某特征上的关联程度和根据高斯概率分布模型计算特征阈值的方法[16]。
1)分割方法。本文采用的分割方法为Multiresolution segmentation 多尺度算法。它是一种自下而上的区域生长算法,通过合并相邻像元或者对象,保证对象内部像元之间同质性最大、异质性最小。多尺度分割主要设置参数包括分割尺度、波段权重及匀质性因子。分割尺度的设置至关重要,如何选择最佳分割尺度也是很多学者研究的热点,目前已出现了一些确定最佳分割尺度的方法或工具,如最大面积法、目标函数法和面积比均值法等。但很多研究仍采用多次试验比较分割结果的方法来确定最佳分割尺度,因为随着分割尺度增大分割对象也增大,但是两者之间并没有直接关系,因此,仍需要多次尝试来确定分割尺度。
2)特征筛选。目视查看潜在榆树区发现,除榆树外还包括灌木、草地、草本湿地、人工杨树林和沙地5种类别。根据样本的代表性和分布均匀性,本文选取470个分割对象作为样本,其中灌木47个、草地52个、草本湿地78个、榆树152个、沙地108个和人工杨树林33个。分别统计其特征值,估计其概率分布,计算2种类别C1和C2之间的J-M距离来评价其可分离度[17]。J-M距离取值范围为[0,2],其值为0时表示2个类别在某特征上完全不能区分,其值趋向于2时表示2个类别在某特征上的分离度较大,因此选择J-M距离较大的特征组成最优特征集。具体计算公式为
式中: B为巴氏距离;
影像对象常用特征包括光谱特征、几何特征和纹理特征。本文考虑的光谱特征包括各波段及NDVI的均值、标准差、比率、最大方差及亮度等; 几何特征包括面积、长度、宽度、长宽比、圆度、椭圆适合性和矩形适合性等; 纹理特征包括各个波段图像灰度共生矩阵(gray-level co-occurrence matrix,GLCM)的匀质性、反差、熵、均值、标准差、相关性、相性和角二矩阵等。
3)特征阈值自动计算。当某特征符合正态概率分布时,根据高斯概率分布函数公式,满足
式中
如果
如果
如果1.25
如果
4)分类识别方法。根据SEaTH算法筛选的特征及阈值结果对榆树类别进行类描述,使用eCogni-
tion中规则分类的classification算法进行榆树分类识别,将其他地类归为背景; 最终将影像分为榆树和背景2个类别。
3 结果分析
3.1 榆树区粗提取
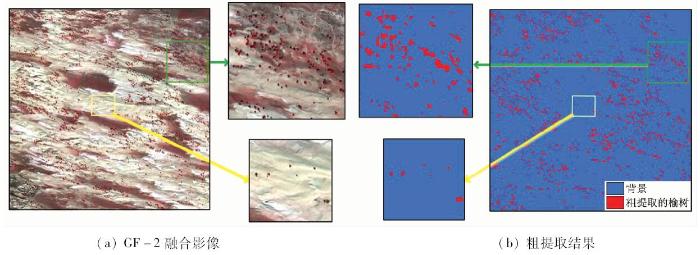
局部榆树粗提取结果如图3所示,其中,蓝色为背景,红色为粗提取榆树分布区,可以发现大多数非榆树区被归为背景类中,榆树区被初步识别出来。目视查看榆树粗提取效果,发现冠幅小的榆树单木能够被很好地识别,并且提取的冠幅接近其真实冠幅,而聚集分布的多株榆树除了榆树之外,其林下植被、沙地和灌丛等也会被粗提取出来。此外,粗提取结果还包括一些草本湿地、人工杨树林等非榆树区,仍需要进一步准确提取。
图3
3.2 多尺度分割
利用NDVI阈值粗提取榆树分布区只是一个初步的提取过程,提取结果仍包括一些灌丛、草地、草本湿地、人工杨树林及沙地等非榆树区,需进一步对粗提取结果进行准确提取,首先是影像分割。本文选取多尺度分割方法,分割尺度及匀质性因子是通过多次试验比较分割结果来确定。由于分割过程中主要利用影像的光谱因子,所以光谱因子相对更为重要。波段权重的设置参考Ren等[19]提出的最佳指数因子(optimum index factor,OIF),该方法是一种简单有效筛选波段的方法,通过计算各波段的标准差和波段间的相关系数的比值选择最佳的波段组合,其具体计算公式为
式中:
表3 GF-2各波段的标准差及波段间相关系数
Tab.3
| 相关性 | B1 | B2 | B3 | B4 | 标准差 |
|---|---|---|---|---|---|
| B1① | 1 | 0.99 | 0.98 | 0.84 | 476.5 |
| B2 | 1 | 0.99 | 0.88 | 615.5 | |
| B3 | 1 | 0.87 | 786.8 | ||
| B4 | 1 | 661.8 |
①: B4为近红外波段,B3为红光波段,B2为绿光波段,B1为蓝光波段。
表4 GF-2各波段组合OIF值
Tab.4
| 波段组合 | OFI指数 |
|---|---|
| B1,B2,B3 | 634.7 |
| B1,B2,B4 | 647.1 |
| B1,B3,B4 | 715.6 |
| B2,B3,B4 | 753.3 |
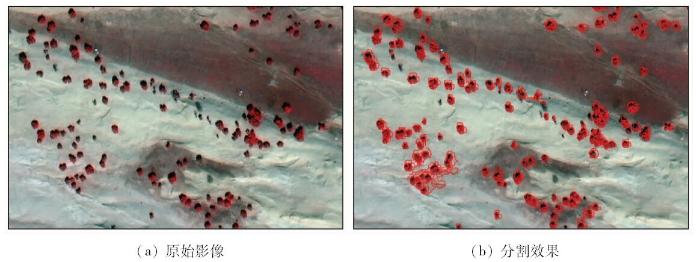
需要注意分割尺度不易设置过小,防止单棵树冠被过度分割。经过多次尝试,最终确定分割尺度为40,各波段权重分别为0(B1)、1(B2)、2(B3)、1(B4)、1(NDVI),光谱因子为0.7,形状因子为0.3,光滑度和紧密度为0.5。局部分割效果如图4所示。
图4
3.3 基于SEaTH算法的榆树疏林提取规则集构建
表5 榆树的提取规则
Tab.5
| 地物类别 | 区分类别 | 区分规则① | J-M距离 | T | |
|---|---|---|---|---|---|
| 榆树 | 灌木 | Ratio G<0.183 | 1.61 | 0.173 | 0.192 |
| 草地 | Standard deviation NIR>123 | 1.79 | 123 | 70 | |
| 草本湿地 | GLCM Entropy (90)<5.97 | 1.61 | 5.54 | 6.40 | |
| 人工杨树林 | Ratio R>0.119 6 | 1.83 | 0.119 6 | 0.095 4 | |
| 沙地 | HSI Transformation Intensity(R=r,G=g,B=b)<0.027 | 1.93 | 0.027 | 0.047 |
①: Ratio G为绿光波段比值; Standard deviation NIR为近红外波段标准差; GLCM Entropy (90)为灰度共生矩阵熵特征; Ratio R为红光波段比值; HSI Transformation Intensity(R=r,G=g,B=b)为HSI变换强度。
3.4 榆树分类识别结果及精度评价
根据表5采用SEaTH算法构建的榆树准确提取规则,进一步掩模非榆树区,将能够同时满足其中5条规则的对象被识别为榆树,其他地类则为背景。
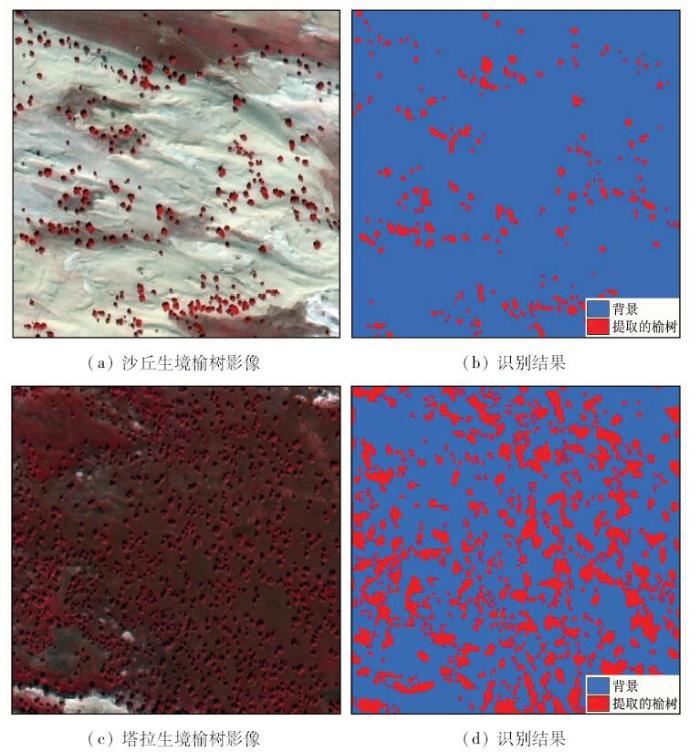
图5为研究区局部地区榆树覆盖信息识别提取结果,选取2种不同生境(沙丘、塔拉)榆树种群并对比其提取结果,其中蓝色为背景,红色为最终提取的榆树。
图5
本研究使用混淆矩阵对分类识别结果进行精度评价。在榆树识别结果上对榆树与背景2个类别分别生成随机点各300个,然后在融合后的GF-2影像上目视判读各个点的类别作为参考,通过对比榆树分类识别结果,逐一判断这600个随机点的分类正误,构建混淆矩阵进行评价,结果见表6。
表6 榆树识别精度评价
Tab.6
| 识别类型 | 背景 | 榆树 | 总计 |
|---|---|---|---|
| 背景 | 298 | 2 | 300 |
| 榆树 | 69 | 231 | 300 |
| 总计 | 367 | 233 | 600 |
| 用户精度/% | 99.33 | 77 | |
| 制图精度/% | 81.20 | 99.14 | |
| 总体精度/% | 88.17 | ||
| Kappa | 0.76 | ||
4 结论与讨论
目前对沙地榆树疏林的研究多是采用样地调查、实地走访和查阅历史文献等传统方法,并且研究内容多局限于生态方面,运用遥感技术去探讨榆树疏林空间分布的研究很少。本文尝试通过遥感手段使用GF-2数据采用基于GEOBIA技术提取研究区榆树,为沙地榆树信息提取提供有效决策支撑,获得主要结论如下:
1)NDVI阈值可快速掩模大多数非榆树区,准确提取榆树的潜在分布区,减少后续榆树准确提取的工作量,适用于榆树疏林区的粗提取。
2)本文使用GF-2基于GEOBIA方法进一步识别榆树,具有一定的可行性。经验证,其总体精度为88.17%,榆树提取的制图精度达99.14%,基本可以满足榆树疏林区识别的要求。
3)采用单景GF-2影像,结合研究区榆树疏林的分布特性,提出先使用NDVI粗提取榆树分布区,与直接采用GEOBIA方法提取榆树分布区相比,可提高识别精度并加快数据处理速度。
4)考虑到特征选择和规则集构建的不确定性对GEOBIA方法的制约,提出基于SEaTH算法优选特征及自动计算特征阈值,减少人为的主观干扰,取得了较好的效果,使浑善达克沙地榆树疏林信息提取进入了新的阶段,对于该地区榆树疏林管理有一定的帮助。但是浑善达克沙地面积广阔,情况复杂多样,本研究提出的方法需要进一步验证。
5)本文方法也存在一些不足,仍有待进一步改善。例如塔拉生境中榆树由于受背景影响,使用本文方法提取效果比较一般。下一步研究可考虑结合多个时相的遥感数据来提高塔拉生境中榆树的识别准确率,改进本研究方法的不足。
参考文献
浑善达克沙地中部榆树疏林景观格局
[J].
DOI:10.3981/j.issn.1000-7857.2011.25.006
URL
[本文引用: 1]

通过野外调查及3S技术,分析了浑善达克沙地中部榆树疏林景观的景观数量、景观面积及形状复杂性等景观格局特征。结果发现,疏林景观斑块数量高达100606个,但是77%的疏林斑块面积不到0.5hm2,表现为景观斑块数量多、面积小,斑块形状复杂,斑块破碎化比较严重,急需保护。在进行浑善达克沙地生态恢复时,首先考虑的应当是保护榆树疏林斑块的完整性,坚持景观斑块连片保护,提高保护效果。
Landscape pattern of elm open forest in the center part of Hunshandake sandland
[J].
内蒙古高原温带稀树草原生态系统特征与成因
[J].内蒙古高原分布的温带榆树稀树草原生态系统在中国乃至世界上都是一种特殊的生态系统,对于它的研究可加深对植被分布规律的理解,且有利于该系统的保护.本文分析了该生态系统的地理分布、气候特点、土壤状况、物种组成、群落结构及天然更新状况等,比较了草原、森林和稀树草原3个生态系统的特征,提出了在内蒙古高原分布的温带榆树稀树草原生态系统是在独特的气候、土壤和地形条件下形成的经度(水分梯度)地带性顶极植被,决定其存在的最关键因素首先是降水量和土壤的水分条件,其次才是沙质土壤.这种生态系统既不是草原,又不是森林,而是介于落叶阔叶林和草原之间的一种生态系统类型.在此纬度带上,从东到西分布的经度地带性植被谱应为:温带森林、温带稀树草原、典型草原、荒漠草原等.在同一纬度带上,沙质土壤的基质并不完全被稀树草原生态系统所覆盖,还有沙漠等生态系统类型.建议<中国植被>增加一个新的植被类型,温带稀树草原.
Characteristics and formation causes of temperate sparse forest grassland ecosystem in Inner Mongolia Plateau
[J].
人为干扰对浑善达克沙地榆树疏林的影响
[J].
DOI:10.17521/cjpe.2003.0119
URL
[本文引用: 1]
There are many elm (Ulmus pumila) distributed on the fixed sand dune in Hunshandak Sandland. Elms-motte-veldt is the climax community of vegetation succession in this region. Recently, the quantity of elms decreased sharply, especially for the young elms
Impacts of human disturbance on elms-motte-veldt in Hunshandak sandland
[J].
浑善达克沙地榆树疏林榆树种群特征分析
[D].
Analysis of Population Characteristics of Ulmus Pumila Sparse Forest in Hunshandake Sandy Land
[D].
正蓝旗古榆树种群特征及林下植物多样性的研究
[D].
Study on the Population Characteristics of Ancience Elm in Zhenglan Banner
[D].
浑善达克沙地桑根达来地区榆树疏林的分布与立地因子的关系的研究
[J].本文以浑善达克沙地沙地榆(Ulmus pumila L.var.sabulosaJ.H.Guo)为研究对象,把沙地榆生境划分六种立地类型,使用野外调查法,对沙地榆(Ulmus pumilaL.var.sabulosa J.H.Guo)的生长与立地关系进行分析。结果表明:在调查样带六种立地类型上榆树的密度和盖度分别是丘间低地4.9株/hm2和2%;迎风坡中部 7.6株/hm2和3%;迎风坡下部9株/hm2和4%;背风坡下部9.4株/hm2和4.8%;丘顶13株/hm2和5%;背风坡中部17株/hm2和 5.8%。六种立地类型中以基径为指标,比较榆树生长状况为丘间地>迎风坡中部>迎风坡下部>丘顶>背风坡下部>背风坡中 部;丘间地榆树平均基径最大,达到29.11cm:背风坡下部榆树平均基径最小,只有21.7cm。
Study on the relation between growth and site of Ulmus pumila L.var.sabulosa J.H.Guo in Otingdag sandy land
[J].
基于随机森林的地理要素面向对象自动解译方法
[J].
DOI:10.13203/j.whugis20140102
URL
[本文引用: 1]
面向地理对象影像分析(GEOBIA)技术取得了显著的进展,代表了遥感影像解译的发展范式,其主要目标是发展智能化分析方法。随机森林机器学习方法是一种相对新的、数据驱动的非参数分类方法,具有自动特征优选、自动模型构建等优势,为智能化分析提供了有效手段。充分利用GEOBIA及随机森林机器学习的优势,提出了基于随机森林的地理要素面向对象自动解译方法,阐述了随机森林面向对象分类方法的技术流程,为设计和实现该方法提供了详细指导,有助于指导用户优选特征和构建分类模型。通过与支持向量机分类的对比实验证明,该方法可以自动进行特征优选及分类模型的构建,利用较少的特征得到较高的分类精度,在不损失性能的前提下减少了计算量和内存使用,能够为大范围、大区域地理要素自动解译提供先验知识及自动化的手段。
An object-based automatic interpretation method for geographic features based on random forest machine learning
[J].
Combining decision trees with hierarchical object-oriented image analysis for mapping arid rangelands
[J].
DOI:10.14358/PERS.73.2.197
URL
[本文引用: 1]
Decision tree analysis is a statistical approach for developing a rule base used for image classification developed a unique approach using object-based rather than pixel-based image information as input for a classification for mapping arid land vegetation. A QuickBird satellite image was segmented at four different scales, resulting in hierarchical netowrk of image objects representing the image information in different spatial resolutions. This allowed differentiation of individual shrubs at a fine scale and delineation of broader vegetation classes at coarser scales. Input variables included spectral, textural and contextual image information, and the variables chosen by the decision tree included many features not available or as easily determined with pixel based image analysis. Spectral information was selected near the top of the classification trees, while contextual and textural variables were more common closer to the terminal nodes of the classification tree. The combination of multi resolution image segmentation and deceision tree analysis facilitated the selection of input variables and helped in determining the appropriate image analysis scale.
Application of object based classification and high resolution satellite imagery for savanna ecosystem analysis
[J].
DOI:10.3390/rs2122748
URL
[本文引用: 1]
Savanna ecosystems are an important component of dryland regions and yet are exceedingly difficult to study using satellite imagery. Savannas are composed are varying amounts of trees, shrubs and grasses and typically traditional classification schemes or vegetation indices cannot differentiate across class type. This research utilizes object based classification (OBC) for a region in Namibia, using IKONOS imagery, to help differentiate tree canopies and therefore woodland savanna, from shrub or grasslands. The methodology involved the identification and isolation of tree canopies within the imagery and the creation of tree polygon layers had an overall accuracy of 84%. In addition, the results were scaled up to a corresponding Landsat image of the same region, and the OBC results compared to corresponding pixel values of NDVI. The results were not compelling, indicating once more the problems of these traditional image analysis techniques for savanna ecosystems. Overall, the use of the OBC holds great promise for this ecosystem and could be utilized more frequently in studies of vegetation structure.
Assessment of SPOT 5 and QuickBird remotely sensed imagery for mapping tree cover in savannas
[J].
DOI:10.1016/j.jag.2009.11.001
URL
[本文引用: 1]
The relative abundance and distribution of trees in savannas has important implications for ecosystem function. High spatial resolution satellite sensors, including QuickBird and IKONOS, have been successfully used to map tree cover patterns in savannas. SPOT 5, with a 2.5 m panchromatic band and 10 m multispectral bands, represents a relatively coarse resolution sensor within this context, but has the advantage of being relatively inexpensive and more widely available. This study evaluates the performance of NDVI threshold and object based image analysis techniques for mapping tree canopies from QuickBird and SPOT 5 imagery in two savanna systems in southern Africa. High thematic mapping accuracies were obtained with the QuickBird imagery, independent of mapping technique. Geometric properties of the mapping indicated that the NDVI threshold produced smaller patch sizes, but that overall patch size distributions were similar. Tree canopy mapping using SPOT 5 imagery and an NDVI threshold approach performed poorly, however acceptable thematic accuracies were obtained from the object based image analysis. Although patch sizes were generally larger than those mapped from the QuickBird image data, patch size distributions mapped with object based image analysis of SPOT 5 have a similar form to the QuickBird mapping. This indicates that SPOT 5 imagery is suitable for regional studies of tree canopy cover patterns.
基于Quickbird影像的额济纳胡杨林树冠提取
[J].
Canopy extraction of Populus euphratica forest in Ejina based on Quickbird image
[J].
浑善达克沙地桑根达来地区榆树疏林林草特征的研究
[D].
Studies on Characteristics of Trees and Grass Ulmus pumila L.var.sabulosa Woodland of Sanggendalai in Hunshandake Sandy Land
[D].
Extraction of tree crowns from high resolution imagery over Eucalypt dominant tropical savannas
[J].
DOI:10.14358/PERS.77.8.813
URL
[本文引用: 1]
High spatial resolution satellite imagery provides data that enable the analysis of detailed landscape information, including tree crowns. The inherent characteristics of Eucalypt crowns are challenging to remotely sensed tree crown extraction. This paper develops and applies an object-based tree crown delineation approach suitable for estimating canopy cover of Eucalypts in tropical savannas. A two level segmentation was undertaken upon QuickBird data. First, a broad segmentation masked out non-Eucalypt dominant communities; and second, a finer segmentation and ruleset identified seed objects within crowns, and then expanded these objects to cover entire crown extents. Of the 1,604 tree crowns manually observed within the scene, 84.3 percent were detected by the automated seed identification process. Seventy-five percent of tree crowns extracted through the region growing process show strong overlap with their corresponding reference crowns. Results indicate the potential of this method for delineating tree crowns from Eucalypt dominant savanna and the use of this information to estimate canopy cover and tree distribution patterns.
Tree crown mapping in managed woodlands (parklands) of semi-arid West Africa using WorldView-2 imagery and geographic object based image analysis
[J].
DOI:10.3390/s141222643
URL
PMID:25460815
[本文引用: 1]
Detailed information on tree cover structure is critical for research and monitoring programs targeting African woodlands, including agroforestry parklands. High spatial resolution satellite imagery represents a potentially effective alternative to field-based surveys, but requires the development of accurate methods to automate information extraction. This study presents a method for tree crown mapping based on Geographic Object Based Image Analysis (GEOBIA) that use spectral and geometric information to detect and delineate individual tree crowns and crown clusters. The method was implemented on a WorldView-2 image acquired over the parklands of Saponé, Burkina Faso, and rigorously evaluated against field reference data. The overall detection rate was 85.4% for individual tree crowns and crown clusters, with lower accuracies in areas with high tree density and dense understory vegetation. The overall delineation error (expressed as the difference between area of delineated object and crown area measured in the field) was 45.6% for individual tree crowns and 61.5% for crown clusters. Delineation accuracies were higher for medium (35–100 m2) and large (≥100 m2) trees compared to small (lt;35 m2) trees. The results indicate potential of GEOBIA and WorldView-2 imagery for tree crown mapping in parkland landscapes and similar woodland areas.
SEATH-a new tool for automated feature extraction in the context of object-based image analysis
利用改进SEaTH算法的面向对象分类特征选择方法
[J].
Object-oriented feature selection algorithms based on improved SEaTH algorithms
[J].
A procedure for automatic object-based classification
[J].
DOI:10.1007/978-3-540-77058-9_9
URL
[本文引用: 2]
Abstract A human observer can easily categorize an image into classes of interest but it is generally difficult to reproduce the same result using a computer. The emerging object-based methodology for image classification appears to be a better way to mimic the human thought process. Unlike pixel-based techniques which only use the layer pixel values, the object-based techniques can also use shape and context information of a scene texture. These extra degrees of freedom provided by the objects will aid the identification (or classification) of visible textures. However, the concept of image-objects brings with it a large number of object features and thus a lot of information is associated with the objects. In this article, we present a procedure for object-based classification which effectively utilizes the huge information associated with the objects and automatically generates classification rules. The solution of automation depends on how we solve the problem of identifying the features that characterize the classes of interest and then finding the final distribution of the classes in the identified feature space. We try to illustrate the procedure applied for a two-class case and then suggest possible ways to extend the method for multiple classes.
Optimum index factor (OIF) for ASTER data:Examples from the Neoproterozoic Allaqi Suture,Egypt
