
0 引言
目前广泛使用的星载微波辐射计有DSMP(defense meteorological satellite program)卫星上搭载的SSM/I(special sensor microwave/imager)、EOS/Aqua卫星上的AMSR-E(advanced microwave scanning radiometer - earth observing system)、Coriolis卫星上的WindSat、风云三号卫星(FY-3)上的MWRI(microwave radiation imager)以及GCOM-W1卫星上的AMSR-2(advanced microwave scanning radiometer-earth observation system-2)等,如此众多的先进微波辐射计为协同热红外遥感反演地表温度研究提供了可能[5,6,7,8,9]。
然而,在星载微波资料的使用过程中,仍然存在着诸如对微波穿透深度考虑不足、低频微波的无线电频率干扰(radio-frequency interference,RFI)、地表温度与发射率的分离等问题[2,3,4]。星载被动微波辐射计的RFI是指辐射计接收到的辐射信息除了来自地气系统的自然热辐射以外,还有一部分则来自于地面主动微波发射器发出的辐射信息以及陆面反射的来自于其他辐射源的辐射信号。目前广泛使用的星载微波辐射计均不同程度地受到地面无线电频率的干扰,且受到干扰较为严重的资料大部分来自于微波低频观测通道。受到干扰的被动微波辐射计测量值往往存在较大的地表和大气参数反演误差,如果不能准确地识别和剔除,这种影响产生的问题可能显著降低现有以及将来的被动微波资料的使用效果。
Li等[10]最初于2004年发现AMSR-E在C和X波段的观测值在某些区域均出现大面积的频率干扰信号,提出了用频谱差法来检测RFI的强度和范围的观点,随后进一步提出了用主成分分析法(principal component analysis,PCA)来分析陆地区域的RFI分布特征[11]; Njoku等[12]指出了AMSR-E在6.925 GHz和10.67 GHz通道受RFI影响的区域分别处于不同的地理位置; Lacava等[13]用多时相法分析了AMSR-E C波段中的RFI。国内也正陆续开展对星载被动微波观测仪器受地面RFI的研究[14,15,16,17,18,19]。Wu等[14,15]提出了AMSR-E中RFI信号的检测及订正算法; Zou等[16]用PCA方法分析了MWRI陆地表面的RFI分布; Zhao等[17]改进了PCA方法,用双主成分分析法(double principal component analysis,DPCA)分析了WindSat资料在格陵兰等地区的RFI分布; 官莉和张思勃[18,19]对欧洲和北美洲陆地区域AMSR-E中的RFI进行了识别和分析。
但目前在有效地检测出MWRI资料中的RFI[16]以后,尚未进行对订正算法及提高地表参数反演精度的探讨。针对此问题,以欧洲大陆为主要研究区域,运用一维变分反演法(one dimensional variational retrieval,1D-VAR)收敛度量识别出MWRI一级亮温资料中的RFI,进而提出了一种订正受到RFI影响的MWRI亮温数据的算法,并对比分析了RFI订正前、后地表温度的反演结果,初步探讨了进行微波亮温数据的RFI订正对提高反演精度的重要性。
1 数据源
本文选用FY-3B卫星上的MWRI一级亮温资料。MWRI提供5个频率(10.65 GHz,18.7 GHz,23.8 GHz,36.5 GHz和89.0 GHz)、水平和垂直双极化共10个通道的微波观测值。使用1D-VAR反演算法需要从美国国家环境预报中心(National Centers for Environmental Prediction,NCEP)全球资料同化系统(global data assimilation system,GDAS)的客观分析场中提取相关参数作为反演的背景场。GDAS系统每天生成4个时次(00UTC,06UTC,12UTC和18UTC)、水平空间分辨率为1°×1°的大气和地表参数场。
2 1D-VAR算法
基于卫星微波和红外观测资料,采用1D-VAR法不仅可以反演大气参数(如大气温、湿垂直廓线)和云参数(云量、云顶高度),还可以反演地表参数(如地表温度和地表发射率等)。1D-VAR反演的前提是观测场与背景场误差是无偏的、不相关的,且均满足高斯误差分布这些假定条件,通过对目标函数(称为代价函数)求最小化得到最小误差的分析场。这个代价函数J(X)一般可以写成[20]
式中:
1D-VAR产生的分析场
对所定义的代价函数求导,并使导数为0,即
可以得到
将式(4)用于迭代计算,直到
对于卫星反演地球物理参数而言,前向算子H就是前向模式,即辐射传输模式。本文采用通用辐射传输模式(community radiative transfer model,CRTM)作为1D-VAR中的前向模式。CRTM[21]由美国的卫星资料同化联合中心(Joint Center for Satellite Data Assimilation,JCSDA)开发,适用于各种天气条件,可以模拟所有微波频率下由冰晶、雪晶、雨滴、霰粒和云中液态水等产生的散射,并生成所有大气和地表参数相应的辐射值和辐射梯度(即雅可比矩阵)[20]。在变分计算过程中,反演所需的背景场可以从GDAS提供的大气参数垂直廓线(温度、湿度和云中液水含量等)和地表参数(地表温度、土壤湿度和植被覆盖度等)获取。1D-VAR计算可以得到大气和地表参数,本文主要讨论地表参数之一的地表温度。
3 RFI识别和订正算法
对于陆地表面,辐射计测得的微波辐射信息主要是地表的发射辐射[12],而冰雪覆盖区散射辐射所占比例较高。在非冰雪覆盖区,随着频率的增加,地表和植被的散射效应逐渐增强,当辐射计通道频率低于30 GHz时,所接收到的来自于地表的散射辐射非常有限,通常可以忽略。而由地面主动微波传感器的发射信号或陆面反射辐射信号往往强于地表本身发出的辐射,使得星载被动微波传感器接收的信息是这些信号与地表自身发出辐射的叠加,从而不能真实反映地表状况,所以这些信号被称为RFI。受RFI影响的微波观测值通常表现为被污染通道观测亮温值异常偏大,在空间分布上呈现不连续且有一定方向性、时间上有持续性的特点。若RFI强度较大,甚至可能使通道亮温值呈负频谱梯度关系,即与正常的自然发射辐射谱规律相反。
本文研究的受RFI影响的MWRI一级亮温数据,主要出现在10.65 GHz水平和垂直极化的2个通道,大部分分布在东亚、欧洲等地[16],这是由当地人为主动源的工作频率所决定的。
在1D-VAR计算地表温度中,收敛度量
反演过程中发现,1D-VAR算法中的收敛度量值和RFI信号的强弱有着极强的相关性,收敛度量值越大,意味着该处的RFI信号越强[15]。
迄今为止,人们已发现不是所有的通道都会出现RFI,而且可以利用自然通道的相关性开发出订正算法去订正存在RFI的这些地区的异常观测值。RFI指数[14]不仅可以用来识别RFI的位置,也能量化地检测其强度,即一种极化的RFI定义为
式中: TB为卫星所测得的亮温值; p为极化方式(水平方向(H)或垂直方向(V));
在本研究中,提出了一个用于订正受到RFI影响的MWRI亮温数据的算法。算法的基本思想是,由于18.7 GHz的测量值几乎没有受到干扰,因而当检测到10.65 GHz存在RFI时,根据经验公式,受干扰的10.65 GHz的MWRI测量值可以用18.7 GHz的测量值估算出来。
对于MWRI观测值,RFI指数大于5 K[22]就定义为受到RFI影响。剔除受到干扰的亮温数据,用未受到干扰作用的训练数据回归得出RFI订正算法。由于二次项在降低订正算法的偏差和标准差方面并没有显著改进,因此使用线性回归,由未受到干扰的通道来估算受到RFI作用的通道的亮温,即
其中,式(7)和式(8)的标准差分别为1.433 89和1.323 97。
4 结果与分析
图1
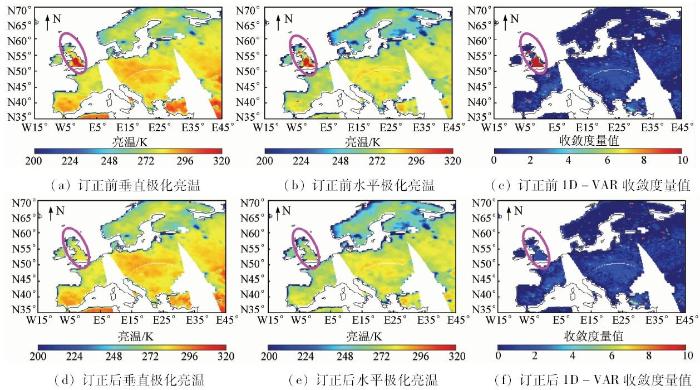
图1
2014年7月20日MWRI RFI订正前、后10.65 GHz亮温值和1D-VAR收敛度量值分布(升轨)
Fig.1
Comparison of brightness temperatures at 10.65 GHz and convergence metric distributions between those with and without RFI correction based on the MWRI data on 20th July 2014 for ascending orbits
图2
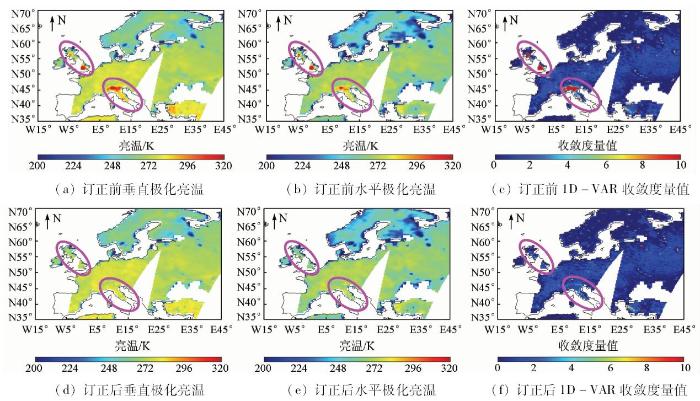
图2
2014年7月20日MWRI RFI订正前、后10.65GHz亮温值和1D-VAR收敛度量值分布(降轨)
Fig.2
Comparison of brightness temperatures at 10.65GHz and convergence metric distributions between those with and without RFI correction based on the MWRI data on 20th July 2014 for descending orbits
从NCEP GDAS再分析场中提取大气和地表参数作为1D-VAR计算中的背景场,本文研究区域内2014年7月20日地表温度的反演结果如图3所示。
图3
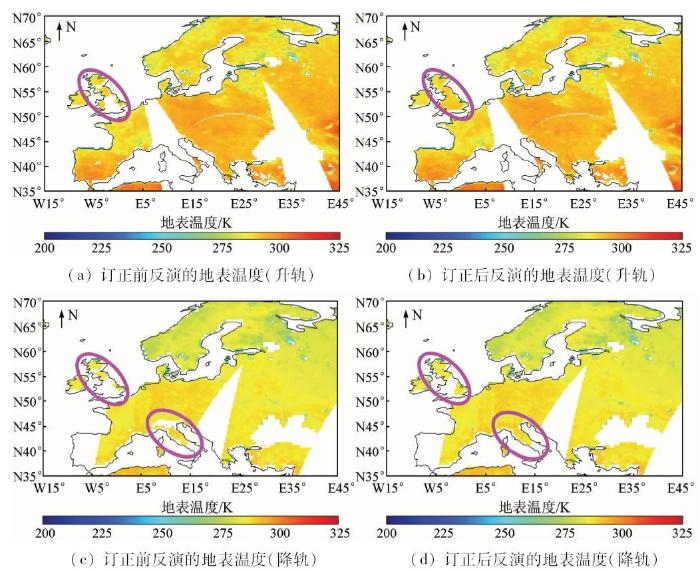
图3
2014年7月20日MWRI RFI订正前、后反演的地表温度
Fig.3
Retrieved land surface temperatures with MWRI observations on July 20th,2014
图3(a)和(c)分别为未经RFI 订正反演出的升轨和降轨地表温度分布。在图中均出现了呈孤立点状分布的反演值偏高的散点区域,甚至出现了较大范围连续的反演值缺失的区域(图3(a)和(c) 中圈出的空白区域)。通常情况下,地表状况差异不大的陆地表面,地表温度往往遵循连续性分布的规律,而不会出现不连续的零星突增的极高值区域。再对比图1(c)和图2(c)中1D-VAR收敛度量值分析法识别出的RFI区域,这些区域与检测出的RFI存在的位置有着很好的对应关系。这些零星的地表温度反演偏高值像素点恰恰对应于强度中等的RFI存在区域,而图3(a)和(c)中圈出的无反演结果的空白区域恰恰对应着RFI强度更大的区域。这是由于强度较大的RFI致使该位置的卫星测量值严重偏离地表的自然辐射值,使得变分反演时代价函数不收敛,从而得不到反演结果。
因此,如果对存在RFI的数据进行检测并进一步订正,将会大大提高地表温度反演的精度。而经式(7)和式(8)的算法订正后,反演的地表温度分布更连续(图3(b)和(d)),异常的反演偏高值得到了校正,不收敛的空白区域反演结果得到了恢复。从地表温度的分布特点来看,RFI订正后提高了反演结果的可靠性,也提高了MWRI亮温数据的利用率,减少了反演失败区域。
为了验证反演结果的可靠性,把空间分辨率为1°×1°的NCEP FNL全球分析资料(final operational global analysis data) 再分析场中的地表温度作为“真值”,计算反演值和真值间的偏差。计算结果表明,RFI订正前反演地表温度的平均误差为3.72 K,标准差为6.34 K; 经RFI订正后平均误差减少为3.05 K,标准差减少为5.64 K。对比结果可见,对MWRI的RFI检测、订正可以显著改善地表温度的反演精度。但是就该个例而言,计算出的标准差较大,可能有多种因素产生。首先,卫星观测时间和地表温度“真值”时间不完全吻合,在该研究中由于MWRI在欧洲陆地区的升轨观测时间大致是从11UTC—13UTC,因此作为“真值”资料选取的时次为当天4个时次中最为接近的12UTC; 降轨观测时间在02UTC—04UTC之间,因此选取时间最为接近的00UTC的资料; 其次,空间不完全匹配,“真值”的空间分辨率为1°×1°的格点数据,需要内插到卫星观测像素点的地理位置上,这同样也会造成一定的误差。
5 结论
1)基于MWRI观测数据,使用1D-VAR法识别出欧洲陆地地区的RFI分布及强度,提出了一种订正MWRI 10.65 GHz通道RFI的算法。该RFI订正算法基于几乎未受到RFI影响的18.7 GHz的测量值,根据各通道亮温值之间的高相关性,用不含有RFI信号的MWRI数据推导出了2个回归方程(分别对应水平和垂直极化)。这样,在用1D-VAR法识别出RFI以后,就可以通过18.7 GHz通道上的观测亮温估算出受RFI污染的10.65 GHz通道的亮温值。1D-VAR收敛度量值识别、分析RFI的方法和基于线性回归的RFI 订正方法对存在类似RFI信号的其他星载微波辐射计也是相通的,但具体的订正算法会因具体仪器设备的差异而有所不同。
2)对比经RFI识别和订正前、后的MWRI观测资料反演地表温度的结果表明,RFI信号的存在显著增大了受污染的亮温数据的反演误差,甚至造成反演结果缺失,很大程度上降低了反演的精度和星载微波资料的利用率。而本文提出的RFI订正算法可以有效地减弱MWRI 低频通道受到干扰的影响,显著提高RFI存在区域地表温度的反演精度。由此可见,正确识别和剔除日益严重的RFI信号对低频微波观测资料反演地表参数尤为重要,也是卫星资料同化之前必不可少的重要步骤。随着RFI影响的缓解,更多受RFI污染的MWRI观测值将有待用于地表温度反演。
3)今后若能依赖于区域或背景,调整算法中的参数,可以降低区分合理的较高值和受到污染的较高值这个难点对订正效果的影响。对于强度弱、不易被检测出的RFI,可以考虑把研究区域缩小,甚至可以结合具体地表状况等信息,调整检测阈值或算法中的参数,从而降低订正结果的标准差。
参考文献
冻土遥感研究进展:被动微波遥感
[J].
Overview of the satellite remote sensing of frozen ground:Passive microwave sensors
[J].
微波遥感地表参数反演进展
[J].
Progresses on microwave remote sensing of land surface parameters
[J].
地表温度的被动微波遥感反演研究进展
[J].
Progress of land surface temperature retrieval based on passive microwave remote sensing
[J].
基于被动微波的地表温度反演研究综述
[J].
A survey of surface temperature retrieval by passive microwave remote sensing
[J].
一个针对被动微波数据AMSR-E数据反演地表温度的物理统计算法
[J].
A physics-based statistical algorithm for retrieving land surface temperature from AMSR-E passive microwave data
[J].
模拟AMSR-E数据的地表多参数反演
[J].为了提供更适用的地表参数反演 方案,对Njoku等模拟AMSRE-E数据的多参数反演工作重新进行正向模拟和算法改进,算法用MATLAB开发实现。反演结果表明,改进后的反演方法 不仅在精度上略高于原方法,而且还能反演裸露地表可实际测量的粗糙度参数,并在更大的植被含水量范围内达到较高的反演精度。
Multiple surface parameters retrieval of simulated AMSR-E data
[J].
基于FY-2C数据的地表温度反演验证——以黄河源区玛曲为例
[J].Land surface temperature (LST) is an essential parameter in such fields of research as climate, hydrology and ecology, and it plays a significant role in the understanding of the water and energy balance of the Earth's surface. Because the heterogeneity of the underlying surface is most likely a main source of the uncertainties of the satellite derived LST, this paper aims to evaluate the accuracy of the FY-2C derived LST over the heterogeneous area of Maqu County in the source region of the Yellow River and subsequently to provide solid basis for the future development of the LST inversion algorithm and product. MODIS LST product (MOD11B1) was primarily conducted to verify the FY-2C derived LST over the study area. In addition to the MODIS data, soil temperature measurements from 20 soil samples of the study area were also implemented to validate the FY-2C derived LST. The results indicate that a significant correlation exists between the two datasets, with the coefficient of correlation, varying from 0.72 to 0.95, root mean square error(RMSE) ranging from 0.44 to 3.87 K, and the average RMSE being 1.90 K. The FY-2C derived LST exhibits a consistent variation with the measured soil temperature, and the coefficient of correlation reaches 0.69.
Validation of FY-2C derived land surface temperature over the source region of the Yellow River:A case study of Maqu County
[J].
北京市1989—2010年地表温度时空分异特征分析
[J].以3S技术为支持,采用TM数据、应用单窗算法对1989-2010年间北京市五环内地表温度( land surface temperature,LST)进行反演,并采用同步的MODIS 温度产品对反演结果进行对比验证。在此基础上,利用距平值分析和剖面线分析等方法揭示了20多a来北京市地表温度的时空分异总体特征;基于归一化水汽指数( normalized difference moisture index,NDMI)和归一化建筑指数( normalized difference building index,NDBI)分析了研究区内地表温度的时空变化特征,定量揭示并阐述了地表温度和NDMI及NDBI的相关关系。研究结果表明:反演温度可较为真实地反映研究区地表热量的空间差异;北京地表温度时空变化特征明显,同一时段、不同土地覆盖类型的地表温度差异较为显著,热岛效应明显;地表温度和NDBI呈显著的正相关,与NDMI则呈显著的负相关,NDMI和NDBI在表征地表热特征方面均是较好的指标。该结果为监测北京地表温度变化及其时空分布特征提供了依据。
A temporal-spatial variation analysis of land surface temperature in Beijing
[J].
用被动微波AMSR数据反演地表温度及发射率的方法研究
[J].针对对地观测卫星多传感器的特点,提出了借助MOD IS地表温度产品从被动微波数据中反演地表温度的方法。即利用MOD IS地表温度产品和AMSR不同通道之间的亮度温度,建立地表温度的反演方程。该方法克服了以往需要测量同步数据的困难,为不同传感器之间的参数反演相互校正和综合利用多传感器的数据提供实际应用和理论依据。文中以MOD IS地表温度产品作为评价标准,对方法进行检验,其平均误差为2~3℃。另外,微波的发射率是土壤水分反演的关键参数,在对微波地表温度反演的基础上,进一步对发射率进行了研究。
The land surface temperature and emissivity retrieved from the AMSR passive microwave data
[J].
A preliminary survey of radio-frequency interference over the U.S. in Aqua AMSR-E data
[J].
DOI:10.1109/TGRS.2003.817195
URL
[本文引用: 1]

ABSTRACT A spectral difference method is used to quantify the magnitude and extent of radio-frequency interference (RFI) observed over the United States in the Aqua AMSR-E radiometer channels. A survey using data from the AMSR-E instrument launched in May 2002 shows the interference to be widespread in the C-band (6.9 GHz) channels. The RFI is located mostly, but not always, near large highly populated urban areas. The locations of interference are persistent in time, but the magnitudes show temporal and directional variability. Strong and moderate RFI can be identified relatively easily using an RFI index derived from the spectral difference between the 6.9- and 10.7-GHz channels. Weak RFI is difficult to distinguish, however, from natural geophysical variability. These findings have implications for future microwave sensing at C-band, particularly over land areas. An innovative concept for radiometer system design is also discussed as a possible mitigation approach.
WindSat radio-frequency interference signature and its identification over land and ocean
[J].
DOI:10.1109/TGRS.2005.862503
URL
[本文引用: 1]
Radio-frequency interference (RFI) in the spaceborne multichannel radiometer data of WindSat and the Advanced Microwave Scanning Radiometer-EOS is currently being detected using a spectral difference technique. Such a technique does not explicitly utilize multichannel correlations of radiometer data, which are key information in separating RFI from natural radiations. Furthermore, it is not optimal for radiometer data observed over ocean regions due to the inherent large natural variability of spectral difference over ocean. In this paper, we first analyzed multivariate WindSat and Scanning Multichannel Microwave Radiometer (SMMR) data in terms of channel correlation, information content, and principal components of WindSat and SMMR data. Then two methods based on channel correlation were developed for RFI detection over land and ocean. Over land, we extended the spectral difference technique using principal component analysis (PCA) of RFI indices, which integrates statistics of target emission/scattering characteristics (through RFI indices) and multivariate correlation of radiometer data into a single statistical framework of PCA. Over ocean, channel regression of X-band can account for nearly all of the natural variations in the WindSat data. Therefore, we use a channel regression-based model difference technique to directly predict RFI-free brightness temperature, and therefore RFI intensity. Although model difference technique is most desirable, it is more difficult to apply over land due to heterogeneity of land surfaces. Both methods improve our knowledge of RFI signatures in terms of channel correlations and explore potential RFI mitigation, and thus provide risk reductions for future satellite passive microwave missions such as the NPOESS Conical Scanning Microwave Imager/Sounder. The new RFI algorithms are effective in detecting RFI in the C- and X-band Windsat radiometer channels over land and ocean.
Global survey and statistics of radio-frequency interference in AMSR-E land observations
[J].
DOI:10.1109/TGRS.2004.837507
URL
[本文引用: 2]
Radio-frequency interference (RFI) is an increasingly serious problem for passive and active microwave sensing of the Earth. To satisfy their measurement objectives, many spaceborne passive sensors must operate in unprotected bands, and future sensors may also need to operate in unprotected bands. Data from these sensors are likely to be increasingly contaminated by RFI as the spectrum becomes more crowded. In a previous paper we reported on a preliminary investigation of RFI observed over the United States in the 6.9-GHz channels of the Advanced Microwave Scanning Radiometer (AMSR-E) on the Earth Observing System Aqua satellite. Here, we extend the analysis to an investigation of RFI in the 6.9- and 10.7-GHz AMSR-E channels over the global land domain and for a one-year observation period. The spatial and temporal characteristics of the RFI are examined by the use of spectral indices. The observed RFI at 6.9 GHz is most densely concentrated in the United States, Japan, and the Middle East, and is sparser in Europe, while at 10.7 GHz the RFI is concentrated mostly in England, Italy, and Japan. Classification of RFI using means and standard deviations of the spectral indices is effective in identifying strong RFI. In many cases, however, it is difficult, using these indices, to distinguish weak RFI from natural geophysical variability. Geophysical retrievals using RFI-filtered data may therefore contain residual errors due to weak RFI. More robust radiometer designs and continued efforts to protect spectrum allocations will be needed in future to ensure the viability of spaceborne passive microwave sensing.
A multitemporal investigation of AMSR-E C-band radio-frequency interference
[J].
DOI:10.1109/TGRS.2012.2228487
URL
[本文引用: 1]
Radio-frequency interference (RFI) is increasingly a severe problem for present and future microwave satellite missions. RFI at C- and X-bands can contaminate remotely sensed measurements, as experienced with the Advanced Microwave Scanning Radiometer (AMSR-E) and the WindSat sensor. In this work, the multitemporal Robust Satellite Techniques approach has been implemented on C-band AMSR-E data in order to identify areas systematically affected by different levels of RFI, trying to discriminate them from natural geophysical variability zones. To the scope, nine years of AMSR-E data have been investigated, allowing us also to better infer RFI impact on data acquired during ascending or descending passes, as well as in horizontal or vertical polarization. In detail, two analyses were carried out: one considering only measurements at C-band and another one taking into account a combination between C- and X-band measurements. The results of this study will be shown and discussed in this paper.
Detection and correction of AMSR-E radio-frequency interference
[J].
DOI:10.1007/s13351-011-0510-0
URL
[本文引用: 3]
Radio-frequency interference (RFI) affects greatly the quality of the data and retrieval products from space-borne microwave radiometry. Analysis of the Advanced Microwave Scanning Radiometer on the Earth Observing System (AMSR-E) Aqua satellite observations reveals very strong and widespread RFI contaminations on the C- and X-band data. Fortunately, the strong and moderate RFI signals can be easily identified using an index on observed brightness temperature spectrum. It is the weak RFI that is difficult to be separated from the nature surface emission. In this study, a new algorithm is proposed for RFI detection and correction. The simulated brightness temperature is used as a background signal ( B ) and a departure of the observation from the background ( O-B ) is utilized for detection of RFI. It is found that the O-B departure can result from either a natural event (e.g., precipitation or flooding) or an RFI signal. A separation between the nature event and RFI is further realized based on the scattering index (SI). A positive SI index and low brightness temperatures at high frequencies indicate precipitation. In the RFI correction, a relationship between AMSR-E measurements at 10.65 GHz and those at 18.7 or 6.925 GHz is first developed using the AMSR-E training data sets under RFI-free conditions. Contamination of AMSR-E measurements at 10.65 GHz is then predicted from the RFI-free measurements at 18.7 or 6.925 GHz using this relationship. It is shown that AMSR-E measurements with the RFI-correction algorithm have better agreement with simulations in a variety of surface conditions.
Applications of an AMSR-E RFI detection and correction algorithm in 1D-VAR over land
[J].DOI:10.1007/s13351-014-3075-x URL [本文引用: 3]
Detection of radio-frequency interference signal over land from FY-3B microwave radiation imager(MWRI)
[J].
DOI:10.1109/TGRS.2012.2191792
URL
[本文引用: 4]
The MicroWave Radiation Imager(MWRI) onboard the FengYun(FY)-3B satellite has five frequencies at 10.65,18.7,23.8,36.5,and 89.0 GHz,each having dual channels at vertical and horizontal polarization states,respectively.It is found that radiofrequency interference(RFI) is present in MWRI data over land.The RFI signals are,in general,detectable from a spectral difference method and a principal component analysis(PCA) method.In particular,the PCA method is applied to derive RFI signals from natural radiations by using the characteristics of natural radiation measurements having all-channel correlations.In the area where data have a higher projection onto the first principle component(PC) mode,RFI is,in general,present.However,both the spectral and PCA methods cannot detect RFI reliably over frozen grounds and scattering surfaces,where the brightness temperature difference between 10.65 and 18.7 GHz is large.Thus,detection is improved through the use of normalized PCA.The new RFI detection algorithm is now working reliably for MWRI applications.It is found that RFI at 10.65 GHz distributes widely over Europe and Japan,and is less popular over the United States and China.
WindSat radio-frequency interference signature and its identification over Greenland and Antarctic
[J].
DOI:10.1109/TGRS.2012.2230634
URL
[本文引用: 2]
A detection of radio-frequency interference (RFI) in the space-borne microwave radiometer data is difficult under snow and sea ice-covered conditions. The existing methods such as a spectral difference technique or a principal component analysis (PCA) of RFI indices produce many false RFI signals near the boundary of Greenland and Antarctic ice sheets. In this paper, a double PCA (DPCA) method is developed for RFI detection over Greenland and Antarctic regions. It is shown that the new DPCA method is effective in detecting RFI signals in the C- and X-band radiometer channels of WindSat while removing the false RFI signals over Greenland and Antarctic. It also worked well in other snow-free or snow-rich regions such as winter data over the United States. The proposed DPCA can be applied to satellite radiometer data orbit-by-orbit or granule-by-granule and is thus applicable in an operational environment for fast processing and data dissemination.
星载微波辐射计欧洲大陆无线电频率干扰分析
[J].
DOI:10.3788/aos201434.0728004
URL
[本文引用: 2]
基于2011年6月1日至16日先进微波扫描辐射计(AMSR-E)的观测资料,采用改进的主成分分析算法,对欧洲陆地区域的无线电频率干扰(RFI)进行识别和分析。研究发现影响英国和意大利的X波段RFI源主要是稳定的、持续的地面主动源,而影响欧洲其他国家的RFI则主要是反射的静止电视卫星信号对星载微波被动传感器观测的干扰。源于静止电视卫星的RFI出现位置和强度随时间周期性变化,在欧洲陆地多出现在星载微波辐射计升轨观测上,降轨观测则几乎不受其干扰。RFI出现位置和强度与星载微波辐射计扫描方位角和观测视场相对静止电视卫星的方位有关,只有当星载微波辐射计视场扫描方位角大小与该视场相当于静止卫星发射方位角大小接近时该视场易受RFI影响。
Source analysis of radio-frequency interference over Europe land from advanced microwave scanning radiometer-E
[J].
AMSR-E观测资料干扰对反演地表参数的影响
[J].There are spread radio-frequency interference (RFI) problems of the low-frequency observations of the spaceborne microwave imagers, e.g. AMSR-E (Advanced Microwave Scanning Radiometer). A modified principal component analysis method was used to identify RFI and then its influence on the retrieval of surface parameters was studied. Next, the AMSR-E data corrected by linear fitting correction of RFI were used to retrieve the surface parameters through 1D-Var method. By comparing the retrieved products (e.g., land surface temperature and surface rainfall rate) before and after RFI correction over the United States, it was found that retrieved land surface temperature and surface rainfall rate which were interfered by RFI were abnormally high and with large deviations. Therefore, it was necessary to effectively identify and correct RFI prior to low-frequency observations with spaceborne microwave imagers to retrieve land surface parameters or assimilate these observations. And the modified principal component analyzing RFI identification method and linear fitting RFI correction algorithm were effective for the observations over land.
Effect of AMSR-E data interference on the retrieval of land surface parameters
.[J].
MiRS:An all-weather 1DVAR satellite data assimilation and retrieval system
[J].
DOI:10.1109/TGRS.2011.2158438
URL
[本文引用: 2]
A 1-D variational system has been developed to process spaceborne measurements. It is an iterative physical inversion system that finds a consistent geophysical solution to fit all radiometric measurements simultaneously. One of the particularities of the system is its applicability in cloudy and precipitating conditions. Although valid, in principle, for all sensors for which the radiative transfer model applies, it has only been tested for passive microwave sensors to date. The Microwave Integrated Retrieval System (MiRS) inverts the radiative transfer equation by finding radiometrically appropriate profiles of temperature, moisture, liquid cloud, and hydrometeors, as well as the surface emissivity spectrum and skin temperature. The inclusion of the emissivity spectrum in the state vector makes the system applicable globally, with the only differences between land, ocean, sea ice, and snow backgrounds residing in the covariance matrix chosen to spectrally constrain the emissivity. Similarly, the inclusion of the cloud and hydrometeor parameters within the inverted state vector makes the assimilation/inversion of cloudy and rainy radiances possible, and therefore, it provides an all-weather capability to the system. Furthermore, MiRS is highly flexible, and it could be used as a retrieval tool (independent of numerical weather prediction) or as an assimilation system when combined with a forecast field used as a first guess and/or background. In the MiRS, the fundamental products are inverted first and then are interpreted into secondary or derived products such as sea ice concentration, snow water equivalent (based on the retrieved emissivity) rainfall rate, total precipitable water, integrated cloud liquid amount, and ice water path (based on the retrieved atmospheric and hydrometeor products). The MiRS system was implemented operationally at the U.S. National Oceanic and Atmospheric Administration (NOAA) in 2007 for the NOAA-18 satellite. Since then, it has been extended to run for NOAA-19, Metop-A, and DMSP-F16 and F18 SSMI/S. This paper gives an overview of the system and presents brief results of the assessment effort for all fundamental and derived products.
JCSDA community radiative transfer model (CRTM)
The FengYun-3 microwave radiation imager on-orbit verication
[J].
DOI:10.1109/TGRS.2011.2148200
URL
[本文引用: 1]
Microwave Radiation Imager (MWRI) onboard the FengYun (FY)-3A satellite observes the Earth atmosphere at 10.65, 18.7, 23.8, 36.5 and 89.0 GHz with each having dual polarization. Its calibration system is uniquely designed with its main reflector viewing both cold and hot calibration targets. Two quasi-optical reflectors are used to reflect the radiation from hot load and cold space to the main reflector. However, some radiation loss in the beam transmission path must be taken into account in the calibration process. The loss factor in hot load transmission path is derived using the antenna pattern data measured on ground and satellite data observing over Amazon forest where the scene temperature is steady and close to hot target. The instrument non-linearity factors at different channels are also evaluated over a wide range of brightness temperatures and compared with the results from the ground vacuum test. After a cross-calibration with Windsat data, atmospheric products are derived from MWRI brightness temperatures and display reasonable accuracy and meet the overall requirements.
