

0 引言
火灾作为森林生态系统的重要扰动因素,显著地影响着植被的结构和组成[1]。林火多发生在边远、山势险峻、交通可达性低的地区,采用人工实地测算过火面积难度较大,因此遥感技术以其大面积同步观测的优点被广泛地应用于过火区识别与制图研究中。当前,新型传感器特别是我国国产高分系列卫星的陆续发射升空,适用于新型传感器的火烧迹地识别方法研究已成为当前火烧迹地识别的重点之一。
植被指数法是利用卫星遥感影像识别森林火烧迹地的一种常用方法。火灾使地表植被破坏,受灾植被在卫星影像不同波段的反射率发生变化,其光谱曲线与正常植被光谱曲线有明显差异,但与裸地、水体和阴影等地物的光谱曲线间的差异可能变小而产生混淆。大量研究表明,植被指数通过增强这种差异,能有效地用于过火区制图[2,3]。现有植被指数的种类很多,其中归一化植被指数(normalized difference vegetation index,NDVI)、增强型植被指数 (enhanced vegetation index,EVI)、全球环境监测植被指数(global environment monitoring index,GEMI)、过火区识别指数(burned area index,BAI)和归一化火烧指数(normalized burn ration,NBR)等5种植被指数常被用于火烧迹地识别。Veraverbeke等[4]应用MODIS/ASTER构建了不同的植被指数,并评估了各植被指数对过火区的分离能力; Carriello等[5]和Chuvieco等[6]评估了ETM+各个波段对火灾前后地物变化的敏感性,并选用BAI增强过火区,取得了较好结果; 朱曦等[7]利用环境减灾小卫星星座数据评估了NDVI,BAI,EVI[8]和GEMI[9]等4种植被指数对过火区的分离性,发现BAI和GEMI分离性较好; Loboda等[10]基于NBR[11]创建了一种半自动识别方法,使用TM数据获取过火区验证精度较高; Bastarrika等[12]利用TM/ETM+数据采用加入短波红外波段的NBR和改进的过火区识别指数(improved burned area index,BAIM)构建的2阶段算法,显著降低了误判率。
高分一号(GF-1)卫星作为我国"十二五"民用高分专项对地观测系统的首发星,自2013年9月获取数据以来,以其高时间与高空间分辨率、多光谱和宽覆盖等特点被广泛地应用于农业、林业、国土资源和地质灾害等领域。
本文结合GF-1宽幅(wide field of view,WFV)和Landsat8数据的波谱特性,通过对常用的NDVI,EVI,GEMI,BAI和NBR等5种植被指数的分离性进行研究,来探求适用于这2种数据识别火烧迹地的最优植被指数,并采用分离性较好的植被指数对研究区的火烧迹地进行了识别,评价了典型植被指数识别火烧迹地的应用潜力。
1 研究区概况与数据源
1.1 研究区概况
表1 火烧迹地概况
Tab.1
| 编号 | 研究区 | 火烧时间 | 火场中心经纬度 | 火场中心位置海拔/m | 过火面积/hm2 |
|---|---|---|---|---|---|
| 1 | 陈巴尔虎旗火烧迹地 | 20170517 | 49°55'09"N,120°51'16"E | 925 | 8 400 |
| 2 | 鄂伦春自治旗火烧迹地 | 20170502 | 49°30'32"N,123°06'02"E | 500 | 11 500 |
| 3 | 雅江县火烧迹地 | 20140125 | 30°04'48"N,101°10'53"E | 3 800 | 32 |
| 4 | 冕宁县火烧迹地 | 20140214 | 28°33'36"N,102°13'12"E | 2 539 | 63 |
1.2 数据源及其预处理
采用的林区过火后遥感数据为GF-1 WFV,Landsat8和GF-2 数据。其中GF-1 WFV和GF-2数据从中国资源卫星应用中心网站下载,Landsat8数据从美国地质调查局网站下载。为保证研究的准确性和结果的可信度,选取影像数据质量较好的过火后最近一期影像开展研究。研究区遥感数据获取情况如表2所示。
表2 遥感数据获取情况
Tab.2
| 研究区 | GF-1WFV 获取时间 | Landsat8 获取时间 | GF-2 获取时间 |
|---|---|---|---|
| 陈巴尔虎旗火烧迹地 | 20170605 | 20170624 | — |
| 鄂伦春自治旗火烧迹地 | 20170605 | 20170509 | 20170613 |
| 雅江县火烧迹地 | 20170222 | 20140131 | — |
| 冕宁县火烧迹地 | 20140226 | 20140225 | — |
对GF-1 WFV和Landsat8数据分别进行了预处理,主要包括辐射定标、FLAASH大气校正、带参考影像的正射校正(以Landsat8影像为参考影像、全国30 m数据高程模型(digital elevation model,DEM)为参考DEM)和图像裁剪等。通过上述预处理,将遥感数据的DN值转换成反射率。GF-2数据包括全色和多光谱数据,分别对其进行正射校正(采用RPC进行正射校正,以全国30 m DEM数据为参考DEM),然后进行自动配准和图像融合,将多光谱数据的空间分辨率提高到1 m。融合后的GF-2数据用于火烧迹地识别结果的精度验证。
2 研究方法
2.1 典型地物光谱曲线
不同地物具有不同的光谱曲线,森林火灾中,植被的叶绿素和叶片细胞结构遭到破坏,这使火烧迹地上的过火植被不再具有正常植被特有的光谱特征,易与裸地、水体和阴影等混淆。本文使用预处理后的GF-1 WFV和Landsat8数据,采用目视解译的方式对4个研究区内的典型地物选取样本,每一类样本数在30个以上。使用这些样本提取典型地物在各个波段的反射率并求其平均值,汇总得到典型地物光谱曲线如图1所示。其中正常植被、火烧迹地、裸地和道路为4个火烧迹地研究区共同具有的地物类型,耕地从陈巴尔虎旗火烧迹地提取,山体阴影和雪从雅江县和冕宁县火烧迹地提取,云和云阴影从鄂伦春自治旗火烧迹地提取。
图1
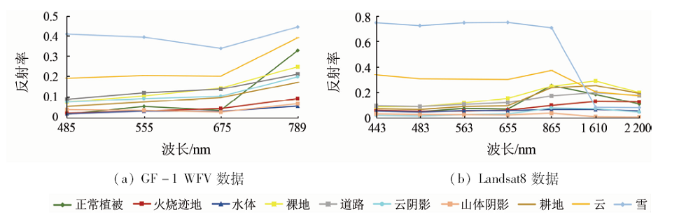
图1
GF-1 WFV和Landsat8影像典型地物光谱曲线
Fig.1
Spectral curves of typical features in GF-1 WFV and Landsat8 images
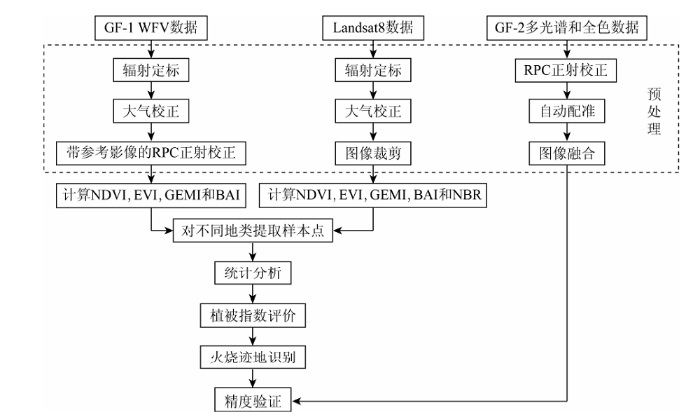
2.2 技术路线
分析评价NDVI,EVI,GEMI,BAI和NBR等5种典型植被指数识别火烧迹地应用潜力的技术路线如图2所示。
图2
2.2.1 植被指数
由于GF-1 WFV只有可见光和近红外波段,因此基于GF-1 WFV数据只计算了NDVI,EVI,GEMI和BAI; Landsat8数据具有短波红外波段,因此计算了全部5种指数。各指数的计算公式分别为
式中
采用不同地物样本提取不同地物的5种植被指数值并求其平均值,对比分析不同植被指数对火烧迹地与其他地物的区分度。
2.2.2 分离指数
式中:
3 结果与分析
3.1 火烧迹地及其他地物光谱分析
根据GF-1 WFV和Landsat8数据获取的典型地物光谱曲线,在可见光和近红外波段,GF-1 WFV数据获取的各地物的光谱曲线走势和Landsat8数据走势基本一致,但是各个波段的光谱反射率值不同,这可能与传感器、数据获取时间以及太阳高度角等因素有关。在可见光和近红外波段,雪和云的光谱反射率较高,与火烧迹地的区分度大,不易混淆; 正常植被的光谱反射率与火烧迹地反射率在可见光波段接近,但在近红外波段正常植被的反射率远大于火烧迹地反射率,可采用近红外波段构建的植被指数将火烧迹地与正常植被区分; 在可见光、近红外和短波红外波段,水体、山体阴影、云阴影、耕地、裸地和道路的光谱反射率值与火烧迹地光谱反射率值接近,但在光谱曲线走势上,水体、云阴影和山体阴影在短波红外2通道(SWIR1和SWIR2)光谱反射率均减小,裸地、耕地和道路在SWIR1波段上升,SWIR2波段减小,而火烧迹地光谱反射率在短波红外2个波段均上升,因此采用基于短波红外波段构建的植被指数可将火烧迹地与这些地物区分。
3.2 火烧迹地及其他地物植被指数分析
对GF-1 WFV和Landsat8数据4个火烧迹地研究区提取的典型地物的植被指数值进行统计分析,结果如图3所示。由于BAI的数值偏大,与其他植被指数值不在同一个数量级,因此对BAI进行归一化,将其除以所有地物BAI的最大值,使BAI的取值范围在01之间。
图3
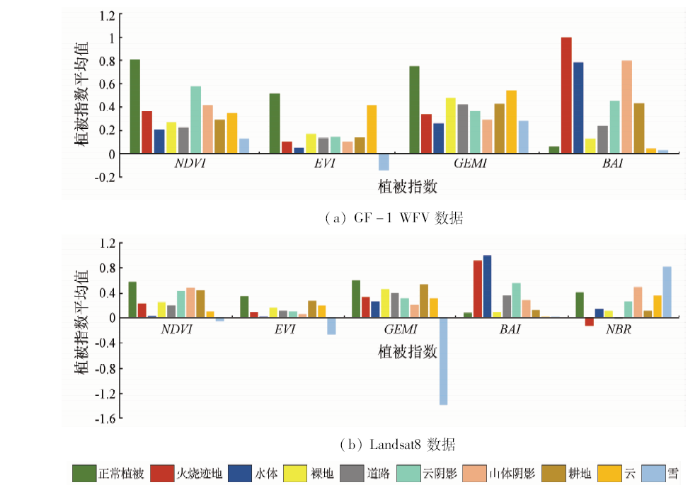
图3
GF-1 WFV和Landsat8数据提取典型地物植被指数值
Fig.3
Vegetation index values of typical features extracted by GF-1 WFV and Landsat8 data
从各地物的植被指数平均值上看,由GF-1 WFV和Landsat8数据得到的不同地物的NDVI,EVI,GEMI和BAI 4种植被指数的大小关系基本一致。而NDVI,EVI和GEMI 3种植被指数对植被信息敏感,正常植被的这些指数值都最高,山体阴影和云阴影由于含有少量植被信息,因此其指数值也相对较高,易与火烧迹地区分; 云、雪、水体、裸地、道路、耕地与刚燃烧后的火烧迹地相似,所含植被信息均不明显,采用这3种指数不能很好地分离出过火区。BAI描述的各地物植被指数值的大小关系与NDVI,EVI和GEMI描述的基本相反; 其中火烧迹地的BAI值偏大,水体和山体阴影的BAI值也较大,容易造成混分,正常植被及其他地物的BAI值均较小,区分度较大。从植被指数值上看,火烧迹地的NBR为负值,而其他地物的NBR均为正值,因此NBR对火烧迹地的区分度最好。
对Landsat8得到的4个火烧迹地典型地物植被指数平均值进行对比分析,在基于可见光—近红外构建的植被指数中,相比于NDVI,EVI和GEMI,BAI除了容易与水体混淆外,对其他各地物的区分度都较高; 基于近红外—短波红外波段构建的NBR对火烧迹地的区分度也很好,除陈巴尔虎旗NBR>1之外,其他3处火烧迹地的NBR值均为负值,而其他地物NBR值均为正值。陈巴尔虎旗火烧程度较轻,且只能获取到火灾30 d后的Landsat8数据,由于火烧迹地内草灌等植被恢复生长较快,造成计算出的火烧迹地的NBR值为正值,且大于耕地的NBR值,以及火烧迹地的BAI值小于耕地的BAI值。
3.3 火烧迹地及其他地物分离指数分析
统计火烧迹地和其他地物样本植被指数的平均值和方差,计算分离指数M,基于GF-1 WFV和Landsat8数据分析评价各地物植被指数的分离性,并针对不同数据选取火烧迹地识别的最优植被指数。GF-1 WFV和Landsat8数据提取的火烧迹地与其他地物分离指数M如图4所示。
图4
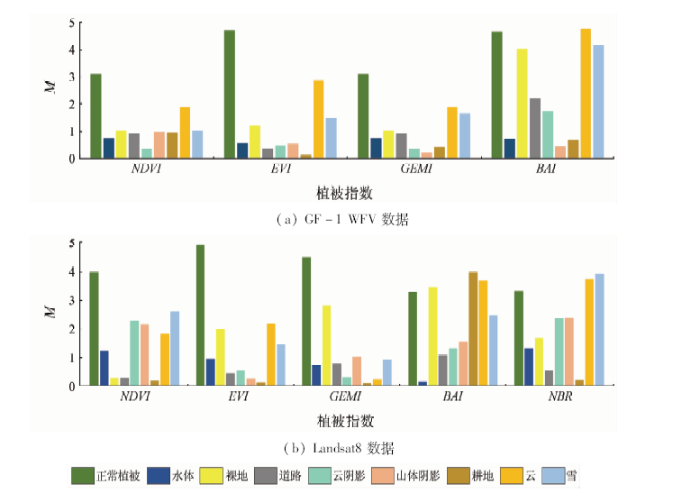
图4
GF-1 WFV和Landsat8数据提取典型地物分离指数M
Fig.4
Separability index M of typical features extracted by GF-1 WFV and Landsat8 data
从各地物的M上看,云、雪和正常植被与火烧迹地的分离度较高,采用上述任一种植被指数都能将其与火烧迹地区分开; 水体、道路、耕地、山体阴影、云阴影和裸地等地物与火烧迹地的分离性较差,需要选取合适的植被指数进行区分。就植被指数分离能力而言,基于过火后GF-1 WFV和Landsat8数据提取的火烧迹地与其他地物分离指数M虽数值不同,但各植被指数对火烧迹地和其他地物的分离能力表现的规律基本一致。在选取的由可见光—近红外波段构建的4种植被指数中,BAI能更好地将火烧迹地与其他地物进行分离,NDVI的分离能力次之,EVI和GEMI分离过火区的能力较差; 而选取的基于近红外—短波红外波段构建的NBR与BAI类似,同样具有很好的分离过火区的能力。
3.4 精度验证
GF-2遥感影像数据融合后的空间分辨率为1 m,采用目视解译方法能很好地区分过火区和未过火区。但由于GF-2卫星是在2014年8月发射并获得数据,而雅江县和冕宁县的森林火灾发生时间分别为2014年1月和2月,因而没有与火灾时间相近的GF-2数据可用于验证; 而陈巴尔虎旗火烧迹地(火灾时间2017年5月)可获得到的GF-2数据在2017年9月,已在该区域火灾之后4个月,即当年植被生长旺盛期(7—9月初)。因此,本文仅选取鄂伦春自治旗火烧迹地进行了精度验证; 对GF-1 WFV数据采用BAI进行火烧迹地识别,对Landsat8数据分别采用NBR和BAI进行火烧迹地识别,其原始图像及识别结果如图5所示。使用GF-2数据采用随机选点的方式(研究区内随机选取300个样本点)结合混淆矩阵进行精度验证,得出2种方法火烧迹地识别的精度和Kappa系数,结果如表3所示。
图5
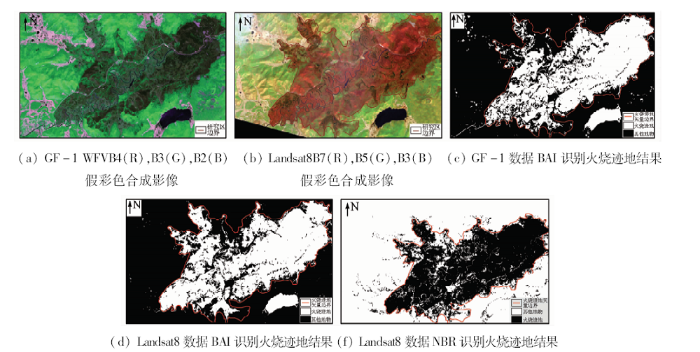
图5
鄂伦春自治旗研究区遥感影像及识别结果
Fig.5
Remote sensing images in study area and identification results of burned area
表3 精度评价结果
Tab.3
| GF-1 | Landsat8 | ||
|---|---|---|---|
| 评价指标 | BAI | NBR | BAI |
| 火烧区制图精度/% | 78.95 | 61.84 | 72.45 |
| 未火烧区制图精度/% | 96.59 | 96.92 | 94.55 |
| 火烧区用户精度/% | 91.46 | 92.68 | 86.59 |
| 未火烧区用户精度/% | 90.83 | 86.70 | 87.61 |
| 总体精度/% | 91.00 | 88.33 | 87.33 |
| Kappa系数 | 0.78 | 0.73 | 0.70 |
由表3的精度评价结果看出,采用NBR和BAI用于火烧迹地识别的总体精度都较高,均能达到87%以上; Kappa系数也均大于0.7,识别效果良好。
4 结论与展望
基于GF-1 WFV和Landsat8数据分析评价NDVI,EVI,GEMI,BAI和NBR等5种植被指数识别火烧迹地的潜力,对GF-1 WFV和Landsat8数据选取最优植被指数进行火烧迹地识别,并进行精度评价。其结论如下:
1)从各地物的光谱曲线上看,在近红外和短波红外波段火烧迹地与其他地物的反射率差别较大,因此采用基于近红外或短波红外波段构建的植被指数提取火烧迹地的结果会相对较好。
2)从植被指数平均值上看,基于近红外─短波红外波段构建的NBR对过火区的区分度最好,火烧迹地的NBR均为负值(火烧程度较轻的地区除外),其他地物为正值; BAI的区分度次之; NDVI,EVI和GEMI的区分度较差。
4)对具有短波红外波段的Landsat8数据,采用NBR识别火烧迹地的效果相对较好,其识别总体精度可达到88.33%,Kappa系数为0.73; 对仅具有可见光和近红外波段的GF-1 WFV数据,采用BAI识别火烧迹地的效果较好,其识别总体精度可达到91.00%,Kappa系数为0.78。
研究中陈巴尔虎旗火烧迹地的Landsat8数据的获取时间与火灾时间相差30 d之久,对研究结果造成一定的影响。下一步考虑采用多源数据开展研究。文中典型地物的反射率、植被指数值的平均值和分离指数M是从4个火烧迹地提取汇总得到的,因此可能会因火灾时间、影像获取时间、地物所在海拔和纬度等因素的不同而对结果造成一定影响。另外,如何将NBR和BAI等增强地物信息的植被指数与图像分类法相结合以提高火烧迹地识别精度也将是今后研究重点之一。
参考文献
Reconstructing long time series of burned areas in arid grasslands of southern Russia by satellite remote sensing
[J].
DOI:10.1016/j.rse.2010.02.010
URL
[本文引用: 1]

Fire is an important natural disturbance process in many ecosystems, but humans can irrevocably change natural fire regimes. Quantifying long-term change in fire regimes is important to understand the driving forces of changes in fire dynamics, and the implications of fire regime changes for ecosystem ecology. However, assessing fire regime changes is challenging, especially in grasslands because of high intra- and inter-annual variation of the vegetation and temporally sparse satellite data in many regions of the world. The breakdown of the Soviet Union in 1991 caused substantial socioeconomic changes and a decrease in grazing pressure in Russia's arid grasslands, but how this affected grassland fires is unknown. Our research goal was to assess annual burned area in the grasslands of southern Russia before and after the breakdown. Our study area covers 19,000 km 2 in the Republic of Kalmykia in southern Russia in the arid grasslands of the Caspian plains. We estimated annual burned area from 1985 to 2007 by classifying AVHRR data using decision tree algorithm, and validated the results with RESURS, Landsat and MODIS data. Our results showed a substantial increase in burned area, from almost none in the 1980s to more than 20% of the total study area burned in both 2006 and 2007. Burned area started to increase around 1998 and has continued to increase, albeit with high fluctuations among years. We suggest that it took several years after livestock numbers decreased in the beginning of the 1990s for vegetation to recover, to build up enough fuel, and to reach a threshold of connectivity that could sustain large fires. Our burned area detection algorithm was effective, and captured burned areas even with incomplete annual AVHRR data. Validation results showed 68% producer's and 56% user's accuracy. Lack of frequent AVHRR data is a common problem and our burned area detection approach may also be suitable in other parts of the world with comparable ecosystems and similar AVHRR data limitations. In our case, AVHRR data were the only satellite imagery available far enough back in time to reveal marked increases in fire regimes in southern Russia before and after the breakdown of the Soviet Union.
Ecological and sampling constraints on defining landscape fire severity
[J].
DOI:10.4996/fireecology.0202034
URL
[本文引用: 1]
Ecological definition and detection of fire severity are influenced by factors of spatial resolution and timing. Resolution determines the aggregation of effects within a sampling unit or pixel (alpha variation), hence limiting the discernible ecological responses, and controlling the spatial patchiness of responses distributed throughout a burn (beta variation). As resolution decreases, alpha variation increases, extracting beta variation and complexity from the spatial model of the whole burn. Seasonal timing impacts the quality of radiometric data in terms of transmittance, sun angle, and potential contrast between responses within burns. Detection sensitivity can degrade toward the end of many fire seasons when low sun angles, vegetation senescence, incomplete burning, hazy conditions, or snow are common. Thus, a need exists to supersede many rapid response applications when remote sensing conditions improve. Lag timing, or time since fire, notably shapes the ecological character of severity through first-order effects that only emerge with time after fire, including delayed survivorship and mortality. Survivorship diminishes the detected magnitude of severity, as burned vegetation remains viable and resprouts, though at first it may appear completely charred or consumed above ground. Conversely, delayed mortality increases the severity estimate when apparently healthy vegetation is in fact damaged by heat to the extent that it dies over time. Both responses depend on fire behavior and various species-specific adaptations to fire that are unique to the pre-fire composition of each burned area. Both responses can lead initially to either over- or underestimating severity. Based on such implications, three sampling intervals for short-term burn severity are identified; rapid, initial, and extended assessment, sampled within about two weeks, two months, and depending on the ecotype, from three months to one year after fire, respectively. Spatial and temporal conditions of sampling strategies constrain data quality and ecological information obtained about fire severity. Though commonly overlooked, such considerations determine the objectives and hypotheses that are appropriate for each application, and are especially important when building comparative studies or long-term reference databases on fire severity.
Prototyping a global alforithm for systematic fire-affected area mapping using MODIS time series data
[J].
DOI:10.1016/j.rse.2005.04.007
URL
[本文引用: 1]
The remote sensing of Earth surface changes is an active research field aimed at the development of methods and data products needed by scientists, resource managers, and policymakers. Fire is a major cause of surface change and occurs in most vegetation zones across the world. The identification and delineation of fire-affected areas, also known as burned areas or fire scars, may be considered a change detection problem. Remote sensing algorithms developed to map fire-affected areas are difficult to implement reliably over large areas because of variations in both the surface state and those imposed by the sensing system. The availability of robustly calibrated, atmospherically corrected, cloud-screened, geolocated data provided by the latest generation of moderate resolution remote sensing systems allows for major advances in satellite mapping of fire-affected area. This paper describes an algorithm developed to map fire-affected areas at a global scale using Moderate Resolution Imaging Spectroradiometer (MODIS) surface reflectance time series data. The algorithm is developed from the recently published Bi-Directional Reflectance Model-Based Expectation change detection approach and maps at 500 m the location and approximate day of burning. Improvements made to the algorithm for systematic global implementation are presented and the algorithm performance is demonstrated for southern African, Australian, South American, and Boreal fire regimes. The algorithm does not use training data but rather applies a wavelength independent threshold and spectral constraints defined by the noise characteristics of the reflectance data and knowledge of the spectral behavior of burned vegetation and spectrally confusing changes that are not associated with burning. Temporal constraints are applied capitalizing on the spectral persistence of fire-affected areas. Differences between mapped fire-affected areas and cumulative MODIS active fire detections are illustrated and discussed for each fire regime. The results reveal a coherent spatio-temporal mapping of fire-affected area and indicate that the algorithm shows potential for global application.
Evaluating spectral indices for burned area discrimination using MODIS/ASTER(MASTER) airborne simulator data
[J].
DOI:10.1016/j.rse.2011.06.010
URL
[本文引用: 1]
78 The discriminatory power of spectral indices to map burned areas is evaluated. 78 MODIS/ASTER (MASTER) airborne simulator data is used. 78 An index combining SWIR, MIR and emissivity data revealed the best performance.
Multitemporal analysis of the spectral response of scars of burnt area using the Landsat/ETM sensor
[C]//
Assessment of different spectral indices in the red-near-infrared spectral domain for burned land discrimination
[J].
DOI:10.1080/01431160210153129
URL
[本文引用: 1]
A new spectral index named Burned Area Index (BAI), specifically designed for burned land discrimination in the red-near-infrared spectral domain, was tested on multitemporal sets of Landsat Thematic Mapper (TM) and NOAA Advanced Very High Resolution Radiometer (AVHRR) images. The utility of BAI for burned land discrimination was assessed against other widely used spectral vegetation indices: Normalized Difference Vegetation Index (NDVI), Soil Adjusted Vegetation Index (SAVI) and Global Environmental Monitoring Index (GEMI). BAI provided the highest discrimination ability among the indices tested. It also showed a high variability within scorched areas, which reduced the average normalized distances with respect to other indices. A source of potential confusion between burned land areas and low-reflectance targets, such as water bodies and cloud shadows, was identified. Since BAI was designed to emphasize the charcoal signal in post-fire images, this index was highly dependent on the temporal permanence of charcoal after fires.
基于二阶段算法的HJ-CCD数据过火区制图
[J].
DOI:10.11873/j.issn.1004-0323.2013.1.72
URL
Magsci
[本文引用: 3]
<p>利用环境减灾小卫星多光谱数据研究过火区的制图方法,并分析对比了4种植被指数对于过火区的分离性。结果表明:基于可见光和近红外的BAI(Burned Area Index)与GEMI(Global Environment Monitoring Index)指数对于过火区的分离能力较好。在此基础上,采用二阶段识别算法对实验区的过火区进行提取。首先采用严格的阈值提取燃烧较为严重的过火像元,并以此作为第二阶段过火区识别的“种子”点,该阶段以减少误判为目的;第二阶段采用区域生长提取其他过火区域,同时采取较为宽松的阈值作为生长准则,以减少漏判,最后得出过火区边界。精度验证结果表明:该方法提取的过火区误判率为5.5%,漏判率为12.7%。</p>
Burned area mapping using HJ-1A/B CCD data based on two-phase algorithm
[J].
Overview of the radiometric and biophysical performance of the MODIS vegetation indices
[J].
DOI:10.1016/S0034-4257(02)00096-2
URL
[本文引用: 1]
We evaluated the initial 12 months of vegetation index product availability from the Moderate Resolution Imaging Spectroradiometer (MODIS) on board the Earth Observing System-Terra platform. Two MODIS vegetation indices (VI), the normalized difference vegetation index (NDVI) and enhanced vegetation index (EVI), are produced at 1-km and 500-m resolutions and 16-day compositing periods. This paper presents an initial analysis of the MODIS NDVI and EVI performance from both radiometric and biophysical perspectives. We utilize a combination of site-intensive and regionally extensive approaches to demonstrate the performance and validity of the two indices. Our results showed a good correspondence between airborne-measured, top-of-canopy reflectances and VI values with those from the MODIS sensor at four intensively measured test sites representing semi-arid grass/shrub, savanna, and tropical forest biomes. Simultaneously derived field biophysical measures also demonstrated the scientific utility of the MODIS VI. Multitemporal profiles of the MODIS VIs over numerous biome types in North and South America well represented their seasonal phenologies. Comparisons of the MODIS-NDVI with the NOAA-14, 1-km AVHRR-NDVI temporal profiles showed that the MODIS-based index performed with higher fidelity. The dynamic range of the MODIS VIs are presented and their sensitivities in discriminating vegetation differences are evaluated in sparse and dense vegetation areas. We found the NDVI to asymptotically saturate in high biomass regions such as in the Amazon while the EVI remained sensitive to canopy variations.
GEMI:A nonlinear index to monitor global vegetation from satellites
[J].
DOI:10.1007/BF00031911
URL
[本文引用: 1]
Knowledge about the state, spatial distribution and temporal evolution of the vegetation cover is of great scientific and economic value. Satellite platforms provide a most convenient tool to observe the biosphere globally and repetitively, but the quantitative interpretation of the observations may be difficult. Reflectance measurements in the visible and near-infrared regions have been analyzed with simple but powerful indices designed to enhance the contrast between the vegetation and other surface types, however, these indices are rather sensitive to atmospheric effects. The 'correction' of satellite data for atmospheric effects is possible but requires large data sets on the composition of the atmosphere. Instead, we propose a new vegetation index which has been designed specifically to reduce the relative effects of these undesirable atmospheric perturbations, while maintaining the information about the vegetation cover.
Regionally adaptable dNBR-based algorithm for burned area mapping from MODIS data
[J].
DOI:10.1016/j.rse.2007.01.017
URL
[本文引用: 1]
Recent advances in instrument design have led to considerable improvements in wildfire mapping at regional and global scales. Global and regional active fire and burned area products are currently available from various satellite sensors. While only global products can provide consistent assessments of fire activity at the global, hemispherical or continental scales, the efficiency of their performance differs in various ecosystems. The available regional products are hard-coded to the specifics of a given ecosystem (e.g. boreal forest) and their mapping accuracy drops dramatically outside the intended area. We present a regionally adaptable semi-automated approach to mapping burned area using Moderate Resolution Imaging Spectroradiometer (MODIS) data. This is a flexible remote sensing/GIS-based algorithm which allows for easy modification of algorithm parameterization to adapt it to the regional specifics of fire occurrence in the biome or region of interest. The algorithm is based on Normalized Burned Ratio differencing (dNBR) and therefore retains the variability of spectral response of the area affected by fire and has the potential to be used beyond binary burned/unburned mapping for the first-order characterization of fire impacts from remotely sensed data. The algorithm inputs the MODIS Surface Reflectance 8-Day Composite product (MOD09A1) and the MODIS Active Fire product (MOD14) and outputs yearly maps of burned area with dNBR values and beginning and ending dates of mapping as the attributive information. Comparison of this product with high resolution burn scar information from Landsat ETM+ imagery and fire perimeter data shows high levels of accuracy in reporting burned area across different ecosystems. We evaluated algorithm performance in boreal forests of Central Siberia, Mediterranean-type ecosystems of California, and sagebrush steppe of the Great Basin region of the US. In each ecosystem the MODIS burned area estimates were within 15% of the estimates produced by the high resolution base with the R 2 between 0.87 and 0.99. In addition, the spatial accuracy of large burn scars in the boreal forests of Central Siberia was also high with Kappa values ranging between 0.76 and 0.79.
Mapping burns and natural reforestation using thematic mapper data
[J].
DOI:10.1080/10106049109354290
URL
[本文引用: 1]
Remote sensing techniques are specially suitable to detect and to map areas affected by forest fires. In this work, Landsat 5 Thematic Mapper (TM) data has been used to study a number of forest fires that occurred in the province of Valencia (Spain) and to monitor the vegetation regeneration over burnt areas.
Mapping burned areas from Landsat TM/ETM+ data with a two-phase algorithm:Balancing omission and commission errors
[J].
DOI:10.1016/j.rse.2010.12.005
URL
[本文引用: 1]
78 Burned area maps were generated from automatic processing of Landsat TM/ETM+ images. 78 Algorithm was applied to 65 TM/ETM+ scenes in Portugal and 35 in California. 78 Kappa values were close to 0.85, with low omission and commission errors (< 16.5%).
Characterizing boreal forest wildfire with multi-temporal Landsat and LiDAR data
[J].
DOI:10.1016/j.rse.2009.03.004
URL
[本文引用: 1]
Wildfire is an important disturbance agent in Canada's boreal forest. Optical remotely sensed imagery (e.g., Landsat TM/ETM+), is well suited for capturing horizontally distributed forest conditions, structure, and change, while Light Detection and Ranging (LIDAR) data are more appropriate for capturing vertically distributed elements of forest structure and change. The integration of optical remotely sensed imagery and LIDAR data provides improved opportunities to characterize post-fire conditions. The objective of this study is to compare changes in forest structure, as measured with a discrete return profiling LIDAR, to post-fire conditions, as measured with remotely sensed data. Our research is focused on a boreal forest fire that occurred in May 2002 in Alberta, Canada. The Normalized Burn Ratio (NBR), the differenced NBR (dNBR), and the relative dNBR (RdNBR) were calculated from two dates of Landsat data (August 2001 and September 2002). Forest structural attributes were derived from two spatially coincident discrete return LIDAR profiles acquired in September 1997 and 2002 respectively. Image segmentation was used to produce homogeneous spatial patches analogous to forest stands, with analysis conducted at this patch level. In this study area, which was relatively homogenous and dominated by open forest, no statistically significant relationships were found between pre-fire forest structure and post-fire conditions ( r< 0.5; p> 0.05). Post-fire forest structure and absolute and relative changes in forest structure were strongly correlated to post-fire conditions ( r ranging from 0.507 to 0.712; p< 0.0001). Measures of vegetation fill (VF) (LIDAR capture of cross-sectional vegetation amount), post-fire and absolute change in crown closure (CC), and relative change in average canopy height, were most useful for characterizing post-fire conditions. Forest structural attributes generated from the post-fire LIDAR data were most strongly correlated to post-fire NBR, while dNBR and RdNBR had stronger correlations with absolute and relative changes in the forest structural attributes. Absolute and relative changes in VF and changes in CC had the strongest positive correlations with respect to dNBR and RdNBR, ranging from 0.514 to 0.715 ( p < 0.05). Measures of average inter-tree distance and volume were not strongly correlated to post-fire NBR, dNBR, or RdNBR. No marked differences were found in the strength or significance of correlations between post-fire structure and the post-fire NBR, dNBR, RdNBR, indicating that for the conditions present in this study area all three burn severity indices captured post-fire conditions in a similar manner. Finally, the relationship between post-fire forest structure and post-fire condition was strongest for dense forests (> 60% crown closure) compared to open (26 60%) and sparse forests (10 25%). Forest structure information provided by LIDAR is useful for characterizing post-fire conditions and burn induced structural change, and will complement other attributes such as vegetation type and moisture, topography, and long-term weather patterns, all of which will also influence variations in post-fire conditions.
Detecting trends in forest disturbance and recovery using yearly Landsat time series:1.LandTrendr-Temporal segmentation algorithms
[J].
DOI:10.1016/j.rse.2010.07.008
URL
[本文引用: 1]
We introduce and test LandTrendr (Landsat-based detection of Trends in Disturbance and Recovery), a new approach to extract spectral trajectories of land surface change from yearly Landsat time-series stacks (LTS). The method brings together two themes in time-series analysis of LTS: capture of short-duration events and smoothing of long-term trends. Our strategy is founded on the recognition that change is not simply a contrast between conditions at two points in time, but rather a continual process operating at both fast and slow rates on landscapes. This concept requires both new algorithms to extract change and new interpretation tools to validate those algorithms. The challenge is to resolve salient features of the time series while eliminating noise introduced by ephemeral changes in illumination, phenology, atmospheric condition, and geometric registration. In the LandTrendr approach, we use relative radiometric normalization and simple cloud screening rules to create on-the-fly mosaics of multiple images per year, and extract temporal trajectories of spectral data on a pixel-by-pixel basis. We then apply temporal segmentation strategies with both regression-based and point-to-point fitting of spectral indices as a function of time, allowing capture of both slowly-evolving processes, such as regrowth, and abrupt events, such as forest harvest. Because any temporal trajectory pattern is allowable, we use control parameters and threshold-based filtering to reduce the role of false positive detections. No suitable reference data are available to assess the role of these control parameters or to test overall algorithm performance. Therefore, we also developed a companion interpretation approach founded on the same conceptual framework of capturing both long and short-duration processes, and developed a software tool to apply this concept to expert interpretation and segmentation of spectral trajectories (TimeSync, described in a companion paper by Cohen et al., 2010). These data were used as a truth set against which to evaluate the behavior of the LandTrendr algorithms applied to three spectral indices. We applied the LandTrendr algorithms to several hundred points across western Oregon and Washington (U.S.A.). Because of the diversity of potential outputs from the LTS data, we evaluated algorithm performance against summary metrics for disturbance, recovery, and stability, both for capture of events and longer-duration processes. Despite the apparent complexity of parameters, our results suggest a simple grouping of parameters along a single axis that balances the detection of abrupt events with capture of long-duration trends. Overall algorithm performance was good, capturing a wide range of disturbance and recovery phenomena, even when evaluated against a truth set that contained new targets (recovery and stability) with much subtler thresholds of change than available from prior validation datasets. Temporal segmentation of the archive appears to be a feasible and robust means of increasing information extraction from the Landsat archive.
Detecting trends in forest disturbance and recovery using yearly Landsat time series:2.TimeSync-Tools for calibration and validation
[J].
DOI:10.1016/j.rse.2010.07.010
URL
[本文引用: 1]
Availability of free, high quality Landsat data portends a new era in remote sensing change detection. Using dense (~ annual) Landsat time series (LTS), we can now characterize vegetation change over large areas at an annual time step and at the spatial grain of anthropogenic disturbance. Additionally, we expect more accurate detection of subtle disturbances and improved characterization in terms of both timing and intensity. For Landsat change detection in this new era of dense LTS, new detection algorithms are required, and new approaches are needed to calibrate those algorithms and to examine the veracity of their output. This paper addresses that need by presenting a new tool called TimeSync for syncing algorithm and human interpretations of LTS. The tool consists of four components: (1) a chip window within which an area of user-defined size around an area of interest (i.e., plot) is displayed as a time series of image chips which are viewed simultaneously, (2) a trajectory window within which the plot spectral properties are displayed as a trajectory of Landsat band reflectance or index through time in any band or index desired, (3) a Google Earth window where a recent high-resolution image of the plot and its neighborhood can be viewed for context, and (4) an Access database where observations about the LTS for the plot of interest are entered. In this paper, we describe how to use TimeSync to collect data over forested plots in Oregon and Washington, USA, examine the data collected with it, and then compare those data with the output from a new LTS algorithm, LandTrendr, described in a companion paper (Kennedy et al., 2010). For any given plot, both TimeSync and LandTrendr partitioned its spectral trajectory into linear sequential segments. Depending on the direction of spectral change associated with any given segment in a trajectory, the segment was assigned a label of disturbance, recovery, or stable. Each segment was associated with a start and end vertex which describe its duration. We explore a variety of ways to summarize the trajectory data and compare those summaries derived from both TimeSync and LandTrendr. One comparison, involving start vertex date and segment label, provides a direct linkage to existing change detection validation approaches that rely on contingency (error) matrices and kappa statistics. All other comparisons are unique to this study, and provide a rich set of means by which to examine algorithm veracity. One of the strengths of TimeSync is its flexibility with respect to sample design, particularly the ability to sample an area of interest with statistical validity through space and time. This is in comparison to the use of existing reference data (e.g., field or airphoto data), which, at best, exist for only parts of the area of interest, for only specific time periods, or are restricted thematically. The extant data, even though biased in their representation, can be used to ascertain the veracity of TimeSync interpretation of change. We demonstrate that process here, learning that what we cannot see with TimeSync are those changes that are not expressed in the forest canopy (e.g., pre-commercial harvest or understory burning) and that these extant reference datasets have numerous omissions that render them less than desirable for representing truth.
Detection of forests using mid-IR reflectance:An application for aerosol studies
[J].
DOI:10.1109/36.297984
URL
[本文引用: 1]
<0.025. These findings may have further implications for other specific applications of the remote sensing of vegetation in hazy atmospheres
Estimating spectral separability of satellite derived parameters for burned areas mapping in the Calabria region by using SPOT-Vegetation data
[J].
DOI:10.1016/j.ecolmodel.2006.02.025
URL
[本文引用: 1]
In the Mediterranean regions, fires are considered a major cause of land degradation. Every year, around 45,000 forest fires break out in the Mediterranean basin causing the destruction of about 2.6 million hectares ( FAO, 2001). In Italy, as in other countries of the Mediterranean Basin, a small number of fires generally destroy a large percentage of the total burned areas every year. In these cases, the use of coarse resolution satellite sensors appears to be very useful for the discrimination of burned areas. In this study, SPOT-Vegetation (SPOT-VGT) data at full spatial resolution were analysed in order to investigate the spectral features of burned areas observed in the Mediterranean ecosystems in the Calabria Region during the 1998 fire season. Among the total fire events occurred in the considered period wildland fires larger than 1000 ha were selected for this study. SPOT-VGT imagery acquired before and after fire events were considered. Single channels or spectral indices suitable/or specifically designed for burned areas mapping were analysed. In particular near-infrared (NIR), short-wave infrared reflectance (SWIR), albedo, normalized difference of vegetation index (NDVI), normalized difference of infrared index (NDII), burned area index (BAI), global environmental monitoring index (GEMI) and soil adjusted vegetation index (SAVI), were considered in this study. The changes observed before and after fire occurrence in the considered parameters were presented and discussed. Results showed that among the spectral indices considered in this work, the highest discrimination capability was generally observed for NDII, SAVI, GEMI, BAI and NIR, nevertheless, strongly differences were observed from one fire event to another, and this fact suggests that the discrimination capability must be analysed coupled with the specific land covers affected by fire.
Production of Landsat ETM+ reference imagery of burned areas within Southern African savannahs:Comparison of methods and application to MODIS
[J].
DOI:10.1080/01431160600954704
URL
[本文引用: 1]
Accurate production of regional burned area maps are necessary to reduce uncertainty in emission estimates from African savannah fires. Numerous methods have been developed that map burned and unburned surfaces. These methods are typically applied to coarse spatial resolution (102km) data to produce regional estimates of the area burned, while higher spatial resolution (<3002m) data are used to assess their accuracy with little regard to the accuracy of the higher spatial resolution reference data. In this study we aimed to investigate whether Landsat Enhanced Thematic Mapper (ETM+)‐derived reference imagery can be more accurately produced using such spectrally informed methods. The efficacy of several spectral index methods to discriminate between burned and unburned surfaces over a series of spatial scales (ground, IKONOS, Landsat ETM+ and data from the MOderate Resolution Imaging Spectrometer, MODIS) were evaluated. The optimal Landsat ETM+ reference image of burned area was achieved using a charcoal fraction map derived by linear spectral unmixing (k02=021.00, a02=0299.5%), where pixels were defined as burnt if the charcoal fraction per pixel exceeded 50%. Comparison of coincident Landsat ETM+ and IKONOS burned area maps of a neighbouring region in Mongu (Zambia) indicated that the charcoal fraction map method overestimated the area burned by 1.6%. This method was, however, unstable, with the optimal fixed threshold occurring at >65% at the MODIS scale, presumably because of the decrease in signal‐to‐noise ratio as compared to the Landsat scale. At the MODIS scale the Mid‐Infrared Bispectral Index (MIRBI) using a fixed threshold of >1.75 was determined to be the optimal regional burned area mapping index (slope02=020.99, r 202=020.95, SE02=0261.40, y02=02Landsat burned area, x02=02MODIS burned area). Application of MIRBI to the entire MODIS temporal series measured the burned area as 100226702km2 during the 2001 fire season. The char fraction map and the MIRBI methodologies, which both produced reasonable burned area maps within southern African savannah environments, should also be evaluated in woodland and forested environments.
The role of topographic correction in mapping recently burned Mediterranean forest areas from Landsat TM images
[J].
DOI:10.1080/01431160500182992
URL
[本文引用: 1]
Operational use of remote sensing as a tool for post‐fire, Mediterranean forest management has been limited by problems of classification accuracy arising from confusion of burned and non‐burned areas. Frequently, this occurs as a result of slope illumination and shadowing effects caused by the complex topography encountered in many forested areas. Cloud shadows can also be a problem. The aim of this work was to investigate how image classification results could be improved by removing the illumination effects of topography from satellite images. This was achieved by applying supervised classification to both uncorrected and topographically corrected LANDSAT TM data for a site on the Greek island of Thasos. The classification methodology included atmospheric and geometric correction, field‐based training, seperability/contingency analysis and maximum likelihood processing. The classification scheme was determined on the basis of consultation with the Greek Forest Service. Overlay of the resulting class maps enabled comparison of the total burned area and its spatial extent using the two different approaches to processing. The results of each approach were compared with the forest perimeter map generated by the Forest Service using traditional survey methods. Accuracy assessment and error analysis clearly indicated that the removal of the topographic effect from the satellite image before its classification resulted in more accurate mapping of the burned area. It is concluded that operational use of satellite remote sensing for forest fire management depends on accurate, robust, widely available and proven techniques. Topographic correction should now be regarded as an essential element of any classification methodology which will be used for operational, post‐fire management of forests in complex Mediterranean landscapes.
