

0 引言
近年来,热红外遥感技术逐渐被国内外应用于热岛效应[6,7,8,9]、行业相关热水污染[10]、地震[11]及森林火灾爆发[12]等热效应研究中[13],而较少与钢铁企业产能变化监测相联系。理论上,自然界中一切温度高于绝对零度(-273 ℃)的物体都会通过辐射红外线表征物体的不同热特征信息[14]。一方面,钢铁企业在生产过程中会产生大量的热,并和周围环境形成较为鲜明的对比; 另一方面,卫星热红外遥感器通过星载传感器或者机载的传感器能记录地物体发射的热辐射信息[15],因此利用热红外遥感监测钢铁企业生产状态具有理论上的可行性。在中尺度遥感数据中,Landsat系列卫星已提供了近30 a的对地热红外观测数据,其2013年2月11日新发射的Landsat8卫星在许多方面又有了明显的改进[16]。Landsat8不仅继承了热红外通道高空间分辨率的特征,而且其搭载的热红外传感器(thermal infrared sensor,TIRS)上首次引入了量子学红外光子检测技术,增强了TIRS对热红外波段的敏感性,因而,Landsat8更加适合于对地表温度、热空间分布进行精确反演分析[17]。Landsat8被大量应用于土地利用分类[18]、地表温度反演[19,20]和生态监测[21]等领域。GF-2卫星全色影像空间分辨率达到0.81 m,多光谱空间分辨率达到3.24 m[22],已成功运用于地质调查[23]、滑坡灾害识别[24]和海岸线提取[25]等诸多领域。
地表温度是大气与陆地相互作用过程中的一个重要参数[26]。目前,利用热红外遥感数据已有大量的地表温度反演算法,其中,代表性算法有覃志豪单窗算法[27]和劈窗算法[19]、JCJ Muñoz单通道算法和劈窗算法[28]、JK Dan单窗算法[29]和Sobrino多通道多角度算法等。Landsat8卫星自发射以来,其地表温度反演算法的研究相继问世。TIRS传感器上携带2个热红外波段,但是由于TIRS第11波段的定标参数仍不理想,因此采用已提出的劈窗算法误差较大。相比之下,单窗算法和单通道算法对大气水汽含量和地表发射率敏感性更高,反演误差更小,其反演温度和实测数据具有较好的一致性[19,26-29]。
本研究通过TIRS单通道算法反演地表温度,建立热辐射监测模型来探讨热红外遥感技术在辅助钢铁企业产能变化监测中的可行性,并以高分影像(GF-2)空间结构变化信息和月产量数据为基础验证判断结果。以期及时掌握目标钢铁企业生产状态,服务于国家产业结构调整和优化升级的战略决策与管理。
1 假设与方法
1.1 理论假设
图1
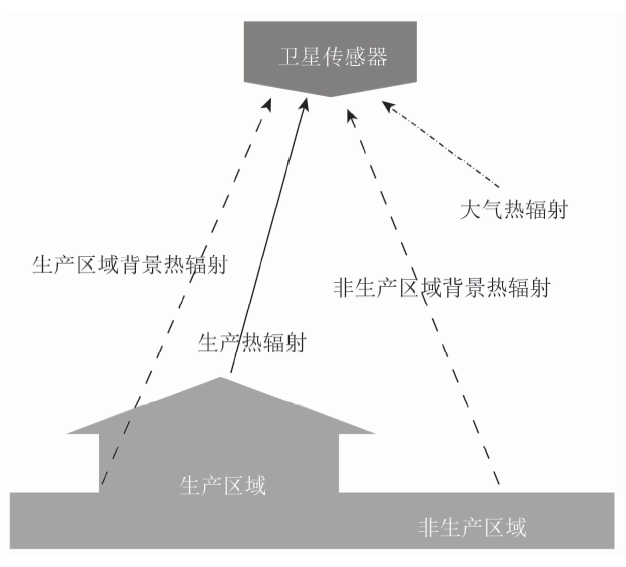
图1
钢铁企业热辐射示意图
Fig.1
Schematic diagram of thermal radiation in iron and steel enterprises
对于钢铁企业来说,一方面生产区域在非生产情况下自身会发射一定的热,即生产区域背景热辐射: 另一方面钢铁企业生产过程中高炉风温高达1 100 ℃左右,引起企业内部的生产区域显著升温并会辐射出大量的热,即生产热辐射,和周围不受钢铁企业生产影响的生产区域背景热辐射信息形成鲜明的对比。而非生产区域辐射的热主要是自身背景发射的,即非生产区域背景热辐射。在假设生产区域和非生产区域背景热辐射相等的前提下,2个不同区域热辐射信息的差值可以用来提取钢铁企业生产热辐射,从而反映钢铁企业的运行状态。在此假设下,热红外遥感可以通过星载传感器对钢铁企业产生的热辐射信息和周围环境背景热辐射信息进行收集和记录,建立生产热辐射监测模型来判断钢铁企业的生产状态。
1.2 研究方法
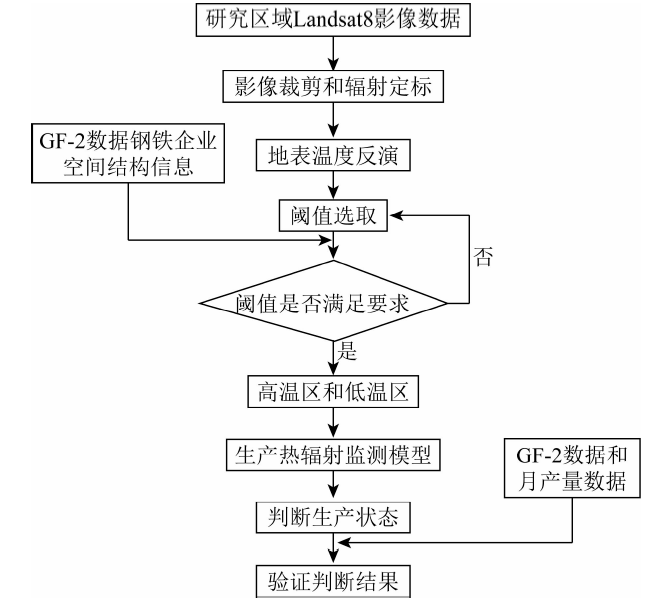
根据以上理论假设,通过辐射亮温和地表温度反演,获取生产区域热辐射和非生产区域背景热辐射信息,再基于阈值法构建钢铁企业生产热辐射监测模型,获取生产热辐射变化折线图; 结合生产区域热辐射面积变化情况和生产热辐射变化情况,判断该时期钢铁企业生产状态; 最后利用GF-2号数据以及收集到的月产量数据进行验证。具体技术路线如图2。
图2
1.2.1 辐射亮温和地表温度反演
式中: Lλ为波段λ的大气顶部光谱辐射值; Qcal为影像以16 bit量化的亮度值; ML和AL分别为波段λ的调整因子和调整参数,可从头文件中获得。
将大气顶部光谱辐射值转换成亮度温度值。可以利用Planck公式获得,即
最后,采用单通道算法反演地表温度[34],即
式中: ε为地表比辐射率,可通过ASTER光谱库获得主要地物在TIRS第10波段的比辐射率,林地、草地、土壤、建筑物和水体在TIRS第10波段的比辐射率分别为0.981 3,0.982 3,0.972 2,0.921 2和0.990 8[35]; 参数bγ为1 324 K; Lλ和T分别由式(1)—(2)获得; ψ1,ψ2和ψ3分别为大气水汽含量w的函数; τ为大气透过率; L↓和L↑为大气上行和下行辐射强度。
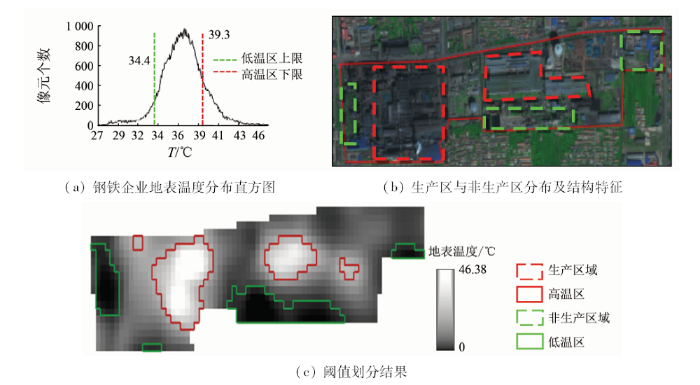
1.2.2 阈值划分
图3
1.2.3 生产热辐射监测模型
假设在高温区和低温区的大气热辐射和背景热辐射相等的前提下,2个区域热辐射信息的差值可以剔除掉钢铁企业生产区域背景热辐射信息和大气热辐射信息,从而可以反映钢铁企业生产所带来的热辐射信息。所以高温区和低温区平均地表温度的差值可以反映钢铁企业生产对于地表温度的平均贡献,再乘以高温区面积则可以得出钢铁企业生产时所产生的热辐射,从而间接反映该企业的产能状况[37]。钢铁企业生产热辐射值越高,说明该时间点钢铁企业的产能越高。以上假设可以简化为
式中: H为钢铁企业生产热辐射,℃; Tmax和Tmin分别为高温区和低温区的平均地表温度,℃; Smax为高温区面积,在影像中对应高值区的栅格数。
2 案例与分析
2.1 研究区概况
唐山市地处环渤海湾中心地带,是渤海经济区的重要组成部分,也是京津唐城市群的主要城市之一[16]。唐山市钢铁规模大,但钢铁产业市场结构分散,集中度比较低,需求下滑与产能过剩导致全行业亏损[17]。因此,作为化解产能过剩的重点地区和重点行业,河北省唐山市钢铁行业承担着十分繁重的压减产能任务[2]。选择唐山市A,B,C和D(图4)4个典型钢铁企业作为研究对象进行生产状态辅助监测,并结合GF-2影像数据对企业A和 C进行验证(企业B和D未获得GF-2数据); 为了加强验证,本研究通过生产热辐射H变化趋势判断出D钢铁企业生产状态之后,结合D钢铁企业的月产量数据进行补充验证(企业A,B和C未获得月产量数据)。
图4
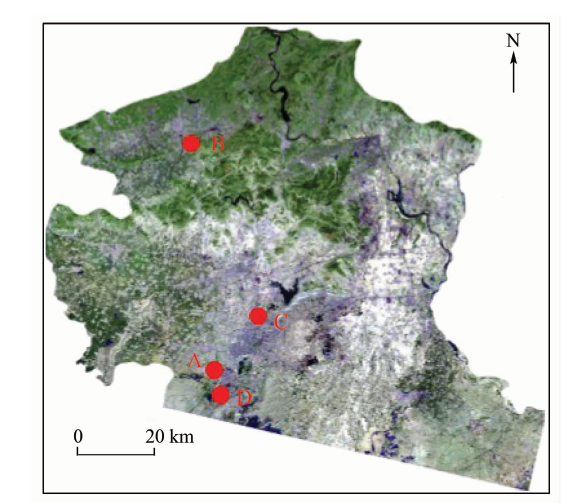
图4
唐山2016年5月13日Landsat8遥感影像
(Landsat8 B7(R),B6(G),B4(B)假彩色合成)
Fig.4
Landsat8 image in Tangshan on May 13,2016
2.2 数据来源
采用2016年5期Landsat8 数据开展地表温度反演,影像数据通过美国地质调查局网站下载,同时获取2期GF-2 PMS数据用于结果目视验证。Landsat8卫星的时间分辨率较低(16 d),同时考虑到影像质量,时间上连续的影像无法获得,最终选择的5期影像参数如表1所示。
表1 影像数据列表
Tab.1
| 时相 | 卫星 | 轨道号 | 产品 | 云覆盖 量/% | 空间分 辨率/m |
|---|---|---|---|---|---|
| 20160207 | Landsat8 | 122/32 | OLI TIRS L1T | 3.59 | 30 |
| 20160310 | Landsat8 | 122/32 | OLI TIRS L1T | 0.30 | 30 |
| 20160326 | Landsat8 | 122/32 | OLI TIRS L1T | 0.05 | 30 |
| 20160513 | Landsat8 | 122/32 | OLI TIRS L1T | 0.02 | 30 |
| 20160529 | Landsat8 | 122/32 | OLI TIRS L1T | 0.16 | 30 |
| 20150926 | GF-2 | — | PMS | — | 1 |
| 20160910 | GF-2 | — | PMS | — |
2.3 结果与分析
图5-1
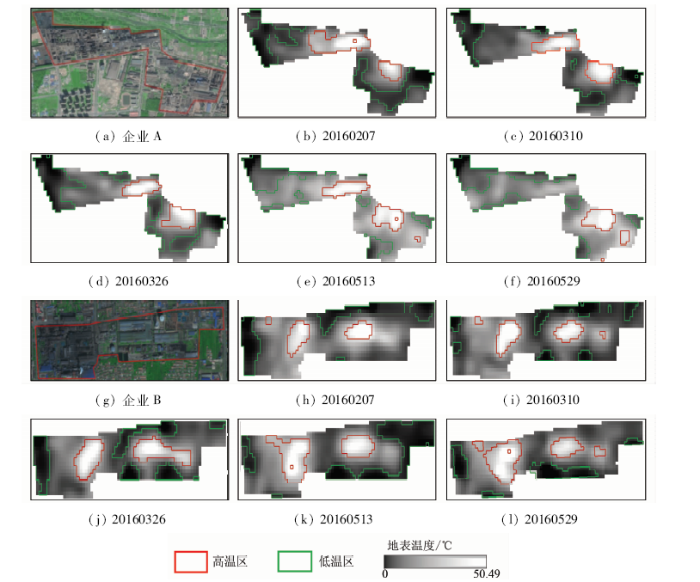
图5-1
钢铁企业热辐射监测结果
Fig.5-1
Monitoring results of thermal radiation in iron and steel enterprises
图5-2
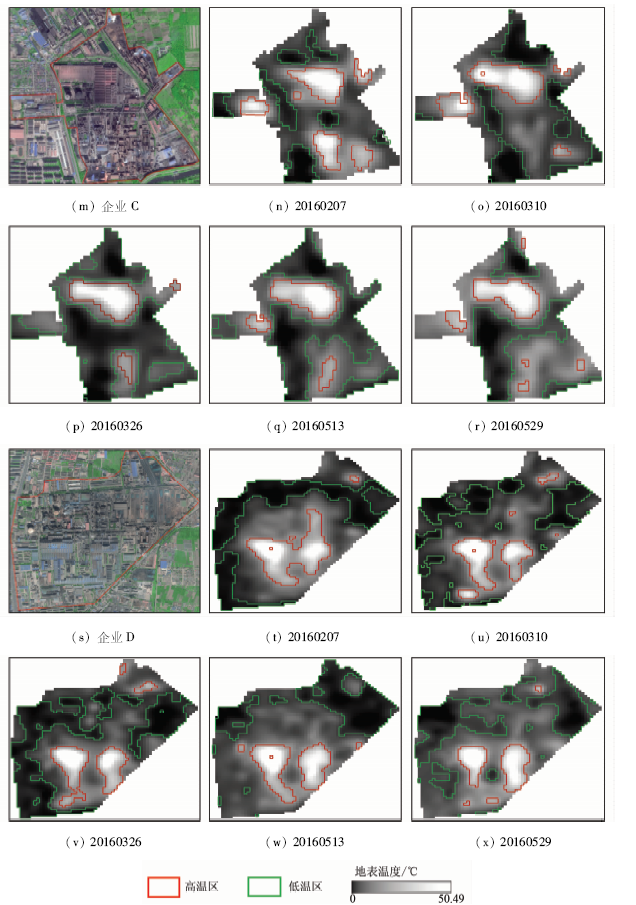
图5-2
钢铁企业热辐射监测结果
Fig.5-2
Monitoring results of thermal radiation in iron and steel enterprises
图6-1
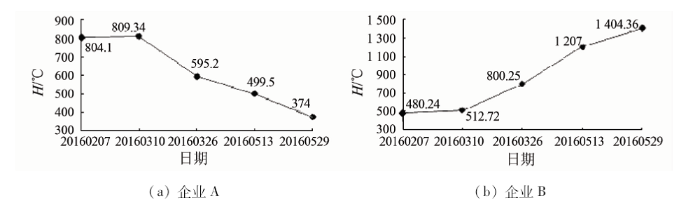
图6-2
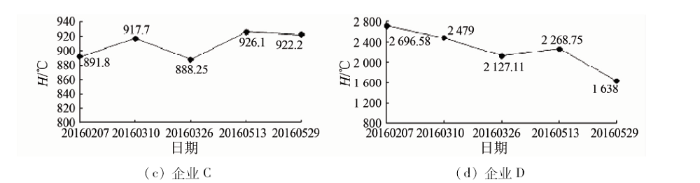
由图5(b)—(f)可见,在研究时间内企业A高温区面积不断减小,生产热辐射H也随着时间的变化由804.1 ℃降低到了374 ℃,降低了53.49%(图6(a)); 由图5(h)—(l)可见,在研究时间内企业B的高温区面积不断增加,与此同时生产热辐射H也随着时间的变化由480.24 ℃上升到了1 404.36 ℃,升高了192.42%(图6(b)); 由图5(n)—(r)可见,在研究时间企业C高温区面积几乎不变,同时生产热辐射H也随着时间的变化稳定波动(图6(c)); 由图5(t)—(x)可见,在研究时间内企业D高温区面积逐渐减小,同时生产热辐射H也随着时间的变化由2 696.58 ℃降低到了1 638 ℃,降低了39.26 %(图6(d))。在研究时间内处于减产状态钢铁企业的5期地表温度图像的高温区面积呈减小趋势,其生产热辐射H变化折线图也呈现下降趋势; 处于增产状态钢铁企业的5期地表温度图像高温区面积呈现增大趋势,其生产热辐射H变化折线图呈现上升趋势; 处于稳产状态钢铁企业的5期地表温度图像高温区域面积大小几乎不变,其生产热辐射H折线图也呈现一个稳定状态。由此判断,研究区2016年A钢铁企业为减产状态,B钢铁企业为增产状态,C钢铁企业为稳产状态,D钢铁企业为减产状态。
2.4 结果验证
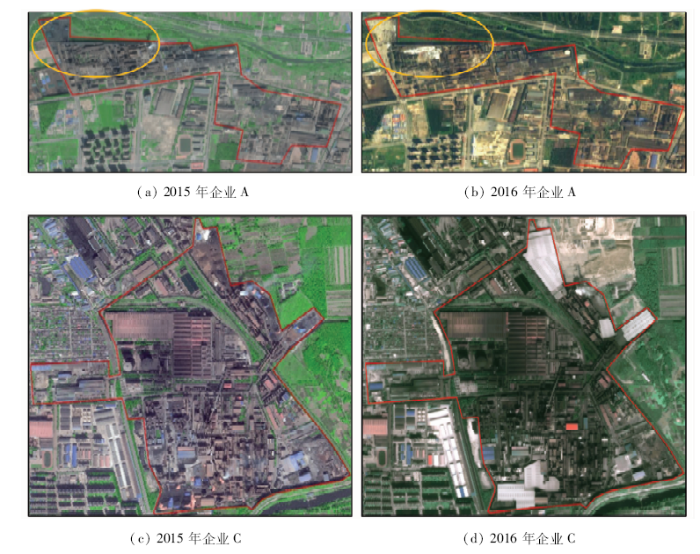
2.4.1 基于高分数据的结果目视验证
通过GF-2影像可准确识别钢铁企业空间结构和形态改变,对判断结果进行验证。由于无法获取2016年企业B和D对应的高分数据,所以只对企业A和C进行结果验证。钢铁厂空间结构变化见图7。
图7
2.4.2 基于月产量数据的结果验证
为加强验证,从中国产业竞争情报网获取了2016年2—6月企业D的月产量数据。其产量数据及其与H值的线性回归分析如图8所示。
图8
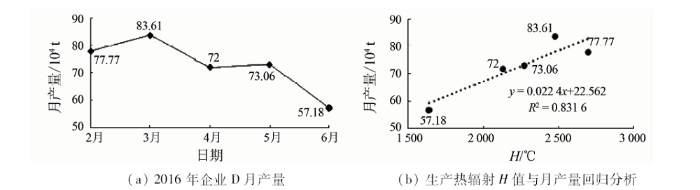
图8
2016年D钢铁企业月产量及其和生产热辐射的线性回归分析
Fig.8
Steel companies D monthly yield in 2016 and linear regression analysis of production in heat radiation H and monthly production
3 结论与讨论
以唐山市钢铁企业为例,通过对Landsat8遥感影像数据运用单通道算法反演地表温度,结合GF-2影像数据划分钢铁企业的高温区和低温区,建立基于时间序列的高温区H变化折线图,从而判断出钢铁企业的生产状态。最后通过高分影像数据提供的钢铁企业结构变化信息以及钢铁企业的月产量数据对判断结果进行了验证,得出以下结论:
1)利用高分影像提供的钢铁企业结构信息,结合数理统计特征选取划分高温区和低温区的阈值,能够精确地划分高温区与低温区。
2)通过热红外遥感技术,结合高分影像,建立钢铁企业基于时间序列的生产热辐射模型,判断钢铁企业生产状态,从而实现对钢铁企业生产状态辅助监测的方法基本可行。
本研究为辅助监测钢铁企业生产状态提供了参考方法,但将此方法推广到实际应用中还存在以下问题: 由于数据时间分辨率较低以及无法获得对应时刻的钢铁企业产量数据,因此较难实现监测效果的验证; 另外由于无法获得高时间分辨率的连续监测影像,所以不能实现实时监测。若想通过遥感技术实现对钢铁企业运行状态的监测,需研制发射更高空间分辨率的卫星或多源数据融合组网以获取高时间分辨率的热红外影像。
参考文献
年中国钢铁工业节能环保进展情况分析
[J].一、钢铁节能环保水平在化解产能过剩的大背景下继续稳步提高 2016年是“十三五”开局之年,为贯彻落实《中华人民共和国国民经济和社会发展第十三个五年规划纲要》和《中国制造2025)),工业和信息化部制定印发了《工业绿色发展规划(2016-2020年)》,这是中国钢铁及工业制造业加快推进生态文明建设,
China steel industry energy saving and environmental protection progress analysis
[J].
产能过剩所致失业人员再就业路径分析
[D].
Path Analysis of Reemployment of Unemployed People Caused by Excess Capacity
[D].
改革与发展:钢铁供给侧结构调整的两个关键
[J].正产能过剩背景下,我国钢铁行业面临企业经营十分困难、出口贸易摩擦加剧两大突出问题。钢铁的粗放发展模式所导致的供需不匹配,需要通过供给侧结构调整提升全行业适应市场需求的能力。要抓住当前国企改革契机,提高钢铁行业资本流动性,优化供给侧结构,解决总量供给过剩难题;以严格规范市场秩序和引导供需合作模式创新为重点,促进新常态下行业发展。
Reform and development:Two key aspects of structural adjustment of iron and steel supply side
[J].
钢铁企业环境自动监测系统的设计与研究
[D].
Design and Research of Automatic Environmental Monitoring System for Iron and Steel Enterprises
[D].
国家淘汰落后产能考核组来八钢检查落后产能淘汰情况
[J].正4月28日,由国家工业和信息化部消费司副司长高延敏带队的国家淘汰落后产能考核组一行,就自治区落实国家淘汰落后产能项目情况进行现场考核。考核组一行核查了八钢430立方米高炉拆除情况,同时还前往COREX炉进行了参观。现场考核检查过程中,八钢公司领导就八钢老区高炉关停、拆除,以及后续的利用问题,向考核组做了
Backward production capacity assessment team to check on the elimination of backward production capacity
[J].
CBERS-02 IRMSS热红外数据地表温度反演及其在城市热岛效应定量化分析中的应用
[J].
DOI:10.3321/j.issn:1007-4619.2006.05.028
URL
Magsci
[本文引用: 1]

针对CBERS-02IRMSS的热红外通道特性,对Jimenez-Munoz和Sobfino提出的普适性单通道地表温度反演算法进行改进,并利用该传感器热红外遥感数据反演北京地区和苏锡常地区的地表温度;利用2004年8月17日在青海湖的野外实测数据对该算法的地表温度反演结果进行的验证表明,改进的单通道反演算法应用于CBERS-02IRMSS传感器热红外数据的地表温度反演具有很高的反演精度。并在此基础上,运用城市热场变异指数对北京地区和苏锡常地区的城市热岛效应进行分析,运用中国研制的热红外卫星遥感数据给出了城市热岛效应的定量化描述。结果表明,CBERS-02IRMSS热红外遥感数据完全可以满足定量化应用的要求,具有很大的应用潜力。
Application of CBERS-02 IRMSS thermal infrared data to land surface temperature retrieval and its application in quantitative analysis of urban heat island effect
[J].
基于Landsat-8热红外数据的太湖地区地表温度反演与热岛效应分析
[J].
DOI:10.3969/j.issn.1000-5641.2016.04.015
URL
[本文引用: 1]
应用Landsat-8 TIRS遥感数据结合气象资料,使用三种不同的反演方法获得苏南太湖地区的地表温度(LST)数据.分析发现,辐射传输方程法反演的结果最接近于实测值;在缺乏实时大气廓线的情况下,普适性单通道算法更适用于Landsat-8热红外波段的地表温度反演;分裂窗算法在三种算法中精度最差.在反演结果的基础上,分析了不同地物的LST特征,建筑用地温度最高,水体最低.归一化植被指数(NDVI)和LST之间存在明显的负相关关系,证明了城市绿地是缓解城市热岛效应、改善城市热环境的重要途径.最后对2000年和2014年的两时相LST进行标准化和分区处理,分析发现,苏南太湖地区的热岛现象近些年来在不断加剧,城市热岛由原来单个存在逐渐成为多个热岛并存的局面,建筑用地的增加是导致整个城市热岛加剧的主要原因.
Retrieval of land surface temperature and analysis of heat island effect in Taihu based on Landsat-8 thermal infrared data
[J].
Application of high-resolution thermal infrared remote sensing and GIS to assess the urban heat island effect
[J].
DOI:10.1080/014311697219079
URL
[本文引用: 1]
Day and night airborne thermal infrared image data at 5 m spatial resolution acquired with the 15-channel (0.45mum-12.2mum) Advanced Thermal and Land Applications Sensor (ATLAS) over Alabama, Huntsville on 7 September, 1994 were used to study changes in the thermal signatures of urban land cover types between day and night. Thermal channel number 13 (9.60 mum-10.2mum) data with the best noise-equivalent temperature change (NEDeltaT) of 0.25 C after atmospheric corrections and temperature calibration were selected for use in this analysis. This research also examined the relation between land cover irradiance and vegetation amount, using the Normalized Difference Vegetation Index (NDVI), obtained by ratioing the difference and the sum of the red (channel number 3: 0.60-0.63mum) and reflected infrared (channel number 6: 0.76-0.90mum) ATLAS data. Based on the mean radiance values, standard deviations, and NDVI extracted from 351 pairs of polygons of day and night channel number 13 images for the city of Huntsville, a spatial model of warming and cooling characteristics of commercial, residential, agricultural, vegetation, and water features was developed using a GIS approach. There is a strong negative correlation between NDVI and irradiance of residential, agricultural, and vacant/transitional land cover types, indicating that the irradiance of a land cover type is greatly influenced by the amount of vegetation present. The predominance of forests, agricultural, and residential uses associated with varying degrees of tree cover showed great contrasts with commercial and services land cover types in the centre of the city, and favours the development of urban heat islands. The high-resolution thermal infrared images match the complexity of the urban environment, and are capable of characterizing accurately the urban land cover types for the spatial modeling of the urban heat island effect using a GIS approach.
Study on urban heat island effect with HJ-1B thermal infrared remote sensing image
[J].The paper researches a suitable temperature retrieval algorithm in accordance with HJ-1B thermal infrared data characteristics,and further analyzes Beijing heat island on the basis of land surface temperature iamge.Moreover,it explains the characteristics and possible causes of Beijing heat island.The results show that with the development of urbanization the Beijing heat island effect has become more serious,and the land surface temperature and NDVI are correlative.The land temperature retrieval algorithm of HJ-1B thermal infrared can be used for monitoring and analyzing the urban heat island effect.
热红外遥感用于陡河水库生态环境研究
[J].
DOI:10.1007/BF02951625
URL
Magsci
[本文引用: 1]
由航空成象光谱仪热红外图象、红外辐射温度等遥感数据,和环境调查非遥感数据相结合,从水库水体热污染、悬浮物污染、库区内水草生长对水体散热影响等方面的生态环境因素分析,讨论作为唐山市饮用水水源地的陡河水库,其水质如何控制在《地面水环境质量》Ⅲ类水质标准。确保2000年后唐山市居民有高质量的饮用水。
Study on the ecological environment of Douhe Reservoir
[J].
热红外遥感在地震监测预测中的应用
[J].
DOI:10.3321/j.issn:1000-7857.2009.06.018
URL
[本文引用: 1]
卫星热红外遥感技术在地震监测预测中的应用已取得了一定实效,利用这一技术成功预报了一些地震,并对地震的前兆热信息进行了大量实验研究。热红外异常发生的机制主要为地球放气说和应力致热学说。通过分析和总结临震热异常特征,介绍了几种热异常提取方法和判定方法,表明随卫星遥感技术的进步和研究工作的深入,热红外遥感应能在地震监测预报中发挥重要作用。
Thermal infrared remote sensing applied to earthquake monitoring and prediction
.[J].
热红外遥感在森林消防工作中的应用简述
[J].
DOI:10.3969/j.issn.1003-5168.2014.13.134
URL
[本文引用: 1]
热红外遥感技术对森林消防工作具有重要意义,能为林火预防和林火扑灭工作提供重要的数据支持。本文对该技术在森林消防工作中的应用进行了简要叙述,并以国内外应用实例表明其重要性,以期为森林消防工作的科学发展提供理论支持。
Application of thermal infrared remote sensing in forest fire prevention work
[J].
Thermal infrared remote sensing:Sensors,methods,applications
[J].
DOI:10.1016/S0099-1112(15)30104-X
URL
[本文引用: 1]
This book provides a comprehensive overview of the state of the art in the field of thermal infrared remote sensing. Temperature is one of the most important physical environmental variables monitored by earth observing remote sensing systems. Temperature ranges define the boundaries of habitats on our planet. Thermal hazards endanger our resources and well-being. In this book renowned international experts have contributed chapters on currently available thermal sensors as well as innovative plans for future missions. Further chapters discuss the underlying physics and image processing techniques for analyzing thermal data. Ground-breaking chapters on applications present a wide variety of case studies leading to a deepened understanding of land and sea surface temperature dynamics, urban heat island effects, forest fires, volcanic eruption precursors, underground coal fires, geothermal systems, soil moisture variability, and temperature-based mineral discrimination. hermal Infrared Remote Sensing: Sensors, Methods, Applications is unique because of the large field it spans, the potentials it reveals, and the detail it provides. This book is an indispensable volume for scientists, lecturers, and decision makers interested in thermal infrared technology, methods, and applications.
红外热成像技术的最新发展以及在安防应用分析
[J].红外热成像技术是一种被动红外夜视技术,其原理是基于自然界中一切温度高于绝对零度(-273℃)的物体,每时每刻都辐射出红外线,同时这种红外线辐射都载有物体的特征信息,这就为利用红外技术判别各种被测目标的温度高低和热分布场提供了客观的基础。利用这一特性,通过光电红外探测器将物体发热部位辐射的功率信号转换成电信号后,成像装置就可以一—对应地模拟出物体表面温度的空间分布,最后经系统处理,形成热图像视频信号,传至显示屏幕上,就得到与物体表面热分布相对应的热像图,即红外热图像。
The latest development of infrared thermal imaging technology and security application analysis
[J].
地震构造区红外亮温背景场建立及异常提取方法研究
[D].
A study on the brightness temperature background field foundation and the method for extracting anomalies of thermal infrared in the seismotectonic area
[D].
Landsat 8 TIRS热红外光谱数据定标准确性的分析
[J].Landsat系列卫星的热红外数据一直是获取地球表面温度的重要数据源, 而新一代Landsat 8卫星的TIRS热红外传感器数据进一步延续了这一重要使命。 但该卫星发射以来, 其热红外传感器的定标参数不断发生变化, 致使美国地质调查局(USGS)不得不在2014年2月对所有已获取的Landsat 8卫星数据进行重新处理。 为了考察新处理数据的定标准确性, 利用定标精度很高的Landsat 7 ETM+的3幅热红外影像来对同日过空的Landsat 8 TIRS热红外影像进行对比, 以查明TIRS热红外数据的定标准确性。 结果表明, 尽管Landsat 8 TIRS与Landsat 7 ETM+的热红外光谱数据很接近, 但是, 二者之间也存在着差别。 与ETM+6波段反演的大气顶部温度相比, TIRS 10波段表现为高估, 幅度最大为1.37 K, 而TIRS 11波段则表现为低估, 幅度可达-3 K。 可见, Landsat 8 TIRS热红外光谱数据的定标参数精度仍不稳定, 且以TIRS 11波段表现得更明显。 进一步分析发现, TIRS数据的误差会随着地表植被和裸土覆盖比例的不同而发生变化。 表现在TIRS 10波段的高估会随着植被比例的下降而加大, 而TIRS 11波段的低估则会随着植被比例的下降而减少。 因此, 虽然USGS提倡用TIRS 10单波段来反演温度, 但TIRS 10波段在低植被高裸土区的反演精度却远不及TIRS 11波段, 所以在低植被高裸土区可能不宜一味地采用TIRS10波段, 在没有把握的情况下, 在低植被覆盖区也可尝试采用TIRS 10和11波段温度的均值, 它可将误差缩小在<0.5 K范围以内。
Determination of the accuracy of Landsat 8 TIRS thermal infrared spectroscopy data
[J].
基于单通道算法的Landsat8卫星数据地表温度反演研究
[D].
Retrieval of Land Surface Temperature from Landsat8 Satellite Data Based on Single Channel Algorithm
[D].
基于Landsat8遥感影像的土地利用分类研究——以陕西省西安市辖区为例
[J].以陕西省西安市辖区 2013 年 9 月 13 日的 Landsat 8OLI 影像为数据源,参照国家土地利用分类标准,结合西安市辖区 的野外实际调查资料、天地图网络数据等辅助信息,建立了较为准确的解译标志,通过利用更高分辨率的高分一号数据建立 了验证样本,对监督分类、非监督分类和基于自动 CART 决策树分类的结果进行精度验证。结果表明,监督分类最大似然分类 方法对西安市辖区的土地利用分类结果与实际类别吻合最好,其分类总体精度可达 85.6%,通过此次研究为该区土地利用现 状遥感分类及应用提供了一定的科学基础。
Land use classification based on Landsat8 remote sensing images:A case study of Xi’an City,Shaanxi Province
[J].
Derivation of land surface temperature for Landsat-8 TIRS using a split window algorithm
.[J].
DOI:10.3390/s140405768
URL
PMID:4029672
[本文引用: 3]
Land surface temperature (LST) is one of the most important variables measured by satellite remote sensing. Public domain data are available from the newly operational Landsat-8 Thermal Infrared Sensor (TIRS). This paper presents an adjustment of the split window algorithm (SWA) for TIRS that uses atmospheric transmittance and land surface emissivity (LSE) as inputs. Various alternatives for estimating these SWA inputs are reviewed, and a sensitivity analysis of the SWA to misestimating the input parameters is performed. The accuracy of the current development was assessed using simulated Modtran data. The root mean square error (RMSE) of the simulated LST was calculated as 0.93 C. This SWA development is leading to progress in the determination of LST by Landsat-8 TIRS.
An improved mono-window algorithm for land surface temperature retrieval from Landsat 8 thermal infrared sensor data
[J].
DOI:10.3390/rs70404268
URL
[本文引用: 1]
The successful launch of the Landsat 8 satellite with two thermal infrared bands on February 11, 2013, for continuous Earth observation provided another opportunity for remote sensing of land surface temperature (LST). However, calibration notices issued by the United States Geological Survey (USGS) indicated that data from the Landsat 8 Thermal Infrared Sensor (TIRS) Band 11 have large uncertainty and suggested using TIRS Band 10 data as a single spectral band for LST estimation. In this study, we presented an improved mono-window (IMW) algorithm for LST retrieval from the Landsat 8 TIRS Band 10 data. Three essential parameters (ground emissivity, atmospheric transmittance and effective mean atmospheric temperature) were required for the IMW algorithm to retrieve LST. A new method was proposed to estimate the parameter of effective mean atmospheric temperature from local meteorological data. The other two essential parameters could be both estimated through the so-called land cover approach. Sensitivity analysis conducted for the IMW algorithm revealed that the possible error in estimating the required atmospheric water vapor content has the most significant impact on the probable LST estimation error. Under moderate errors in both water vapor content and ground emissivity, the algorithm had an accuracy of ~1.4 K for LST retrieval. Validation of the IMW algorithm using the simulated datasets for various situations indicated that the LST difference between the retrieved and the simulated ones was 0.67 K on average, with an RMSE of 0.43 K. Comparison of our IMW algorithm with the single-channel (SC) algorithm for three main atmosphere profiles indicated that the average error and RMSE of the IMW algorithm were 0.05 K and 0.84 K, respectively, which were less than the 2.86 K and 1.05 K of the SC algorithm. Application of the IMW algorithm to Nanjing and its vicinity in east China resulted in a reasonable LST estimation for the region. Spatial variation of the extremely hot weather, a frequently-occurring phenomenon of an abnormal heat flux process in summer along the Yangtze River Basin, had been thoroughly analyzed. This successful application suggested that the IMW algorithm presented in the study could be used as an efficient method for LST retrieval from the Landsat 8 TIRS Band 10 data.
Landsat 8卫星OLI遥感影像在生态环境监测中的应用研究
[J].
DOI:10.3969/j.issn.1674-6732.2013.06.001
URL
[本文引用: 1]
利用美国2013年2月发射的Landsat 8卫星上运营性陆地成像仪OLI获取的太湖流域遥感影像数据,开展了其在大气能见度、蓝藻水华及建设用地等生态环境监测领域中的应用研究。研究表明,Landsat 8卫星向未来延续了Landsat系列的长时期对地观测能力,且观测性能有所优化,适合对区域能见度、湖泊蓝藻水华、生态系统格局等生态环境问题进行反演和分析,是生态环境监测的重要遥感信息源。
Application of Landsat 8 satellite OLI remote sensing images in ecological environment monitoring
[J].
高分二号开启我国高分辨率遥感卫星应用时代
[J].
DOI:10.3969/j.issn.1009-6205.2014.10.004
URL
[本文引用: 1]
正俗话说,好事多磨。高分二号卫星的发射成功,比原计划晚来了半年多。然而,作为高分专项工程第二颗光学遥感卫星,高分二号卫星对于我国遥感卫星技术及应用产业发展所具有的重大里程碑意义,使其光芒并未因成功的曲折性衰减分毫。8月19日,高分二号卫星在长征四号乙运载火箭的完美托举下,腾空
High score two opens the era of high resolution remote sensing satellite applications in China
[J].
"高分二号"卫星数据在遥感地质调查中的初步应用评价
[J].
DOI:10.3969/j.issn.1009-8518.2015.04.009
URL
Magsci
[本文引用: 1]
“高分二号”(GF-2)卫星是迄今为止中国研制的空间分辨率最高的民用遥感卫星,标志着中国民用遥感卫星进入亚米级“高分时代”。为了更好地了解卫星的应用性能,充分发挥和利用好GF-2 卫星数据在地质矿产调查工作中的应用,尤其是在条件艰苦地区和境外区域。文章利用GF-2 卫星在新疆哈密地区的相关影像数据开展了遥感地质调查应用评价,从数据处理、地质构造信息提取、地层及岩体等岩性信息的识别,以及可识别地质体精度等方面分别进行评价。结果表明,GF-2 卫星数据能有效地划分遥感影像地质单元、识别地质构造空间展布特征,很好地满足优于1∶25 000 尺度的遥感地质调查工作,可为地质矿产资源调查及评价提供强有力的数据支撑。
Preliminary application evaluation of high resolution two satellite data in remote sensing geological survey
[J].
"高分二号"卫星数据遥感滑坡灾害识别研究——以云南东川为例
[J].
DOI:10.3969/j.issn.1009-8518.2015.04.012
URL
Magsci
[本文引用: 1]
标志着中国遥感卫星进入亚米级“高分时代”的“高分二号”(GF-2)卫星在太原成功发射,它将为地质灾害调查提供可靠的数据支持。文章以滑坡灾害频发的云南东川区为研究对象,首先对 GF-2 卫星采集的研究区数据进行正射校正、配准、融合和裁剪等预处理;然后采用面向对象的分类方法,通过影像分割、合并分块,并结合滑坡灾害的光谱、纹理和数字高程模型等多种信息特征,建立滑坡灾害识别规则,实现滑坡信息的遥感分类;最后对分类结果进行误分对象剔除,得到研究区滑坡信息。结果显示,利用GF-2 卫星数据可以较好地提取滑坡灾害信息,基本满足滑坡的灾害识别要求。文章通过面向对象的滑坡灾害特征提取所输出矢量结果可以方便地计算出滑坡的面积,对滑坡研究提供了极大的便利。
Identification of landslide hazard by remote sensing data of high resolution two satellite data:A case study of Yunnan,Dongchuan
[J].
"高分二号"卫星数据面向对象的海岸线提取法
[J].
DOI:10.3969/j.issn.1009-8518.2015.04.011
URL
Magsci
[本文引用: 1]
“高分二号”(GF-2)卫星的成功发射是中国遥感事业发展的重大突破,标志着中国遥感卫星进入亚米级时代。由于兼具高辐射精度、高定位精度和快速机动能力等特点,GF-2 卫星数据应用于海岸线提取将极大提高提取的精度和速度。现有的遥感解译海岸线方法主要有阈值分割法、边缘检测法、区域生长提取法、神经网络法和面向对象法等,其中面向对象法是一种新兴的遥感图像解译方法,该方法通过对影像的分割,使同质像元组成大小不同的对象,从而实现较高层次的遥感图像分类和目标地物提取。文章以深圳大鹏半岛GF-2 卫星数据为例,通过对影像进行正射校正、配准、融合和裁剪等预处理,再采用面向对象方法对海岸线进行了提取,并对入海河流河口处的海陆分界线划分进行了初步研究。研究结果表明,将海岸线提取结果与GF-2 卫星遥感影像叠加进行验证,结果可靠,且所耗时间短,效率高。
"High vibration camp,No.two"coast satellite data object extraction method returns
[J].
Satellite-derived land surface temperature:Current status and perspectives
[J].
DOI:10.1016/j.rse.2012.12.008
URL
[本文引用: 3]
中国科学院机构知识库(CAS IR GRID)以发展机构知识能力和知识管理能力为目标,快速实现对本机构知识资产的收集、长期保存、合理传播利用,积极建设对知识内容进行捕获、转化、传播、利用和审计的能力,逐步建设包括知识内容分析、关系分析和能力审计在内的知识服务能力,开展综合知识管理。
用陆地卫星TM6数据演算地表温度的单窗算法
[J].
DOI:10.1142/S0252959901000401
URL
[本文引用: 1]
陆地卫星 TM数据 (TM6)热波段表示地表热辐射和地表温度变化。长期以来 ,从 TM6数据中演算地表温度通常是通过所谓大气校正法。这一方法需要估计大气热辐射和大气对地表热辐射传导的影响 ,计算过程很复杂 ,误差也较大 ,在实际中应用不多。根据地表热辐射传导方程 ,推导出一个简单易行并且精度较高的演算方法 ,把大气和地表的影响直接包括在演算公式中。该算法需要用地表辐射率、大气透射率和大气平均温度 3个参数进行地表温度的演算。验证表明 ,该方法的地表温度演算较高。当参数估计没有误差时 ,该方法的地表温度演算精度达到 0 .4℃ ,在参数估计有适度误差时 ,演算精度仍达 1 .1℃。因该方法适用于仅有一个热波段的遥感数据 ,故称为单窗算法。
Single window algorithm for using terrestrial satellite TM6 data to calculate surface temperature
[J].
Landsat 8数据地表温度反演算法对比
[J].
DOI:10.11834/jrs.20154180
URL
[本文引用: 1]
随着卫星遥感技术的发展,利用遥感反演地表温度的方法不断出现,如劈窗法、双角度法和单通道算法等。Landsat系列卫星的遥感数据是地表温度反演的重要数据之一。本文选择无锡周边区域为研究区,利用Landsat 8卫星遥感数据,对两种劈窗算法(Juan C.Jiménez-Muoz劈窗算法和Offer Rozenstein劈窗算法)和两种单窗算法(Juan C.Jiménez-Muoz单通道算法和覃志豪单窗算法)的地表温度反演精度进行了对比和敏感性分析。采用太湖16个浮标站的实测数据来验证了4种算法的反演精度。结果表明:两种劈窗算法的精度较高且较为接近,误差为0.7 K左右;覃志豪单窗算法和Juan C.Jiménez-Muoz单通道算法精度较低,误差分别为1.3 K和1.4 K左右。Juan C.Jiménez-Muoz劈窗算法对参数的敏感性最低,Juan C.Jiménez-Muoz单通道算法次之,覃志豪单窗算法和Offer Rozenstein劈窗算法敏感性相对最高。其中Juan C.Jiménez-Muoz单通道算法只适用于一定的水汽含量范围,有一定的局限性。
Landsat 8 surface temperature inversion algorithm comparison data
[J].
Remote sensing based simple models of GPP in both disturbed and undisturbed piñon-juniper woodlands in the southwestern U.S
.[J].
DOI:10.3390/rs8010020
URL
[本文引用: 3]
Remote sensing is a key technology that enables us to scale up our empirical, in situ measurements of carbon uptake made at the site level. In low leaf area index ecosystems typical of semi-arid regions however, many assumptions of these remote sensing approaches fall short, given the complexities of the heterogeneous landscape and frequent disturbance. Here, we investigated the utility of remote sensing data for predicting gross primary production (GPP) in pi on-juniper woodlands in New Mexico (USA). We developed a simple model hierarchy using climate drivers and satellite vegetation indices (VIs) to predict GPP, which we validated against in situ estimates of GPP from eddy-covariance. We tested the influence of pixel size on model fit by comparing model performance when using VIs from RapidEye (5 m) and the VIs from Landsat ETM+ (30 m). We also tested the ability of the normalized difference wetness index (NDWI) and normalized difference red edge (NDRE) to improve model fits. The best predictor of GPP at the undisturbed PJ woodland was Landsat ETM+ derived NDVI (normalized difference vegetation index), whereas at the disturbed site, the red-edge VI performed best (R2adj of 0.92 and 0.90 respectively). The RapidEye data did improve model performance, but only after we controlled for the variability in sensor view angle, which had a significant impact on the apparent cover of vegetation in our low fractional cover experimental woodland. At both sites, model performance was best either during non-stressful growth conditions, where NDVI performed best, or during severe ecosystem stress conditions (e.g., during the girdling process), where NDRE and NDWI improved model fit, suggesting the inclusion of red-edge leveraging and moisture sensitive VI in simple, data driven models can constrain GPP estimate uncertainty during periods of high ecosystem stress or disturbance.
卫星热红外亮温、气温及地温观测的年变变化对比研究
[J].
DOI:10.3969/j.issn.0253-3782.2012.02.012
URL
[本文引用: 1]
通过对NOAA卫星热红外亮温 与野外安装气象观测站接收的气温、地下不同深度地温(0.2,0.5,1.5,2m)进行不同方式的对比研究,分析了卫星热红外亮温、气温、地下不同深度 地温的变化特征,探讨了亮温与气温及不同深度地温之间的关系.结果表明:①卫星热红外亮温观测,由于受天气、云层短周期因素变化影响,曲线呈现高频突跳特 征,但按最大值拟合出的亮温曲线有较好的年变变化规律;②浅层地温受气温及太阳辐射的影响较大,能够体现出日变化,表现出很好的季节变化规律;③深层地温 年变平稳,年变变化与季节相关.但与气温相比,表现出滞后效应,且深度越深,滞后时间越长;④亮温、气温及深度0.2m地温三者之间呈现很好的相关性.亮 温、气温、0.2m地温的极值几乎同时段出现,都符合季节变化.分析表明,亮温能够真实地反映地表温度的变化情况,能够为利用卫星热红外亮温提取地震异常 信息提供可靠准确证据.本研究结果为理解不同观测属性及其相互关系,以及更好地为地震监测应用提供了基础.
A comparison study on annual variation of thermal infrared brigtness temperature from meteorological stations
[J].
Landsat-8 thermal infrared sensor (TIRS) vicarious radiometric calibration
[J].
DOI:10.3390/rs61111607
URL
[本文引用: 1]
Launched in February 2013, the Landsat-8 carries on-board the Thermal Infrared Sensor (TIRS), a two-band thermal pushbroom imager, to maintain the thermal imaging capability of the Landsat program. The TIRS bands are centered at roughly 10.9 and 12 μm (Bands 10 and 11 respectively). They have 100 m spatial resolution and image coincidently with the Operational Land Imager (OLI), also on-board Landsat-8. The TIRS instrument has an internal calibration system consisting of a variable temperature blackbody and a special viewport with which it can see deep space; a two point calibration can be performed twice an orbit. Immediately after launch, a rigorous vicarious calibration program was started to validate the absolute calibration of the system. The two vicarious calibration teams, NASA/Jet Propulsion Laboratory (JPL) and the Rochester Institute of Technology (RIT), both make use of buoys deployed on large water bodies as the primary monitoring technique. RIT took advantage of cross-calibration opportunity soon after launch when Landsat-8 and Landsat-7 were imaging the same targets within a few minutes of each other to perform a validation of the absolute calibration. Terra MODIS is also being used for regular monitoring of the TIRS absolute calibration. The buoy initial results showed a large error in both bands, 0.29 and 0.51 W/m2·sr·μm or 612.1 K and 614.4 K at 300 K in Band 10 and 11 respectively, where TIRS data was too hot. A calibration update was recommended for both bands to correct for a bias error and was implemented on 3 February 2014 in the USGS/EROS processing system, but the residual variability is still larger than desired for both bands (0.12 and 0.2 W/m2·sr·μm or 0.87 and 1.67 K at 300 K). Additional work has uncovered the source of the calibration error: out-of-field stray light. While analysis continues to characterize the stray light contribution, the vicarious calibration work proceeds. The additional data have not changed the statistical assessment but indicate that the correction (particularly in band 11) is probably only valid for a subset of data. While the stray light effect is small enough in Band 10 to make the data useful across a wide array of applications, the effect in Band 11 is larger and the vicarious results suggest that Band 11 data should not be used where absolute calibration is required.
基于Landsat-8 TIRS的大气参数快速估算方法
[J].
DOI:10.3724/SP.J.1047.2017.00110
URL
[本文引用: 1]
Landsat-8卫星设计有2个热红外波段,但由于第11波段存在定标问题,无法用于定量研究,所以基于Landsat-8的地表温度反演算法目前仍以单通道为主。单通道算法反演地表温度需先已知地表比辐射率并完成大气校正的工作。在大气校正方面,现有的算法主要以传统方法为主,即通过大气辐射传输模型或经验-半经验公式的方式获取大气参数。但是,传统的经验-半经验的方法并不建立在物理机制上,其自身存在一定局限性;而大气辐射传输模型的方法虽然精度更高,但执行效率较低,不适用于业务化的产品生产。本文针对现有大气估算方法的不足,提出了一种基于Landsat-8单通道地表温度反演的大气参数快速估算方法。在水汽范围0~6 g/cm2内,大气参数快速估算方法的精度与MODTRAN精度相当,大气透过率RMSE为0.003;大气上行辐亮度RMSE为0.0004;大气下行辐亮度RMSE为0.0004。相较于传统的大气参数估算方法,本文提出的大气参数快速估算方法,不仅可以脱离大气辐射传输模型使用,而且具有与其相当的估算精度,执行效率更高,适用性更广。
A fast estimation method of atmospheric parameters for Landsat-8 TIRS data
[J].
Retrieval of land surface temperature from Landsat 8 TIRS for the command area of Mula irrigation project
[J].
DOI:10.1007/s12665-016-5952-3
URL
[本文引用: 1]
Application of satellite remote sensing in generating various geophysical parameters of land surface has gained tremendous importance in many branches of science and applied research. Out of all geophysical parameters of land surface derived from satellite remote sensing, the land surface temperature (LST) is of prime importance. LST acts as a governing parameter in water and energy exchange between land and atmosphere. It is an essential input to all the numerical weather prediction models, most of the process-based hydrological models and even in irrigation water management activities. Many algorithms for space-based LST retrieval and operational products of LST are available nowadays. However, these products are generally coarser in spatial and/or temporal resolutions. In the sector of irrigation water management, higher spatial resolution of all the geophysical products is prerequisites. Hence, in the present study, LST has been retrieved using two popular algorithms viz. radiative transfer theory (RTT) equation-based method and split-window (SW) algorithm. LST of Mula irrigation project command area has been retrieved using twenty images of Landsat 8 Thermal Infrared Sensor (TIRS) and Operation Land Imager (OLI) for entire Rabi/Winter season. Atmospheric parameters needed for the LST retrieval have been derived using online atmospheric correction tool. The land surface emissivity has been estimated using NDVI threshold technique. The standard daily LST product of MODIS has been used to cross-validate the LST retrieved from both the algorithms. LST retrieved using SW algorithm shows higher correlation coefficient with MODIS LST in entire command area and in agricultural land as well (0.938 and 0.925, respectively) compared to that of LST output of RTT method (0.902 and 0.894, respectively). The relative comparison of the LST products derived from RTT and SW algorithms showed that there is an average difference of 3 K between these two products. However, the difference is very small ( 0.8 to 0.5 K) in case of agricultural area in the command. The higher correlation coefficient values between retrieved LST using both the algorithms and MODIS LST products hints toward the higher accuracy of derived LST at higher spatial resolution. These high spatial resolution LST products can further be used for irrigation water management.
新型Landsat8卫星影像的反射率和地表温度反演
[J].
DOI:10.6038/cjg20150304
Magsci
[本文引用: 1]
Landsat 8卫星自2013年2月发射以来,其影像的定标参数经过了不断调整和完善,针对Landsat 8开发的各种算法也相继问世.本文采用最新的参数、算法和引入COST算法建立的大气校正模型,对Landsat 8多光谱和热红外波段进行了处理,反演出它们的反射率和地表温度,并与同日的Landsat 7数据和实测地表温度数据进行了对比.结果表明,现有Landsat 8多光谱数据的定标参数和大气顶部反射率反演算法已有很高的精度,本文引入COST算法建立的Landsat 8大气校正模型也与Landsat 7的COST模型所获得的结果几乎相同,相关系数可高达0.99.但是现有针对Landsat 8提出的地表温度反演算法仍不理想,已提出的劈窗算法误差都较大.鉴于TIRS 11热红外波段的定标参数仍不理想,因此在现阶段建议采用单通道算法单独反演TIRS 10波段来求算地表温度,但要注意根据大气水汽含量的情况选用正确的大气参数计算公式.
Retrieval of reflectance and land surface temperature of the newly-launched Landsat8 satellite
[J].
Regional variation in out-of-hospital cardiac arrest incidence and outcome
[J].DOI:10.1001/jama.300.12.1423 URL [本文引用: 1]
基于图像频谱全局均值标准差分割的点扩散函数估计
[J].实现运动模糊图像恢复的关键是获得准确的点扩散函数(point spread function,PSF)。针对PSF的模糊尺度和模糊方向这两个重要参数,提出了一种基于图像频谱全局均值标准差的估计方法。通过研究运动模糊图像的产生机理,分析了二次傅里叶变换的频谱特性,利用全局均值标准差法对频谱图进行阈值分割,结合中心点和端点的坐标距离来估计模糊尺度,运用Radon变换鉴别模糊方向,实现了PSF参数的确定。进行了标准图像阈值分割准确度的验证,利用仿真模糊图像估计算法进行了验证,并进行了实际复原实验。结果表明,该方法具有误差小、稳定性高和不受运动方向限制的特点,为图像恢复提供了一种准确、简便的参数估计方法。
Algorithm of global mean and standard deviation for motion blur parameters identification
[J].
