

0 引言
近年来,工农业等污水过度排放导致藻类等水生植物频频暴发,国内乃至全球湖泊富营养化问题亟待解决。湖泊富营养化主要表现为水华暴发,浮游植物呼吸及分解消耗了大量水中的溶解氧,导致水体生物死亡率上升,生态系统失衡。此外,其主要种群微囊藻对人体具有致癌作用[1],毒素通过饮用水或湖内鱼类威胁人体健康。巢湖为我国五大淡水湖之一,地处于安徽省合肥市东南部,流域内共有33条河流,贯穿7大水系。巢湖流域不仅承载着江淮地区的水循环重担,还维系着当地文化及旅游产业的发展。
近年来巢湖富营养化严重,利用遥感方法的巢湖水质研究始终处于热点。李素菊等[2]于2002年利用高光谱数据,建立反射率比值模型以及一阶微分模型应用于巢湖水体叶绿素a浓度估算,相关系数分别为0.70和0.66; 荀尚培等[3]于2009年利用MODIS最佳通道组合,定义叶绿素a指数IChla反演了巢湖叶绿素a浓度; 杨煜等[4]在2010年通过星地同步实验,基于环境一号卫星高光谱数据建立了3波段反演模型,决定系数为0.868 8; 谢杰等[5]于2010年利用TM数据结合波段组合法,反演并分析6 a间巢湖叶绿素a浓度演变趋势; 陈静等[6]于2012年基于环境一号卫星CCD数据建立模型反演并分析了巢湖叶绿素a季节分布特征; 殷守敬等[7]于2018年将地面观测数据空间插值与遥感反演结合,以高精度的叶绿素a浓度为指标评价了巢湖富营养化空间分布情况。以上研究大多基于实测光谱和浓度的统计关系,虽简单易行,但无法同时反演多个时相的叶绿素a浓度,普适性较低。辐射传输模型是基于水质因子的光学特征,直接建立行星反射率与物质浓度的物理方程,其演算过程完全依托影像,摆脱了实测数据的限制。但因模型参数较多,演算复杂,鲜有国内学者应用。而国外已有较多相关成果: Gilerson等[8]于2010年利用水质因子的固有光学性质结合反射光谱对美国内布拉斯加州的几个湖泊进行了叶绿素a浓度提取; Matthews[9]于2011年分析了叶绿素a等若干参数的固有光学特性,确定可用于内陆水域遥感模型的波段; Mishra等[10]于2013年建立了确定光学活性成分吸收系数的分析算法,估算美国密西西比州的若干养殖池塘中的浮游植物浓度; Stumpf等[11]于2016年总结了国外解析算法、半分析算法以及衍生算法估算藻华浓度的优劣,指出辐射传输模型具有更强的稳健性和普适性。故本文依据辐射传输机理,建立叶绿素a浓度反演物理模型; 采用巢湖不同时相的遥感影像验证模型的普适性; 进一步应用模型分析巢湖2016年藻类的时空分布特征。
1 叶绿素遥感反演模型
1.1 叶绿素参与的辐射传输过程
图1
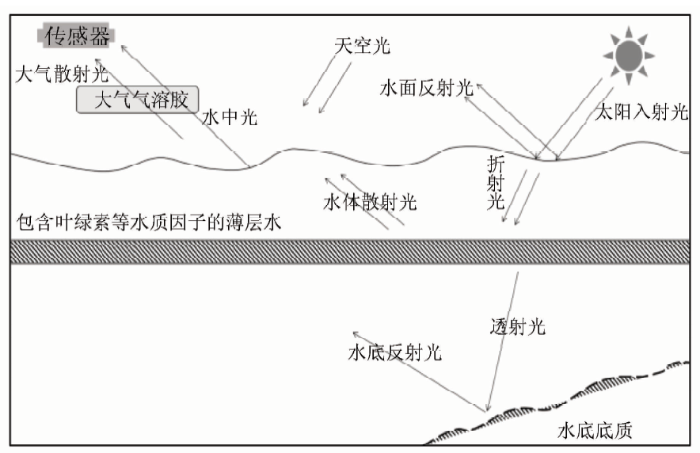
图1
电磁波与水体及大气相互作用
Fig.1
Interaction of electromagnetic waves, water and the atmosphere
故传感器接收到的出水辐亮度L(λ)为
式中:
遥感影像预处理可以消除
水体光谱特征决定于水中组分的吸收散射行为特征,分别以吸收和散射系数表征。对巢湖而言,水体反射率主要影响因子为叶绿素和悬浮泥沙2种。同一物质在同一波段的吸收散射系数为定值,因此可以建立上述2种物质的反射率与光学参数、物质浓度的关系模型,进而选取敏感波段联立方程求解叶绿素a浓度。
1.2 叶绿素a浓度遥感反演模型
根据1.1节中论述,需分析电磁波透过水面后在整层水体中的出水散射以及水底反射2部分。电磁波透过水面进行下行辐射,在水深为h处,厚度为dh的薄层水散射作用可表示为
式中:
式中
式中k为消光系数,即吸收系数与散射系数之和。
设水底为均一的朗伯体,
将式(8)和式(10)代入式(2),已知反射率
最终得到整层水体反射率表达式为
各波段对应的光学参数均可通过测量或计算获取,故未知数仅有悬浮泥沙浓度
2 巢湖流域叶绿素a浓度提取
2.1 遥感影像预处理
2.1.1 辐射定标
Landsat8遥感图像metadata的头文件可直接用于建立反射率与DN值间的线性关系。第8—11波段在此不予考虑。2016年7月25日影像对应的定标方程为
2.1.2 大气校正
式中:
式中:
式中:
设ρu为上行路径散射率,则结合定义及一系列变换,得到真实水体反射率
则大气校正计算公式为
式中Rvd为暗像元反射率,根据文献[19],认为ρu与
结合各参数定义依次计算出
图2
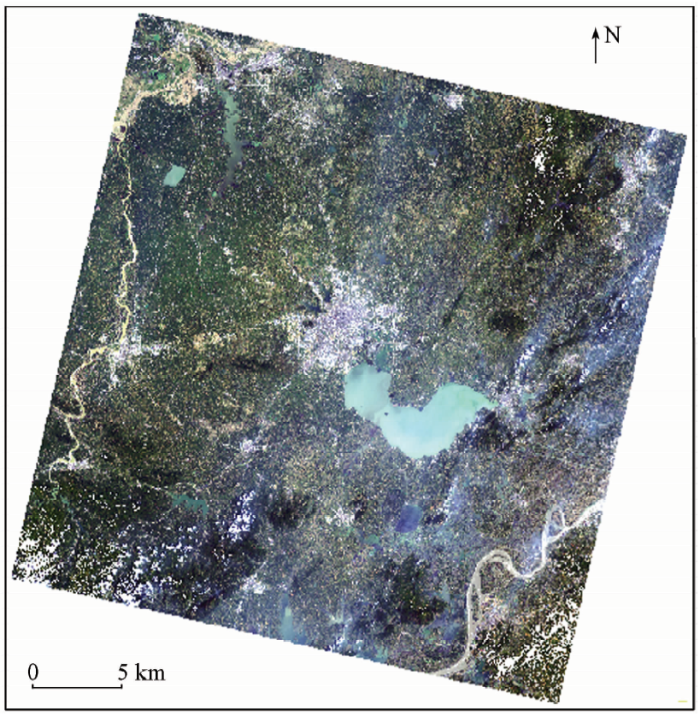
图2
大气校正后影像
(OLI B4(R),B3(G),B2(B)假彩色合成)
Fig.2
Image after atmospheric correction
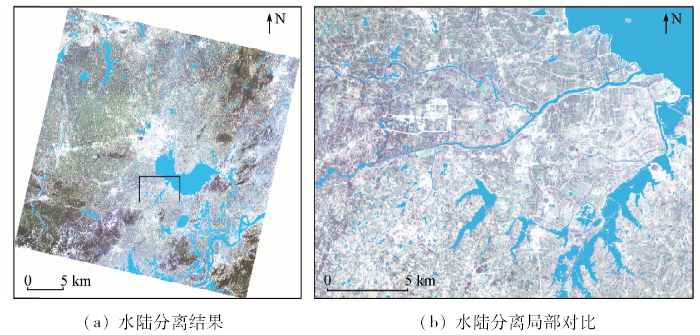
2.1.3 水陆分离
基于突出水体信息、排除异物同谱现象的原则,选取波段构建分离指数以进行水陆分离。以Landsat8 OLI为例,水体在B6和B7的反射率几乎为0,水体信息最丰富。水体与植被在蓝光—红光波段的反射率相似,直至近红外波段出现植被反射峰,故B5用于分离水体与植被; 水体与土壤仅在绿光波段的反射率相近,将B3用于排除土壤像元; 建筑物反射率在B6骤然增强,将B6作为水体与建筑物分离的特征波段。综上所述,将B3,B5和B6作为提取水体的特征波段,此外,蓝光波段包含的水体信息较为丰富,故将B2列入以增强水体特征。利用4个特征波段组合运算得到的水体提取指数NDI为
图3
2.2 光学参数获取
按照参考文献[21]方法获取
所需光学参数值如表1所示。
表1 水质因子光学参数值
Tab.1
| 参数 | 红光波段B4 | 近红外波段B5 |
|---|---|---|
| 波长/μm | 0.654 6 | 0.864 6 |
| 0.372 5 | 4.458 5 | |
| 0.000 904 382 | 0.000 271 848 | |
| 0.001 638 971 | 0.000 917 383 | |
| 0.18 | 0.11 | |
| 0.96 | 0.28 | |
| 0 | 0.18 |
2.3 特征波段选取
2.4 巢湖叶绿素a浓度反演
巢湖水较深,加之悬浮泥沙影响,穿透水体至水底的入射光几乎为0。近似认为式(12)中h趋近于正无穷大,化简得到最终巢湖叶绿素a浓度计算模型为
模型未知量包括
3 模型普适性验证
叶绿素a浓度遥感反演算法的普适性强意味着在光学差异较大的水体中皆能取得较高的反演精度[27]。内陆湖不同时相的水体具有较大的光学差异,将该模型同时应用于巢湖不同时相的遥感数据,若能获取较准确的反演结果,可证明模型普适性较强。
3.1 验证数据获取与处理
2组实测浓度数据引用于参考文献[28]和[29],分别为巢湖2006年7月30日的12个实测点以及2009年3月27日的23个实测点对应的叶绿素a浓度。
同步遥感影像数据来源于地理空间数据云平台(http://www.gscloud.cn)。受影像含云量限制,2009年3月27日的同步遥感数据使用4月9日的Landsat7 ETM+影像代替。由于受到Landsat7 ETM+机载扫描行校正器故障影响,该影像出现数据条带丢失,使用ENVI软件插件对影像进行去条带处理[30]; 辐射定标利用ENVI软件的Calibration工具完成,其余反演步骤与第2章一致。
3.2 精度及普适性分析
图4
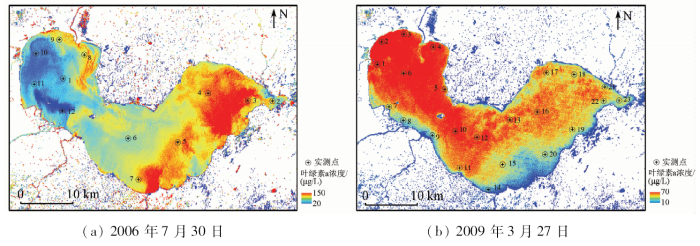
图5
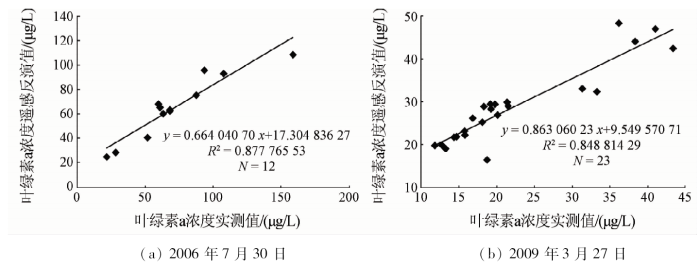
表2 模型反演值与实测值数值统计对比
Tab.2
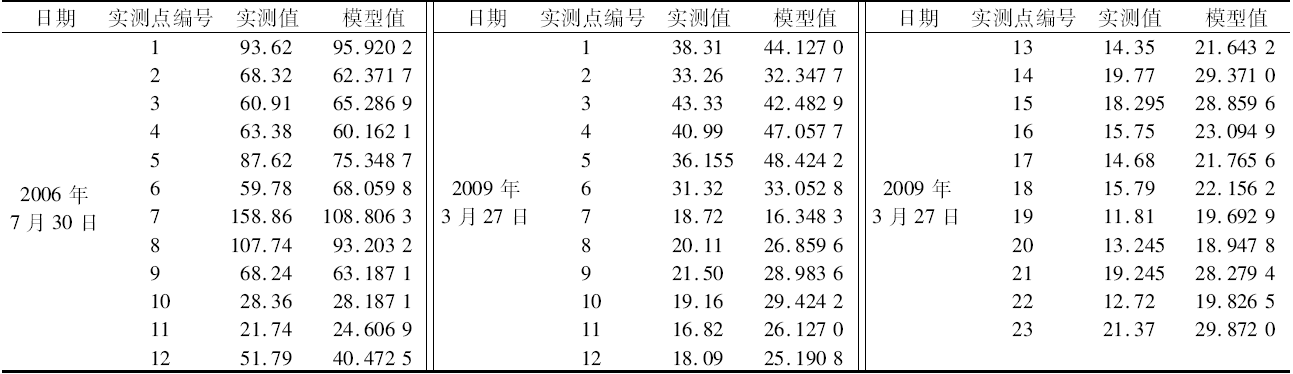 |
表3 模型反演值与实测值的误差
Tab.3
| 统计指标 | 2006年7月30日 | 2009年3月27日 |
|---|---|---|
| R2 | 0.877 765 53 | 0.848 814 29 |
| RE/% | 11.611 396 65 | 16.247 777 47 |
| REmin/% | 2.456 953 64 | 1.954 996 50 |
| REmax/% | 31.508 057 41 | 57.745 832 20 |
| RMSE/(μg/L) | 16.247 777 47 | 7.448 528 43 |
2次模型验证的决定系数
4 巢湖叶绿素a浓度时空变化分析
图6
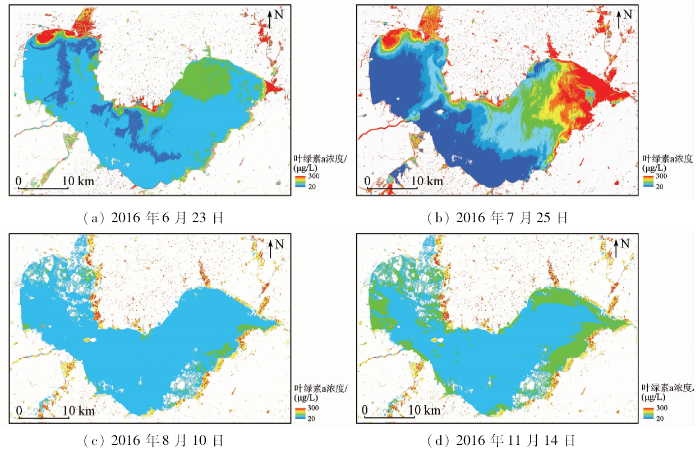
图6
2016年6—11月巢湖叶绿素a浓度反演结果
Fig.6
Results of Chaohu Lake chlorophyll-a concentration inversion from Jun. to Nov. in 2016
4.1 空间分布特征
由图6结果可见,巢湖富营养化区域主要分布在巢湖西北部和东部湖域,尤其是夏季时节,巢湖东部双桥河和裕溪河入湖流域会出现较大面积的水华暴发,叶绿素a浓度较低区域主要分布在巢湖中部地区。入湖口的水中悬浮物浓度较高,光合作用受限,于是藻类出现暴发性生长。
4.2 季节分布特征
对比分析可知,6月下旬—7月期间,随着夏季温度升高,藻类进入迅速繁衍期,巢湖整体富营养化程度加剧; 7月底—8月,湖体富营养化达到四季顶峰,中度及以上富营养化程度水体面积高达87%; 8月中旬,藻类开始出现衰退。但约9%轻度富营养化水体区域出现一定程度恶化,这可能是由于不同藻类的潜伏期和繁衍期存在差异; 11月藻类逐渐衰退,大部分水体恢复常态。
由于温度、光照、降水量和营养盐等因素的差异,藻类在水中进行季节性运动。通常藻类于春季休眠,夏季生长暴发,秋季逐渐消亡直至冬季恢复休眠[32]。此外,叶绿素生长规律与模型反演结果大致相似,也在一定程度上证明了本模型在同时反演内陆湖多时相叶绿素a浓度方面的优势及可行性。
5 结论
1)本文基于辐射传输机理,建立叶绿素a浓度反演模型。经巢湖2006年及2009年2组数据验证,得出模型决定系数分别为0.877 8和0.848 8,均方根误差远低于平均值,证明该模型适用于同时反演内陆湖不同时相的叶绿素a浓度,普适性较强。进而应用模型反演并分析了巢湖2016年叶绿素a浓度时空分布特征,与藻类生长规律相一致。
2)以往巢湖叶绿素a浓度反演模型大多依赖实测光谱的统计关系,具有时相局限性。本模型计算过程完全依托影像完成,适用于内陆湖不同时相数据的同步反演。
3)模型普适性的另一表征是不同水域的可移植性。但是,本模型不适用于浅海水域的水质参数反演。后期可以此为研究方向,进一步提高模型的普适性。
参考文献
巢湖生态危机及其对策
[J].巢湖为我国五大淡水湖泊之一,具有防洪、灌溉、航运、供水、水产、旅游休憩、与调节湖周小气候等多种功能。目前,湖泊污染、富营养化及淤积等均有日趋严重之势,衰亡过程加速。本文就其成因与对策作粗浅探讨,旨在延缓其老化。
Chaohu ecological crisis and countermeasures
[J].
巢湖浮游植物叶绿素含量与反射光谱特征的关系
[J].
DOI:10.18307/2002.0306
URL
Magsci
[本文引用: 1]

利用高光谱地物光谱仪在巢湖进行了反射光谱测量和同步水质采样分析.在分析巢湖水体反射光谱特征的基础上,通过研究水体光谱反射率与叶绿素浓度之间的关系,利用反射率比值法和一阶微分法分别建立了叶绿素a的遥感定量模型.结果表明反射率比值 R705nm/R680nm和690nm反射率的一阶微分均与叶绿素a浓度有较好的相关性,且用反射率比值法估算叶绿素a效果较好.
Correlations between reflectance spectra and contents of chlorophyll-a in Chaohu Lake
[J].
MODIS巢湖水体叶绿素a浓度反演模型
[J].
DOI:10.11898/1001-7313.20090112
URL
[本文引用: 1]
对大面积水体进行水质遥感监测是比较典型的水体环境监测手段。该文利用地物光谱仪测定了巢湖水面的光谱反射率,收集了相应时间的MODIS数据,经过预处理之后,首先分析了巢湖水面光谱特征,并对实测水体反射率与实测叶绿素a之间的关系进行统计拟合计算。在经过MODIS大气校正后,得到1~7通道的地表反射率。利用大气校正后的EOS/MODIS数据,选择最佳通道组合,定义了叶绿素a指数IChla,建立了MODIS巢湖叶绿素a浓度的反演模型,检验得到相关系数为0.5079。
MODIS in monitoring the chlorophyll-a concentrations of Chaohu Lake
[J].
基于环境一号卫星高光谱遥感数据的巢湖水体叶绿素a浓度反演
[J].
DOI:10.18307/2010.0404
URL
[本文引用: 1]
三波段模型是基于生物光学模型构建的叶绿素a浓度反演半分析模型,是目前反演内陆富营养化浑浊水体叶绿素a浓度效果较好的方法.本文通过星地同步实验,分析巢湖水体各组分光谱特征,分别基于地面实测数据与环境一号卫星高光谱遥感数据建立三波段模型反演巢湖水体叶绿素a浓度.结果表明,由于特征波段在不同数据源的位置不同,导致了两个模型波段选择及反演精度的差异.因此,只有在充分考虑遥感数据的光谱特征的条件下,分析遥感信息理论和实际图幅影像有效结合在一起的地物信息,才能进一步优化三波段模型的波段选择,实现遥感数据定量反演水体叶绿素a浓度的目标.
Retrieval of chlorophyll-a concentration by three-band model in Lake Chaohu
[J].
基于TM/ETM+影响分析巢湖叶绿素a浓度变化趋势
[J].对1995~2007年6景巢湖地区TM/ETM+数据利用多暗像元法进行大气校正并利用修正归一化水体指数(MNDWI)进行水体信息提取,在此基础上,使用(TM2+TM4-TM3)/ln[TM3]模型提取了巢湖水体叶绿素a相对浓度信息.结果表明:高浓度区域主要分布在巢湖西半湖;南淝河水质情况对巢湖蓝藻暴发的贡献较大;1995~2006年间高浓度区域扩大了1.82倍,并有向巢湖东部扩展的趋势,富营养化程度仍在加剧.
Analysing developing trend of chlorophyll-a concentration in Chaohu Lake based on TM/ETM+ image
[J].
基于环境一号卫星CCD数据的巢湖叶绿素a的动态监测
[J].
DOI:10.3969/j.issn.1002-6002.2012.01.032
URL
[本文引用: 1]
环境一号卫星CCD数据具有获取周期短、空间分辨率高等特点,能够及时准确地监测叶绿素a的浓度变化和分布,其在内陆湖泊水质遥感监测方面具有良好的应用前景。文章通过星地同步地面实验,建立起巢湖水体的叶绿素a浓度遥感反演模型,利用2009年4月至2010年3月的环境一号卫星CCD数据,分季节对巢湖叶绿素a行动态监测和分析。结果表明,巢湖叶绿素a具有明显的时空分布特征,夏季叶绿素a浓度最高,冬季最低,秋季高于春季;西半湖湖区叶绿素a浓度一般高于东半湖湖区,西北部和中部湖区空间变化比较大,东部湖区变化较小。
Chlorophyll-a dynamic monitoring in Chaohu Lake based on environmental satellite 1 CCD data
[J].
综合遥感与地面观测的巢湖水体富营养化评价
[J].
DOI:10.19316/j.issn.1002-6002.2018.01.22
URL
[本文引用: 1]
提出一种将地面观测数据空间插值与遥感反演结合的湖泊富营养化评价方法与业务化运行模式。对叶绿素a等可反演参数利用遥感影像反演,并利用实测值校正获得高精度反演结果;对总磷等不易反演参数采用空间插值获取全湖区数据,采用综合营养指数法对巢湖富营养化状态进行反演,获得2015年5月12日巢湖富营养化状态空间分布情况。结果表明,巢湖全湖为轻度和中度富营养化状态,呈现出西半湖高于东半湖的总体空间分布趋势。结合相关数据对巢湖富营养化成因进行推断,认为南淝河等上游河流各类营养物质输入量较大是造成西半湖北部富营养化严重的主要成因;西南部杭埠河等河流氮磷输入量较大,但其他营养物质输入较少,使得该区域总体呈现出富营养化程度偏低的现象。
Eutrophication assessment of Chao-hu Lake using remote sensing and in-situ data
[J].
Algorithms for remote estimation of chlorophyll-a in coastal and inland waters using red and near infrared bands
[J].
DOI:10.1364/OE.18.024109
URL
PMID:21164758
[本文引用: 1]
Remote sensing algorithms that use red and NIR bands for the estimation of chlorophyll-a concentration [Chl] can be more effective in inland and coastal waters than algorithms that use blue and green bands. We tested such two-band and three-band red-NIR algorithms using comprehensive synthetic data sets of reflectance spectra and inherent optical properties related to various water parameters and a very consistent in situ data set from several lakes in Nebraska, USA. The two-band algorithms tested with MERIS bands were Rrs(708)/Rrs(665) and Rrs(753)/Rrs(665). The three-band algorithm with MERIS bands was in the form R3 = [Rrs-1(665) - Rrs-1(708)] Rrs(753). It is shown that the relationships of both Rrs(708)/Rrs(665) and R3 with [Chl] do not depend much on the absorption by CDOM and non-algal particles, or the backscattering properties of water constituents, and can be defined in terms of water absorption coefficients at the respective bands as well as the phytoplankton specific absorption coefficient at 665 nm. The relationship of the latter with [Chl] was established for [Chl] > 1 mg/m3 and then further used to develop algorithms which showed a very good match with field data and should not require regional tuning.
A current review of empirical procedures of remote sensing in inland and near-coastal transitional waters
[J].
DOI:10.1080/01431161.2010.512947
URL
[本文引用: 1]
The empirical approach of remote sensing has a proven capability to provide timely and accurate information on inland and near-coastal transitional waters. This article gives a thorough review of empirical algorithms for quantitatively estimating a variety of parameters from space-borne, airborne and in situ remote sensors in inland and transitional waters, including chlorophyll-a, total suspended solids, Secchi disk depth (z SD), turbidity, absorption by coloured dissolved organic matter (a CDOM) and other parameters, for example, phycocyanin. Current remote-sensing instruments are also reviewed. The theoretical basis of the empirical algorithms is given using fundamental bio-optical theory of the inherent optical properties (IOPs). Bands, band ratios and band arithmetic algorithms that could be used to produce common biogeophysical products for inland/transitional waters are identified. The article discusses the potential role that empirical algorithms could play alongside more advanced model-based algorithms in the future of water remote sensing, especially for near real-time operational monitoring systems. The article aims to describe the current status of empirical remote sensing in inland and near-coastal transitional waters and provide a useful reference to workers. It does not cover nversion algorithms.
Quantifying cyanobacterial phycocyanin concentration in turbid productive waters:A quasi-analytical approach
[J].
DOI:10.1016/j.rse.2013.02.004
URL
[本文引用: 1]
In this research, we present a novel technique to monitor cyanobacterial bloom using remote sensing measurements. We have used a multi-band quasi analytical algorithm that determines phytoplankton absorption coefficients, a(phi)(lambda), from above surface remote sensing reflectance, R-rs(lambda). In situ data including remote sensing reflectance, phytoplankton pigment concentration, and absorption coefficients of optically active constituents in the water were collected from highly turbid and productive aquaculture ponds. These shallow (150 mu g l(-1)). Results demonstrate that the new approach will be suitable for quantifying phycocyanin concentration in cyanobacteria dominated turbid productive waters. (c) 2013 Elsevier Inc. All rights reserved.
Challenges for mapping cyanotoxin patterns from remote sensing of cyanobacteria
[J].
DOI:10.1016/j.hal.2016.01.005
URL
PMID:28073474
[本文引用: 1]
Using satellite imagery to quantify the spatial patterns of cyanobacterial toxins has several challenges. These challenges include the need for surrogate pigments since cyanotoxins cannot be directly detected by remote sensing, the variability in the relationship between the pigments and cyanotoxins especially microcystins (MC), and the lack of standardization of the various measurement methods. A dual-model strategy can provide an approach to address these challenges. One model uses either chlorophyll-a(Chl-a) or phycocyanin (PC) collectedin situas a surrogate to estimate the MC concentration. The other uses a remote sensing algorithm to estimate the concentration of the surrogate pigment. Where blooms are mixtures of cyanobacteria and eukaryotic algae, PC should be the preferred surrogate to Chl-a. Where cyanobacteria dominate, Chl-ais a better surrogate than PC for remote sensing. Phycocyanin is less sensitive to detection by optical remote sensing, it is less frequently measured, PC laboratory methods are still not standardized, and PC has greater intracellular variability. Either pigment should not be presumed to have a fixed relationship with MC for any water body. The MC-pigment relationship can be valid over weeks, but have considerable intra- and inter-annual variability due to changes in the amount of MC produced relative to cyanobacterial biomass. To detect pigments by satellite, three classes of algorithms (analytic, semi-analytic, and derivative) have been used. Analytical and semi-analytical algorithms are more sensitive but less robust than derivatives because they depend on accurate atmospheric correction; as a result derivatives are more commonly used. Derivatives can estimate Chl-aconcentration, and research suggests they can detect and possibly quantify PC. Derivative algorithms, however, need to be standardized in order to evaluate the reproducibility of parameterizations between lakes. A strategy for producing useful estimates of microcystins from cyanobacterial biomass is described, provided cyanotoxin variability is addressed.
基于二次散射的水污染遥感模型及其在珠江口水域的应用
[J].
Model for water pollution remote sensing based on double scattering and its application on the Zhujiang River Estuary
[J].
珠江三角洲水库水质遥感监测研究——以梅州水库和流溪河水库为例
C]//本文采用2006年11月10日陆地卫星TM数据,选取水污染状况相异的梅州水库和流溪河水库,进行水质定量分析,计算悬浮泥沙及污染物这两个主要水质参数的相对浓度。首先建立水体辐射方程并研究悬浮泥沙、污染物吸收和散射的物理机制以构建模型。继而对遥感图像进行预处理,包括辐射定标、辐射校正和大气校正,消除水面镜面反射影响等。最后选取TM1和TM3两波段的反射率数值计算出悬浮泥沙和污染物这两个水质参数的浓度。结果表明,梅州水库的悬浮泥沙浓度和污染物浓度均高于流溪河水质参数浓度,证实梅州水库的相对污染严重性。通过与实测数据比较验证,证明利用此模型进行遥感定量监测水库水质是可行可靠的。
Monitoring water quality of reservoirs in Pearl River Delta Region by remote sensing:A case study on Meizhou Reservoir and Liuxihe Reservoir
[C]//
珠江口水域水污染遥感定量分析
[J].
DOI:10.3321/j.issn:0529-6579.2002.03.026
URL
[本文引用: 1]
卫星遥感技术在水污染监测方面具有广阔的应用前景,在经大气校正后,可见光波段卫星遥感数据的水体象元主要受水中污染物,泥沙及叶绿素等的影响,研究污染水体反射光谱成像的物理过程,在水深较大(>2m)的假设下,建立了叶绿不敏感波段遥感数据象元反射率与污染物浓度的函数关系,并用多波段数据进行求解, 然后采用2002年TM卫星数据,用该方法对珠江用口海域的综合汛浓度进行了定量提取并用实测数据加以验证。结果显示,珠江不域重污染区主要分布在伶钉洋东北部,香港维多利亚港和深圳湾。
Qualitative analysis of water pollution in the Pearl River Estuary by remote sensing method
[J].
新丰江水库叶绿素浓度时空分布特征的遥感反演研究
[J].
DOI:10.11873/j.issn.1004-0323.2017.5.0825
URL
[本文引用: 1]
研究水体的辐射传输机理,分析水中叶绿素、悬浮泥沙、耗氧性有机物对入射光的吸收和散射作用,求得遥感数据与水中物质浓度的定量关系,据此推导叶绿素浓度遥感反演模型。针对环境卫星数据进行大气纠正等预处理后应用模型反演新丰江水库的叶绿素浓度,反演结果与实测数据的相关系数为0.94,平均相对误差66.67%,精度较高,由此可知水库库心全年叶绿素浓度较低,库湾地区叶绿素浓度较高,实地考察发现与该地区大量的网箱养殖有关。本文的模型选取多时相数据,综合考虑多种水质因素,采用多波段求解,精度较高。
The study of spatial-temporal characteristic for chlorophyll concentration derived from remote sensing image in Xinfengjiang Reservoir
[J].
新一代Landsat系列卫星:Landsat8遥感影像新增特征及其生态环境意义
[J].
DOI:10.5846/stxb201305030912
URL
Magsci
[本文引用: 1]
美国Landsat 8卫星的成功发射使一度中断的Landsat对地观测得以继续。Landsat 8除了保持Landsat 7卫星的基本特征外,还在波段的数量、波段的光谱范围和影像的辐射分辨率上进行了改进。基于该卫星的首幅影像,针对这些新的特性进行了分析和研究。研究发现:(1)新增的卷云波段有助于区别点云和高反射地物;(2)卷云波段设计的波长范围位于粘土矿物光谱反射的强吸收带,有利于土壤与建筑不透水面信息的区别; (3)新增的深蓝波段有助于水体悬浮物浓度的监测;(4)全色影像波长范围的收窄有利于该影像上植被和非植被的区别; (5)辐射分辨率的提高可避免极亮/极暗区的灰度过饱和现象,这对反射率极低的水体的细微特征识别有很大帮助。显然,Landsat 8这些新增的优点将会对全球生态环境变化的监测产生积极的作用。
Analysis of new characteristics of the first Landsat8 image and their eco-environmental significance
[J].
抚仙湖流域土地利用格局与水质变化关系
[J].<p>抚仙湖是我国水质较好的大型淡水湖泊之一,其总体水质为Ⅰ类。近年来由于流域内开发强度增加,水体水质呈现下降的趋势。为探究流域土地利用变化可能对湖泊水质产生的影响,利用1992-2010年的Landsat TM和ETM<sup>+</sup>数据,结合GIS技术和统计学方法,分析了流域内土地利用及景观格局变化与湖泊水质的响应关系。研究结果显示:抚仙湖水体面积缩小,流域内林地和耕地面积总体呈减小趋势,与水质污染指数变化呈显著负相关;交通运输用地和建设用地增长迅速,与水质污染指数响应呈显著正相关;景观斑块数目、形状指数等景观格局指数增加,流域景观格局破碎化加重,与水质污染指数变化呈显著正相关;土地利用及景观格局指数可以作为研究抚仙湖水质变化的重要指标。</p>
Relationship between land use pattern and water quality change in Fuxian Lake basin
[J].
The MODIS 2.1-μm channel-correlation with visable reflectance for use in remote sensing of aerosol
[J].
DOI:10.1109/36.628795
URL
[本文引用: 1]
=0.15±0.05. For this reflectivity range the dust radiative effect at 2.2 μm is small, and the surface reflectance in the blue and red channels can be retrieved
An automatic atmospheric correction algorithm for visible/NIR imagery
[J].
DOI:10.1080/01431160500486690
URL
[本文引用: 2]
The automatic correction of atmospheric effects currently requires visible to short‐wave spectral bands (400–250002nm) to derive high accuracy surface reflectance data. Common techniques employ spectral correlations of dark targets in the short‐wave infrared (SWIR, around 2.20208m), blue (48002nm) and red (66002nm) regions to derive the aerosol optical depth. A large number of current Earth‐observing satellite sensors have only three or four spectral channels in the visible and near‐infrared (VNIR) region (400–100002nm), making an automatic image‐based atmospheric correction very difficult. This contribution presents a new algorithm and first results with VNIR imagery. The method starts with the assumption of average clear atmospheric conditions (aerosol optical depth AOD02=020.27, corresponding to a visibility of 2302km) and calculates the surface reflectance in the red and near‐infrared (NIR) bands. The second step derives a mask of dark vegetation pixels. It is calculated using multiple thresholds of vegetation index combined with red and NIR surface reflectance values. Then the red band surface reflectance for the dark pixels is estimated from the NIR reflectance as ρred02=020.1 ρnir, from which the aerosol optical depth (or visibility) can be calculated. The core of the VNIR algorithm consists of two subsequent iteration loops (visibility and ρred) to improve the visibility estimate. Results of the VNIR method are presented for Landsat‐5 Thematic Mapper (TM) and Landsat‐7 Enhanced Thematic Mapper Plus (ETM+) imagery using only the first four bands. The performance of the method is compared to the established dark pixel technique where the SWIR bands are included. Results show that the deviation between both methods is usually less than 0.005 reflectance units if measured in terms of the scene‐average reflectance, indicating a useful potential for this approach.
Noise reduction and atmospheric correction for coastal applications of Landsat thematic mapper imagery
[J].DOI:10.1016/S0034-4257(99)00031-0 URL [本文引用: 1]
近红外波段(900—2500 nm)水吸收系数测量
[J].
DOI:10.11834/jrs.20121188
URL
Magsci
[本文引用: 1]
根据水在红外波段强吸收且吸收能力变化大的特点,在所提出可见光波段水吸收系数测量系统基础上增设了薄层水测量装置,使得测量水层厚度可在0.04―350 mm之间变化。在此基础上对厚度为0.04―150 mm的多个厚度水层进行了吸收系数测量,并对消除杂质影响后的测量数据进行了有效整合,得到900―2500 nm波段纯水吸收系数。由于确保了各波段数据均在仪器最佳探测区间取得,所得结果精度较高,且与被普遍接受的前期研究结果相一致,可作为相关定量遥感的基础数据。
Measuring pure water absorption coefficient in the near-infrared spectrum(900—2500 nm)
[J].
一种自动提取水体污染信息的方法:中国,200810219844
[P].
A method for automatically extracting water pollution information:China, 200810219844
[P].
珊瑚礁遥感监测方法研究
[D].
Reasearch on Coral Reef Remote Sensing Monitoring Methods
[D].
联合浮标与卫星数据的赤潮预警与决策服务
[D].
Red Tide Prediction and Decision Services by Integrating Buoy and Remote Sensing Data
[D].
基于辐射传输模型的遥感反射率计算及叶绿素反演算法分析
[D].
Calculation of Remote Sensing Reflectance Based on Radiative Transfer Model and Analysis of Chlorophyll Retrieval Algorithm
[D].
Automatic road identification and labeling in Landsat4 TM images
[J].
DOI:10.1016/0031-8663(89)90002-1
URL
[本文引用: 2]
A conceptually parallel road detection method in Landsat 4 TM images is proposed. The goal is to detect roads at three different levels: major roads, local roads, and minor roads. This road network information is used for the evaluation of detected potential oil/gas pads, since these pads seldom occur on major roads but are often located at the end of minor access roads. The proposed method is composed of two phases: low-level road detection and high-level road labeling. Experimental results from several images show that the proposed method can detect roads reasonably well in the low-level phase and is useful in pad evaluation. Future research includes combining multi-band information in road detection and determining thresholds in a more systematic way.
NDCI法Ⅱ类水体叶绿素a浓度高光谱遥感数据估算
[J].
DOI:10.18307/2013.0319
URL
[本文引用: 1]
以太湖、巢湖为研究区,以Hyperion和HJ-1A卫星HSI高光谱数据以及实测水质浓度数据为实验数据,引入归一化叶绿素指数(NDCI),对Ⅱ类水体的高光谱叶绿素a浓度估算进行分析研究.首先对高光谱数据的光谱通道设置以及水体光谱特征进行分析,研究确定模型的最优波段.然后,将确定最优波段后的NDCI反射率因子作为变量与实测样本点数据进行回归分析,得到NDCI与叶绿素a浓度之间的回归关系,进行叶绿素a浓度的估算.与常用的比值法、一阶微分法和三波段法相比,NDCI的性能优于这3种方法,表明NDCI是一种计算简单、估算精度高、实用性强的Ⅱ类水体叶绿素a浓度估算方法.
Estimation of chlorophyll-a concentration of caseⅡ waters from hyperspectral remote sensing data in NDCI method
[J].
基于遥感的巢湖水体叶绿素a浓度变化趋势研究
[D].
Research Developing Trend of Chlorophyll-a Concentration in Chaohu Lake Based on Remote Sensing
[D].
基于高光谱遥感的巢湖水体叶绿素-a浓度反演模型研究
[D].
Regression of Chlorophyll Content Based on Hyperspectral Remote Sensing Data in Chaohu Lake
[D].
遥感图像条带去除方法研究
[D].
Remote Sensing Image Strip Removal Method
[D].
基于遥感数据分析南海叶绿素与颗粒物的季节变化与相互关系
[J].
DOI:10.3969/j.issn.0253-4193.2015.10.003
URL
[本文引用: 1]
本文基于卫星遥感的叶绿素 a 浓度与颗粒物后向散射系数月平均数据以及其他海洋与气象参数,详细分析了两个生物光学参量在季节尺度上的相关性及其与物理参数的耦合关系,并运用光驯化模型分析了南海表层水体浮游植物的生理学季节变化特征。结果表明,受南海地形和风场等物理参量的变化,南海叶绿素 a 浓度与颗粒物后向散射系数存在显著的季节和空间分布特征,具有一定的共变性和差异性。在南海近岸及浅水区,叶绿素 a 浓度与颗粒物后向散射系数有很好的耦合关系;而在南海深水海盆区,叶绿素 a 浓度冬高夏低,其季节循环过程与颗粒物后向散射系数相反,这主要是受浮游植物生理学过程的影响。“生物量控制区”与“光驯化控制区”的分界在南海与陆架-海盆分界线一致,体现了水深条件对浮游植物生理状态的影响。此外本文还发现,在吕宋海峡西部海区,叶绿素 a与颗粒物后向散射系数的关系表现出“生物量-光驯化共同控制”的特点。
A satellite-based analysis on the seasonal variations and interrelationships between chlorophyll and particle in the South China Sea
[J].
