

0 引言
Immitzer等[5]以WorldView-2影像为数据源,采用面向对象的随机森林算法对澳大利亚Burgenland区的10种主要树种进行分类,总体精度达82.0%; Pu等[6]对比了IKONOS和WorldView-2在美国Tampa城市7种树种分类上的精度差异; 刘怀鹏等[7]采用WorldView-2数据,基于纹理结合光谱信息识别呼和浩特市主城区7种绿化树种,最大似然法总体识别精度为86.4%; 王妮等[8]采用QuickBird数据和最大似然法,对南京中山陵园的主要树种进行了识别,精度最高为66.3%。研究表明,高空间分辨率影像在植被分类乃至树种识别上具有重大潜力[9,10,11,12,13],结合影像丰富的纹理、空间信息和辅助数据能大大提高分类精度。但现有树种识别研究主要基于外国数据源,基于国产卫星影像的研究较少。
高分二号(GF-2)卫星于2014年8月19日成功发射,是我国研制的首颗空间分辨率达到“亚m”级别的民用遥感卫星[14]。为探索GF-2卫星影像在树种识别上的潜力,推动该数据在我国森林资源监测中的应用,以福建将乐国有林场为研究区,开展杉木、马尾松和毛竹的树种识别和龄组划分研究。
1 研究区概况及数据源
1.1 研究区概况
将乐国有林场位于福建省三明市将乐县,是南方集体林区的典型代表,地处武夷山脉东南部、金溪河畔,坐标为N26°25'27°04',E117°05'117°40'间; 地貌多以中、低山丘陵为主,海拔在400800 m; 属亚热带季风气候区,雨水充足,年平均气温18.7 ℃,无霜期达270 d; 土壤以红壤和黄红壤为主。研究区内主要树种有杉木、马尾松和毛竹等。
1.2 数据源及其预处理
本研究采用的遥感数据为GF-2 L1A级数据,成像时间为2017年5月14日。数据包括全色波段和4个多光谱波段(空间分辨率分别为0.81 m和3.24 m)。多光谱波段包括: 0.450.52 μm(Blue),0.520.59 μm(Green),0.630.69 μm(Red)和0.770.89 μm(NIR)。基础数据包括1∶1万比例尺地形图、2016年二类调查数据以及实测的主要树种冠层反射率数据。
数据预处理后提取研究区的归一化植被指数(normalized difference vegetation index,NDVI),根据DEM数据生成坡度和坡向。将融合后的GF-2影像的4个波段、NDVI、坡度、坡向以及DEM合并为8波段的待分类影像。
2 研究方法
2.1 光谱特征分析
选取研究区中的马尾松、毛竹和杉木(包括幼龄林、中龄林、成熟林3个龄组)3个典型树种,进行实地光谱测量和采样,室内分析其光谱特征。光谱测量采用美国ASD公司生产FieldSpec HandHeld光谱仪,波长范围为325920 nm。光谱测定选择在晴朗无风的正午进行。对每一树种冠层的光谱重复测定10次,取均值作为该树种的反射光谱[17]。测定光谱数据后,通过光谱处理软件ViewSpecPro对测得的原始光谱数据进行筛选,去除无效和错误的数据,用以后续分析。
2.2 影像分割和属性提取
面向对象的分类方法能避免受太阳光照、地形和观测角度影响导致的误差[18]。采用eCognition软件多尺度分割工具对待分类影像进行多尺度分割。其中,NDVI是植被生长状态及植被覆盖度的最佳指示,将权重设置为2,GF-2各光谱波段权重为1,DEM、坡度和坡向不参与分割。固定形状权重为0.1,紧致度权重为0.5,分割尺度阈值范围为50800,步长为50。根据影像是否过分割或者欠分割,目视判读分割结果,确定研究区GF-2影像的适宜分割尺度阈值为200。
表1 面向对象的影像属性提取
Tab.1
| 类型 | 属性 | 参与 波段 | 纹理 方向 | 属性 数量 |
|---|---|---|---|---|
| 光谱 | 最小像元值(minimum pixel value,MIN) | Blue,Green,Red,NIR,NDVI | — | 25 |
| 最大像元值(maximum pixel value) | ||||
| 像元均值(mean) | ||||
| 像元标准差(standard deviation,SD) | ||||
| 像元偏度(skewness) | ||||
| 纹理 | 同质性(homogeneity,HOM) | Blue,Green,Red,NIR | 全方向 | 32 |
| 对比度(contrast,CON) | ||||
| 非相似性(dissimilarity,DIS) | ||||
| 熵(entropy,ENT) | ||||
| 4方向 | 128 | |||
| 纹理均值(mean,MEA) | ||||
| 纹理标准差(standard deviation,STD) | ||||
| 相关性(correlation,COR) | ||||
| 角二阶矩(angular second moment,ASM) | ||||
| 辅助数据 | 最小像元值(minimum pixel value,MIN) | DEM,坡向(Aspect),坡度(Slope) | — | 15 |
| 最大像元值(maximum pixel value) | ||||
| 像元均值(mean) | ||||
| 像元标准差(standard deviation,SD) | ||||
| 像元偏度(skewness) |
面向对象提取的光谱、纹理和辅助数据属性达200个,一方面属性之间存在高度的相关性,另一方面数据冗余对分类器而言也是灾难[20],因此需要进行属性的选择。属性选择采用Weka统计软件,分2步进行[21]: ①采用单个属性评估器GainRatioAttributeEval + Ranker,通过属性的信息增益率来评估属性对目标类别的重要性; ②采用属性子集评估器WrapperSubsetEval + BestFirst包装器方法,基于随机森林分类器来评估属性子集,对每个属性子集采用交叉验证估计学习方案的准确性。随机森林法需要设置2个参数: 基分类器采用的属性数K和决策树的数量I。采用Weka软件提供的元学习器CVParameterSelection优化训练数据交叉验证的准确性,搜索以获得最佳的K和I。筛选出的最优属性集内部相关性最低,参数优化得到最有利于分类的参数设置。
2.3 分类器及分类方案
为定量分析光谱、纹理和辅助数据在树种分类中的作用,根据光谱属性、纹理属性和辅助数据不同组合的7种方案进行分类。光谱属性是遥感分类中常用的属性,将光谱属性分别与4方向纹理、全方向纹理进行结合(方案2和3),对比仅采用光谱属性(方案5)和仅采用纹理属性(方案6和7)的分类结果,探索研究区树种分类精度最高的分类方案。辅助数据参与分类(方案1和4)用于判断地形因素是否影响研究区的树种分布。不同分类方案及其属性数量如表2所示。
表2 不同分类方案及其属性数量
Tab.2
| 分类方案 | 属性类型 | 属性数量 |
|---|---|---|
| 方案1 | 光谱+4方向纹理+辅助数据 | 25+128+15=168 |
| 方案2 | 光谱+4方向纹理 | 25+128=153 |
| 方案3 | 光谱+全方向纹理 | 25+32=57 |
| 方案4 | 光谱+辅助数据 | 25+15=40 |
| 方案5 | 光谱 | 5×5=25 |
| 方案6 | 4方向纹理 | 8×4×4=128 |
| 方案7 | 全方向纹理 | 8×4=32 |
2.4 结果分析及精度评价
采用F值进行精度评价,其将制图精度和用户精度合并为一个量,并趋向于接近制图精度和用户精度中比较小的那个值。F值高则可以确保制图精度和用户精度都较高。F的计算公式为
式中: UA为用户精度; PA为制图精度。
3 结果与分析
3.1 树种光谱特征分析
图1为研究区5种树种(龄组)冠层光谱曲线。
图1
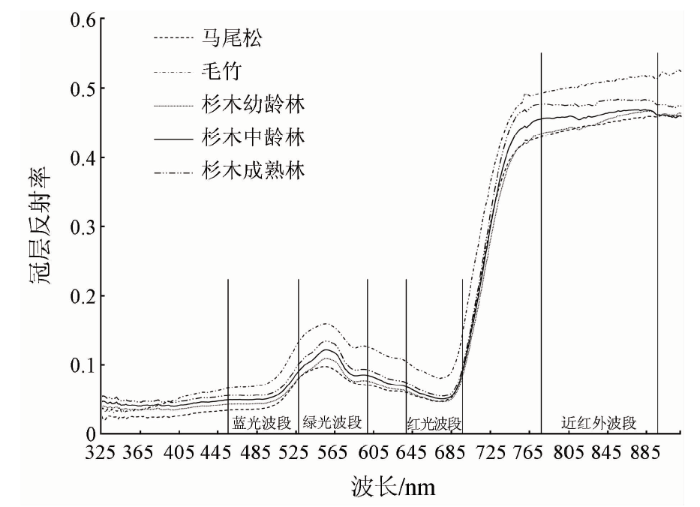
图1
将乐林场5种树种(龄组)冠层光谱曲线
Fig.1
Canopy spectral curves of five tree species in Jiangle forest farm
从图1中可见,5种树种(龄组)冠层光谱曲线的趋势大致相同。可见光波段490 nm和680 nm附近,存在叶绿素强烈吸收的蓝光吸收带和红光吸收带,反射率分别为0.040.09和0.050.10; 在540560 nm附近出现“绿峰”,反射率达到0.100.16; 近红外波段位于685760 nm光谱区形成“红边”反射陡坡,其光谱反射率值随波长从小于0.10急剧升高至0.42以上。从树种光谱特征差异上看: 在可见光和近红外波段,毛竹的冠层反射率高于杉木各龄组和马尾松,且在560670 nm和760 nm之后差异显著。5种树种(龄组)的“红边”高度和斜率存在差异,斜率上表现为杉木成熟林>杉木中龄林>毛竹>马尾松>杉木幼龄林,“红边”高度上表现为毛竹>杉木成熟林>杉木中龄林>杉木幼龄林>马尾松。结合实测光谱曲线和GF-2波段范围,绿光波段和近红外波段信息是马尾松、毛竹和杉木龄组区分的关键波段。
3.2 属性筛选及参数优化
采用Weka软件中的属性子集评估器WrapperSubsetEval + BestFirst包装器和随机森林分类器进行最优属性子集的筛选,通过元学习器CVParameterSelection进行参数优化,依次筛选出7种分类方案下的最优属性集及其参数。筛选结果及参数优化如表3所示。
表3 不同分类方案下属性筛选及参数优化
Tab.3
| 分类方案 | 最优属性子集包含的属性① | 最优属性数/ 属性总数 | 随机森林参数优化 | |
|---|---|---|---|---|
| K | I | |||
| 1 | mean_NDVI; mean_NIR; SD_NDVI; SD_Blue; skewness_Green; HOM_0_NIR; COR_45_NIR; COR_45_Green; DIS_135_Green; mean_Aspect | 10/168 | 5 | 1 200 |
| 2 | mean_NDVI; mean_NIR; SD_NDVI; SD_Blue; skewness_Green; HOM_0_NIR; COR_45_NIR; COR_45_Green; DIS_135_Green | 9/153 | 4 | 100 |
| 3 | mean_NDVI; mean_NIR; SD_NDVI; SD_Blue; skewness_Blue; CON_All_Red; CON_All_Blue; DIS_All_NIR; DIS_All_Blue; COR_All_NIR; COR_All_Red | 11/57 | 3 | 1 100 |
| 4 | mean_NDVI; mean_NIR; SD_NDVI; SD_Blue; skewness_Green; skewness_Blue; mean_Aspect; SD_DEM | 8/40 | 3 | 1 600 |
| 5 | MIN_Green; mean_NDVI; mean_NIR; SD_NDVI; SD_Blue; skewness_Green; skewness_Blue | 7/25 | 3 | 3 000 |
| 6 | HOM_0_NIR; COR_45_NIR; COR_45_Green; DIS_135_Green; COR_135_Red; COR_135_NIR; COR_135_Blue | 7/128 | 3 | 3 000 |
| 7 | CON_All_Red; CON_All_Blue; DIS_All_NIR; DIS_All_Green; DIS_All_Blue; COR_All_NIR; COR_All_Red | 7/32 | 3 | 100 |
①mean_NDVI表示NDVI波段的光谱均值; COR_45_NIR表示近红外波段在45°方向的相关性纹理值,依此类推。
属性筛选及参数优化结果可知,7种分类方案的最优属性子集特征数为711个,基分类器分类使用的属性数为35个,生成的基分类器决策树数量最小100棵,最多达到3 000棵。从最优属性子集包含的属性分析,光谱属性中mean_NDVI,mean_NIR,SD_NDVI,SD_Blue,skewness_Green和skewness_Blue,4方向纹理中HOM_0_NIR,COR_45_NIR,COR_45_Green和DIS_135_Green,以及全方向纹理中CON_All_Red,CON_All_Blue,DIS_All_NIR,DIS_All_Blue,COR_All_NIR和COR_All_Red被反复筛选出来作为最优属性子集。这些属性特征表征了杉木、马尾松和毛竹在光谱和纹理属性上的差异所在。辅助数据中mean_Aspect和SD_DEM属性反映了坡向均值和高程在树种分布上的影响。
3.3 分类精度及定量分析
图2为7种分类方案树种分类结果的F精度统计。由分类结果可知,结合光谱和纹理属性(方案1—3)显著提高了树种识别以及龄组划分的精度。结合4方向纹理属性(方案2)总体精度为87.4%,优于结合全方向纹理(方案3)85.2%的分类精度。仅采用光谱属性分类(方案5)较单独采用纹理属性(方案6和7)分类精度提高达15.0%以上。地形因素中的坡向和高程对总体精度的影响小于1%。各树种分类精度上,马尾松的分类精度最高,仅采用纹理属性(方案6和7)识别马尾松的精度低于80%,但仅采用光谱属性的分类精度(方案5)高达94.2%。采用光谱结合4方向纹理、辅助数据的方案1总体精度最高,为88.0%,Kappa系数为0.86,各树种分类精度依次为: 马尾松>杉木幼龄林>毛竹>杉木成熟林>杉木中龄林。
图2
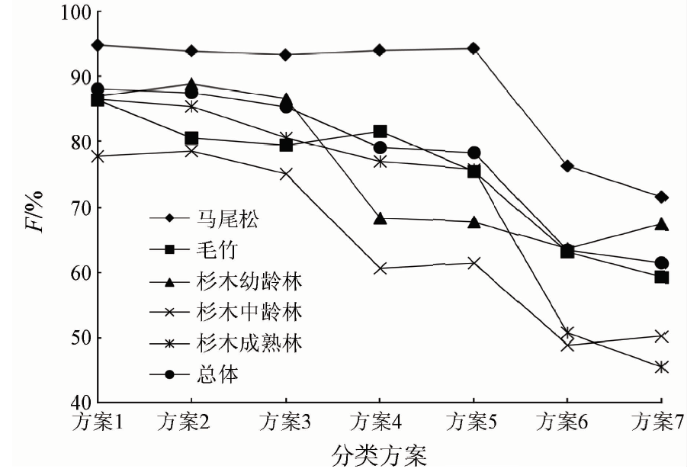
基于仅利用光谱属性的方案5进行差值计算,定量分析2种纹理属性和辅助数据对树种分类精度的影响。仅利用光谱属性识别5种树种(龄组)的总体分类精度为78.4%,Kappa系数为0.75; 杉木3种龄组之间混分严重,中龄林的分类精度仅为61.5%。加入全方向纹理属性(方案3)和4方向纹理属性后(方案2),总体分类精度分别提高6.8%和9.0%。从杉木龄组上分析,全方向纹理属性加入后杉木幼龄林、中龄林和成熟林分类精度分别提高了18.7%,13.5%和4.7%,加入4方向纹理属性后分类精度分别提高21.0%,17.0%和9.5%。分析原因,随着杉木林年龄的增长,冠形越来越开阔且相邻树冠间互相交织密不可分,因此纹理上的可分性逐渐降低。对杉木的龄组而言,4方向纹理属性对分类精度的贡献大于全方向纹理。加入纹理属性使得马尾松的分类精度分别下降1.0%和0.4%(方案2和3),说明纹理的优势并未很好地体现在马尾松的识别方面,马尾松的分类不必加入纹理属性。
辅助数据参与分类(方案1和4)总体精度分别比未参与时增加了0.6%。坡向对毛竹的分类精度影响大于5%,但对马尾松和杉木的精度影响很小。研究区的人为经营活动是影响树种分布的关键,就树种分类而言地形因素可以忽略不计。
3.4 混淆矩阵和分类结果
排除地形因素,光谱+4方向纹理(方案2)的分类精度最高,为87.4%,Kappa系数为0.85。该方案混淆矩阵和制图精度、用户精度计算结果如表4所示。
表4 基于GF-2影像的树种分类混淆矩阵
Tab.4
| 树种 | 马尾松 | 毛竹 | 杉木 幼龄林 | 杉木 中龄林 | 杉木 成熟林 |
|---|---|---|---|---|---|
| 马尾松 | 92 | 4 | 0 | 0 | 3 |
| 毛竹 | 2 | 54 | 9 | 4 | 0 |
| 杉木幼龄林 | 0 | 4 | 86 | 5 | 0 |
| 杉木中龄林 | 0 | 2 | 4 | 49 | 7 |
| 杉木成熟林 | 3 | 0 | 0 | 5 | 52 |
| 制图精度/% | 94.8 | 84.4 | 86.9 | 77.8 | 83.9 |
| 用户精度/% | 92.8 | 77.0 | 90.8 | 79.2 | 86.8 |
由表4可知: ①马尾松的分类效果较毛竹和杉木龄组而言效果较好,制图精度和用户精度均优于90%,从影像上分析,混分的情况主要发生在阴影区域的毛竹和杉木成熟林; ②毛竹与马尾松、杉木幼、中龄林存在混分现象; ③杉木相邻龄组混分现象比较严重,幼龄林有5.3%被分为中龄林,中龄林中有6.5%和11.3%被分类为幼龄林和成熟林,成熟林有8.3%被分为中龄林,相邻龄组之间无法有效区分是造成杉木各龄组分类精度较低的主要原因,幼龄林和成熟林之间不存在任何混分现象。
定性地观察影像的分类结果(图3),面向对象分类结果有效避免了“椒盐噪声”现象。通过目视解译和林相图对比发现,分类效果比较理想,表现出杉木、马尾松和毛竹原本的分布趋势。杉木和马尾松主要为人工种植,分类后在影像上表现为大面积斑块集中分布; 毛竹常为小面积块状或带状分布于低海拔山沟和房前屋后; 其他阔叶林零星分布在林分间隙。分类结果符合实际。
图3
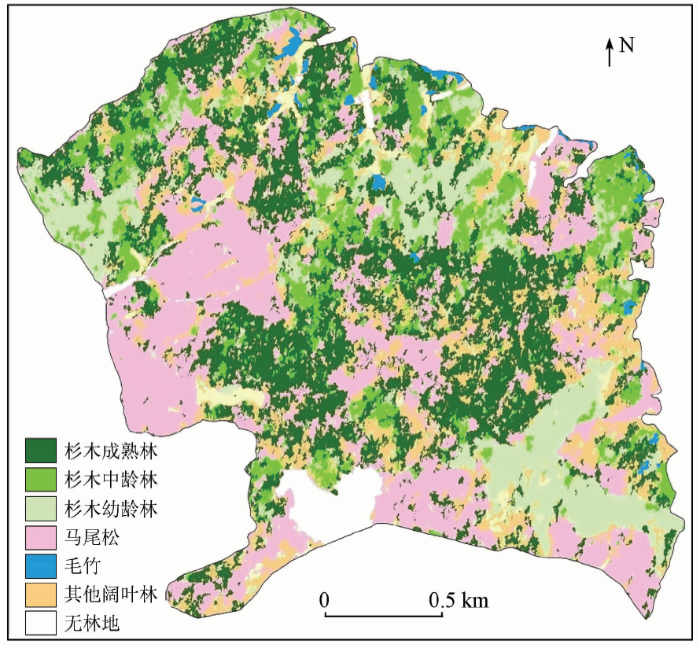
图3
面向对象的随机森林分类结果
Fig.3
Results of object-oriented random forest classification
4 结论
本研究基于国产高空间分辨率的GF-2影像和随机森林法对南方集体林区的马尾松、毛竹及杉木的3个龄组进行分类,为GF-2影像应用于南方集体林区森林资源调查和管理提供了借鉴。研究结论如下:
1)光谱结合4方向纹理的分类方案总体精度为87.4%,Kappa系数为0.85,马尾松、毛竹和杉木3个龄组得到了有效分类。杉木相邻龄组存在混分现象,幼龄林和成熟林完全区分。表明GF-2数据在树种识别及龄组划分上具有很大潜力,是林分尺度森林资源调查的理想数据源。
2)实测树种的冠层光谱曲线,各树种在光谱上反射率差异明显,光谱曲线“红边”高度和斜率存在差异,表现为杉木成熟林>杉木中龄林>毛竹>马尾松>杉木幼龄林。结合GF-2影像波段设置,表明绿光波段和近红外波段是马尾松、毛竹和杉木龄组区分的关键。
4)树种的生长形态和冠层特征决定纹理属性对分类的影响。纹理属性对马尾松的分类精度影响很小,但有利于杉木幼龄林和中龄林分类精度的提高。
利用高空间分辨率影像进行树种分类依然存在着许多新的挑战。本研究的不足之处在于未考虑马尾松、杉木和毛竹的混交情况以及研究区其他常绿阔叶树种的分类。不同纹理属性如何影响树种分类精度的机理还需要进一步深入探索。
参考文献
Improved Landsat-based forest mapping in steep mountainous terrain using object-based classification
[J].
DOI:10.1016/S0378-1127(03)00113-0
URL
[本文引用: 1]

The accuracy of forest stand type maps derived from a Landsat Thematic Mapper (Landsat TM) image of a heterogeneous forest covering rugged terrain is generally low. Therefore, the first objective of this study was to assess whether topographic correction of TM bands and adding the digital elevation model (DEM) as additional band improves the accuracy of Landsat TM-based forest stand type mapping in steep mountainous terrain. The second objective of this study was to compare object-based classification with per-pixel classification on the basis of the accuracy and the applicability of the derived forest stand type maps. To fulfil these objectives different classification schemes were applied to both topographically corrected and uncorrected Landsat TM images, both with and without the DEM as additional band. All the classification results were compared on the basis of confusion matrices and kappa statistics. It is found that both topographic correction and classification with the DEM as additional band increase the accuracy of Landsat TM-based forest stand type maps in steep mountainous terrain. Further it was found that the accuracies of per-pixel classifications were slightly higher, but object-based classification seemed to provide better overall results according to local foresters. It is concluded that Landsat TM images could provide basic information at regional scale for compiling forest stand type maps especially if they are classified with an object-based technique.
Modeling forest stand structure attributes using Landsat ETM+ data:Application to mapping of aboveground biomass and stand volume
[J].
DOI:10.1016/j.foreco.2006.01.014
URL
[本文引用: 1]
Maps of aboveground biomass (AGB) and stand volume are of interest to determine their magnitude and spatial distribution over forested areas, and required for input to forecasting carbon budgets and ecosystem productivity. Deriving estimates of AGB and volume requires information about species composition and forest stand structure. This paper introduces a method called BioSTRUCT ( Biomass estimation from stand STRUCTture), which is based on georeferenced field plots to generate empirical relationships between continuous estimates of forest structure attributes and remote sensing image data represented as spectral response variables. In this study, height and crown closure attributes were modeled from Landsat ETM+ image and field plot data. These modeled attributes were then used as inputs to stand-level models of AGB and volume. The image height model had an adjusted R 2 of 0.65 from ETM+ bands 3, 4, and 5. Likewise, the crown closure model had an adjusted R 2 of 0.57 using ETM+ bands 3, 4, and 7. Average AGB estimates were within 4 tonnes/ha and stand volume was within 4 m 3/ha of field plot values, statistically similar to a validation sample data set for both AGB ( p = 0.61) and stand volume ( p = 0.65), and within the range of previous published studies. Field plot distribution, error propagation, and extending models over multiple images were identified as factors requiring further investigation in order to apply BioSTRUCT over larger geographic areas.
Estimation of tropical forest structure from SPOT-5 satellite images
[J].
DOI:10.1080/01431160903095460
URL
[本文引用: 1]
Predictions of tropical forest structure at the landscape level still present relatively high levels of uncertainty. In this study we explore the capabilities of high-resolution Satellite Pour l'Observation de la Terre (SPOT)-5 XS images to estimate basal area, tree volume and tree biomass of a tropical rainforest region in Chiapas, Mexico. SPOT-5 satellite images and forest inventory data from 87 sites were used to establish a multiple linear regression model. The 87 0.1-ha plots covered a wide range of forest structures, including mature forest, with values from 74.7 to 607.1 t ha611. Spectral bands, image transformations and texture variables were explored as independent variables of a multiple linear regression model. The R2s of the final models were 0.58 for basal area, 0.70 for canopy height, 0.73 for bole volume, and 0.71 for biomass. A leave-one-out cross-validation produced a root mean square. error (RMSE) of 5.02 m2 ha611 (relative RMSE of 22.8%) for basal area; 3.2202m (16.1%) for canopy height; 69.08 m3 ha611 (30.7%) for timber volume, and 59.3 t ha611 (21.2%) for biomass. In particular, the texture variable ‘variance of near-infrared’ turned out to be an excellent predictor for forest structure variables.
Estimation of forest structural parameters using 5 and 10 meter SPOT-5 satellite data
[J].
DOI:10.1016/j.rse.2009.05.009
URL
[本文引用: 1]
Large areas of forest in the US and Canada are affected by insects and disease each year. Over the past century, outbreaks of the Eastern spruce budworm have become more frequent and severe. The notion of designing a more pest resistant landscape through prescriptive management practices hinges on our ability to effectively model forest–insect dynamics at regional scales. Increasingly, more detailed pixel-wise estimates of forest biophysical parameters are needed for such endeavors. Lidar technology, although promising, is not yet viable for repeated regional accounting, necessitating the development of methods which take advantage of existing spaceborne assets. Our objective is to use one of these assets (SPOT-5) to estimate a large set of forest structural attributes at a finer spatial grain size (502m and 1002m) over a broader area than is currently available for the purpose of supplying needed input data for disturbance simulation modeling. We employ neighborhood statistics (standard deviation, variance, sill variance, and ratios of these metrics at 5 and 1002m) calculated from SPOT-5 sensor data and derivatives to estimate and map tree canopy diameter (CDIA), bole diameter at breast height (DBH), tree height (HT), crown closure (CC), vertical length of live crown (LC), and basal area (BA). A partial least squares (PLS) regression approach was used with these local statistics and field data to produce models for pixel-wise estimation and mapping of mean values, respectively, for hardwood and coniferous forest CDIA ( R 2 = 0.82 and 0.93, RMSE 0.62 and 0.4702m), DBH ( R 2 = 0.82 and 0.90, RMSE 2.92 and 3.7502cm), HT ( R 2 = 0.69 and 0.92, RMSE 1.27 and 1.5902m), CC ( R 2 = 0.52 and 0.68, RMSE 5.49 and 6.02%), LC ( R 2 = 0.58 and 0.81, RMSE 0.96 and 1.2502m), and BA ( R 2 = 0.71 and 0.74, RMSE 2.47 and 4.5802m 2 ha 61 1) for a 360002km 2 area in northeast Minnesota. This approach for quantifying forest structure is robust in the sense that a detailed forest cover type map is not required to stratify analysis at any step in the process. Hence, we show that multi-resolution SPOT-5 data are a practical alternative to lidar for regional characterization of forest biophysical parameters. However, lidar data may potentially be used to calibrate these SPOT-based structure models in the future.
Tree species classification with random forest using very high spatial resolution 8-band WorldView-2 satellite data
[J].DOI:10.3390/rs4092661 URL [本文引用: 1]
A comparative analysis of high spatial resolution IKONOS and WorldView-2 imagery for mapping urban tree species
[J].
DOI:10.1016/j.rse.2012.06.011
URL
[本文引用: 1]
78 High spatial/spectral resolution data are vital to mapping tree species. 78 WorldView-2 has a great potential to improve the vegetation classification. 78 WorldView-2 outperforms IKONOS for identifying tree species/groups. 78 A stepwise masking system is effective for mapping tree species.
基于递归纹理特征消除的WorldView-2树种分类
[J].
DOI:10.13332/j.1000--1522.20140311
URL
[本文引用: 2]
】 利用遥感影像识别树种是一个尚未解决的科学难题,传统方法在高分辨率影像树种分类中存在着诸多不适宜问题。本文通过提取WorldView-2影像的纹理特征构造高维数据,利用递归特征消除降低数据维数,逐步解除最大似然分类的休斯现象,并将有代表性的纹理特征集合与光谱特征结合,对树种进行分类。结果显示:在递归消除8个纹理特征后,最大似然的休斯现象达到了很好的规避;在结合光谱特征后,分类的总体精度达到了86.39%,Kappa系数达到了0.841 0,比基于光谱特征的总体精度和Kappa系数高12.32%和0.143 6。研究表明,在高维数据中通过递归特征消除规避最大似然分类的休斯现象,充分结合影像纹理与光谱信息对树种分类可以取得更为理想的结果。
Tree species classification using WorldView-2 images based on recursive texture feature elimination
[J].
基于树种分类的高分辨率遥感数据纹理特征分析
[J].
DOI:10.3969/j.issn.2095-0756.2012.02.010
URL
Magsci
[本文引用: 1]
遥感图像尤其是高分辨率(1~4 m)遥感图像在树种分类方面有着广阔的应用前景。利用主成分分析法对遥感数据去相关分析,然后通过对纹理提取过程的分析,探讨不同移动窗口大小对纹理特征的影响,以期为中山陵园风景区的森林调查提供依据,分类方法为经典的最大似然分类器。根据不同移动窗口大小的纹理因子相关性和对保持纹理信息丰富度的影响,来选择合适的窗口大小及纹理因子组合,以对树种分类精度的提高程度为评价标准。研究结果表明,利用窗口大小为19 × 19下的纹理信息可有效提高分类精度,总精度达到66%,Kappa系数达到0.59,比单纯的光谱信息最大似然法图像分类精度高,其中均值与均匀性、对比度、偏斜度纹理因子组合为最佳纹理组合,能有效减少数据冗余。高分辨率遥感数据纹理信息的运用为树种分类识别时的特征选择提供了有利技术参考。图4表3参19
High-resolution remote sensing of textural images for tree species classification
[J].
Texture analysis of IKONOS panchromatic data for Douglas-fir forest age class separability in British Columbia
[J].
DOI:10.1080/01431160120769
URL
[本文引用: 1]
This Letter presents the results of textural separability tests obtained by first- and second-order texture methods on different aged Douglas-fir stands in IKONOS panchromatic imagery acquired 3 June 2000 over the Sooke River watershed in British Columbia. The effects of different measures and window sizes on the textural separability are discussed. Small windows sizes were not as effective in separating stands as larger windows sizes. Second-order (spatial co-occurrence homogeneity) texture values were the most effective in distinguishing between age classes. A first-order (variance) texture measure, though still useful, provided less separability.
Forest cover classification by optimal segmentation of high resolution satellite imagery
[J].
DOI:10.3390/s110201943
URL
PMID:22319391
[本文引用: 1]
This study investigated whether high-resolution satellite imagery is suitable for preparing a detailed digital forest cover map that discriminates forest cover at the tree species level. First, we tried to find an optimal process for segmenting the high-resolution images using a region-growing method with the scale, color and shape factors in Definiens03Professional 5.0. The image was classified by a traditional, pixel-based, maximum likelihood classification approach using the spectral information of the pixels. The pixels in each segment were reclassified using a segment-based classification (SBC) with a majority rule. Segmentation with strongly weighted color was less sensitive to the scale parameter and led to optimal forest cover segmentation and classification. The pixel-based classification (PBC) suffered from the “salt-and-pepper effect” and performed poorly in the classification of forest cover types, whereas the SBC helped to attenuate the effect and notably improved the classification accuracy. As a whole, SBC proved to be more suitable for classifying and delineating forest cover using high-resolution satellite images.
Random forest classification of mediterra -nean land cover using multi-seasonal imagery and multi-seasonal texture
[J].DOI:10.1016/j.rse.2011.12.003 URL [本文引用: 1]
Exploitation of very high resolution satellite data for tree species identification
[J].DOI:10.14358/PERS.70.1.135 URL [本文引用: 1]
基于对象的QuickBird遥感图像多层次森林分类
[J].<p>随着高空间分辨率、相对低光谱分辨率的新型遥感图像的出现和普及,基于像元、依赖于光谱信息特征的传统遥感分类方法已不能很好地适应新型数据的分类工作。通过应用面向对象的多层次分割分类方法对广东省黑石顶自然保护区的QuickBird遥感图像进行了分类尝试。分类结果显示相对于传统的基于像元的分类方法,基于对象的多层次方法具有更准确的分类结果、更明确的分类边界和更均一的内部同质性。</p>
Multi-level forest classification of QuickBird remote sensing image based on objects
[J].
高分二号卫星的技术特点
[J].
The technical features of the GF-2 satellite
[J].
有理函数模型在光学卫星影像几何纠正中的应用
[J].
Application of RFM in geometric rectification of optical satellite image
[J].
高分二号卫星影像融合及质量评价
[J].<p>高分二号卫星(GF-2)是我国自主研制的首颗空间分辨率优于1 m的民用光学遥感卫星,配备有0.81 m空间分辨率的全色相机和3.24 m空间分辨率的多光谱相机。对比分析适合GF-2影像的融合方法对于提高其应用效果与扩大应用领域具有实际意义。针对东北地区2014年11月22日和27日成像的GF-2影像,分别采用主成分分析(principal component analysis,PCA)、GS (Gram-Schmidt)变换、modified-HIS (intensity hue saturation)变换、高通滤波方法(high pass filter,HPF)和超球体色彩空间变换(hyperspherical color space resolution merge,HCS)等5种融合方法对多光谱和全色数据进行融合。并对5种融合影像进行质量评价,首先采用目视分析方法进行定性评价,其次采用信息熵、平均梯度、相关系数和光谱扭曲度等统计学指标进行客观定量评价,最后对融合影像进行地物分类。结果表明,HCS与GS变换融合影像无论是在视觉还是在地物分类应用上都具有较好的效果,且没有波段数的限制,最适合GF-2影像融合;HPF方法对空间细节信息的增强仅次于HCS变换,但是其光谱保真度效果最差;PCA和modified-IHS变换融合效果比较适中,可以作为GF-2影像融合的候补方法。</p>
Research on fusion of GF-2 imagery and quality evaluation
[J].
福建将乐林场主要树种冠层光谱反射特征分析
[J].
Spectral reflectance characteristics of canopies of main tree species in Jiangle forest farm in Fujian
[J].
结合高分辨率遥感影像多维特征的森林分类
[D].
The Forest Classification Combining Multidimensional Features Based on High-resolution Remote Sensing Images
[D].
Laws纹理能量结合灰度共生矩阵的遥感影像面状地物提取
[J].
Polygon feature extraction of remote sensing image based on Laws texture energy and gray level co-occurrence matrix
[J].
The effect of unlabeled samples in reducing the small sample size problem and mitigating the Hughes phenomenon
[J].DOI:10.1109/36.312897 URL [本文引用: 1]
随机森林方法研究综述
[J].
A review of technologies on random forests
[J].
随机森林算法优化研究
[D].
Study on Optimization of Random Forests Algorithm
[D].
An assessment of the effectiveness of a random forest classifier for land-cover classification
[J].DOI:10.1016/j.isprsjprs.2011.11.002 URL [本文引用: 1]
Random forests for land cover classification
[J].DOI:10.1016/j.patrec.2005.08.011 URL [本文引用: 1]
基于小波变换和随机森林的森林类型分类研究
[J].
Classification of forest types based on discrete wavelet transform and random forests from GF-1 images
[J].
基于随机森林模型的陆地卫星-8遥感影像森林植被分类
[J].
Forest vegetation classification of Landsat-8 remote sensing image based on random forests model
[J].
一种基于混淆矩阵的分类器选择方法
[J].
A method of classifier selection based on confusion matrix
[J].
Tree species classification in the Southern Alps with very high geometrical resolution multispectral and hyperspectral data
[C]//
