

0 引言
生态红线是指为维护国家或区域生态安全和可持续发展,根据生态系统完整性和连通性的保护需求,划定的需实施特殊保护的区域[1]。为实现对生态红线区管理和保护成效的科学评定,开展生态红线区生态资源调查与监测工作具有重要意义。传统的野外调查手段存在着周期长、成本高、效率低的缺点,难以对大范围的生态红线区进行精准监测。遥感技术以其空间连续覆盖、观测周期短和较低投入成本等优势,广泛应用于生态保护区域的生态监测领域。如采用Landsat长时间序列数据,构建时序分析模型,重建森林的生态扰动或恢复信息[2,3,4,5]、对地表覆盖进行连续变化检测和分类[6]; 或提取归一化植被指数(normalized difference vegetation index,NDVI)或增强植被指数(enhanced vegetation index,EVI)等反映植被物候变化的遥感指数,进而分析生态保护区域的气候变化[7,8,9]; 通过集成各种遥感指数综合表征生态环境质量[10]; 利用遥感解译的土地利用/覆被数据计算生态服务价值[11]等。上述研究大多以中低空间分辨率遥感影像为数据源,很难探测到空间细节变化。然而,生态红线的保护属于绝对意义上的保护,一级管控区内严禁一切形式的开发建设活动[12],中低空间分辨率影像不能快速准确地获取土地覆盖细节变化,难以满足生态红线的精准监测需求。
高空间分辨率遥感影像(以下简称高分影像)具有丰富的空间细节信息,几何和纹理特征更加明显,为获取精细化的地表覆盖信息提供了理想数据源。国际上应用较普遍的高分影像有IKONOS,QuickBird,SPOT,WorldView系列等[13],由于其价格昂贵,受数据获取、数据覆盖能力的制约,难以开展长期稳定的动态监测研究。随着国产高分影像的不断丰富,国内学者逐步选择高分、资源等系列国产影像开展研究[14,15]。中国南方地区由于长期受到多云多雨气候的影响,1 a内难以获取连续覆盖大范围的高质量遥感影像,因此在具体的应用中需要综合考虑遥感影像的时、空分辨率平衡问题。与传统大卫星相比,小卫星以其研制周期短、成本低廉、重访周期短等优点,为资源环境调查与监测提供实时数据[16,17]。“北京二号”小卫星星座由3颗光学遥感卫星组成,全色和多光谱影像空间分辨率分别为0.8 m和3.2 m,重访周期为1 d,可为生态红线区精准动态监测提供空间与时间分辨率俱佳的数据产品。
南京市属于快速城市化地区,土地利用/覆盖变化速度较快,不合理的开发建设活动导致区域资源环境承载力的下降。为维护区域生态安全,南京市于2013年编制并实施了《南京市生态红线区域保护规划》,其中划定的生态红线区域占地面积达到2 024.49 km2。由于南京市地处多云多雨的长江下游地区,1 a内可获取的晴空观测遥感数据不足。本文以高时空分辨率的北京二号遥感影像为数据源,采用面向对象的分类方法,获取精细化的地表覆盖信息,并探索多时相数据支持下的生态红线地表覆盖空间细节变化监测方法。
1 研究区概况与数据源
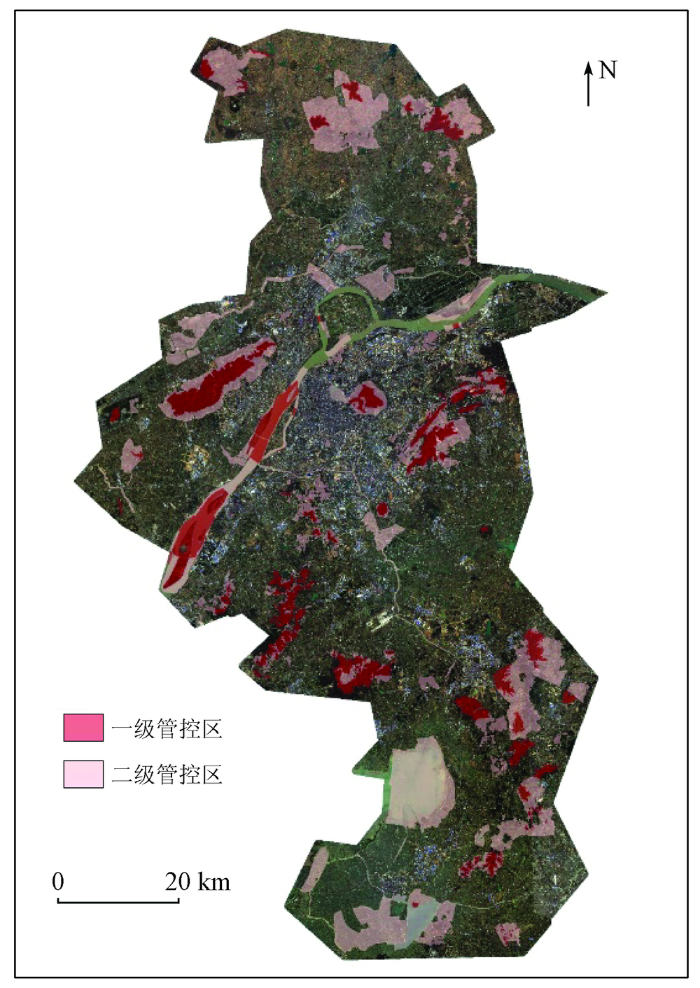
南京市地处中国东部、长江下游,是中国东部地区重要的中心城市之一。南京市生态红线区(图1)涵盖自然保护区、风景名胜区、森林公园等12种类型,包括南京老山森林公园、汤山国家地质公园、止马岭自然保护区等111处生态保护区域。生态红线区土地覆盖类型主要以林地、水体、耕地为主,总面积达到2 024.49 km2。其中,一级管控区占地432.11 km2,二级管控区占地1 592.38 km2。
图1
数据源为北京二号遥感数据和生态红线区矢量数据。其中北京二号数据获取时间为2017年5—7月间,选择此时间段的影像是为了能够有效提取植被信息。卫星影像共有37景,基本覆盖整个研究区。北京二号卫星基本参数见表1。生态红线区矢量数据为面数据,属性包含主体功能、名称、面积、区属、类型等。
表1 北京二号卫星参数
Tab.1
| 类型 | 参数 |
|---|---|
| 空间分辨率 | 全色: 0.8 m; 多光谱: 3.2 m |
| 重复观测周期 | 1 d |
| 波段范围 | 蓝: 440~510 nm; 绿: 510~590 nm; 红: 600~670 nm; 近红外: 760~910 nm; 全色: 450~650 nm |
数据预处理流程包括辐射校正、正射校正、几何纠正等,并采用最邻近扩散(nearest neighbor diffusion,NND)融合方法对3.2 m多光谱波段和0.8 m全色波段进行了数据融合。
2 基于面向对象的南京生态红线区地表覆盖分类
根据对生态红线区地表覆盖的野外调查和对北京二号高分影像的目视判别,顾及到其地表覆盖类型与分布情况,将生态红线区地表覆盖分为耕地、林地、草地、水体、建筑物、道路、人工堆掘地等7个类型。面向对象的遥感影像分类方法主要包含2个重要步骤和技术难点: 一是图像分割,要保证分割后的对象尺度合理,语义特征丰富,满足后续图像分类要求; 二是基于对象的特征提取,保证输入分类器的特征集能够有效区分各类地物。
2.1 影像多尺度分割
影像分割是面向对象分类的前提,分割尺度参数的选择对分类精度有着很大影响[27]。eCognition软件支持的分形网络演化方法( fractal net evolution approach,FNEA)是目前使用较广泛的一种多尺度图像分割算法,主要包括分割尺度、光谱因子权重和紧凑度权重3个参数。南京生态红线区内部的地物类型比较复杂,有类型简单、地块面积大的地区(如长江、森林公园等),也有地块分布较为破碎的区域(如城镇、村庄等)。因此,针对地表类型不同的区域,需要选择不同的分割参数以达到最佳分割效果[28]。通过对研究区内北京二号高分影像的目视解译,本文将研究区大致归纳为4种主要地表覆盖类型,通过反复实验得到各类型对应的最佳分割参数,参数设置如表2所示,最佳尺度下的影像分割效果如图2所示。
表2 各地表覆盖类型最佳分割参数
Tab.2
| 类别 序号 | 主要地表覆盖类型 | 分割 尺度 | 光谱因 子权重 | 紧凑度 权重 |
|---|---|---|---|---|
| 1 | 林地、草地为主的植被覆盖地表 | 85 | 0.1 | 0.5 |
| 2 | 建筑物、道路、人工堆掘地为主的人工地表 | 85 | 0.2 | 0.5 |
| 3 | 水体为主的地表 | 90 | 0.2 | 0.5 |
| 4 | 耕地为主的地表 | 75 | 0.1 | 0.5 |
图2
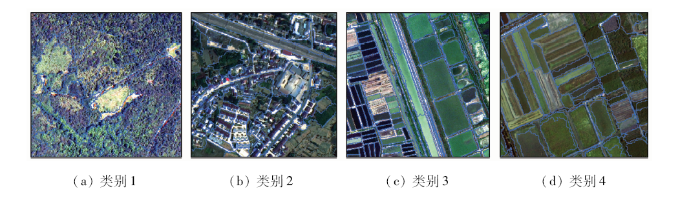
图2
最佳分割参数下各地表覆盖类型分割效果
Fig.2
Image segmentation results using the optimal parameters of each land-cover type
2.2 基于对象的特征提取
基于对象的影像特征可分为光谱、形状和纹理等类型。本文提取了各个对象的波段均值、亮度、最大化差异度量等3个光谱特征。与基于像素分类方法相比,面向对象分类的一大优势体现在形状特征的加入可以有效提升某些地类的分类精度[22]。本文选取的形状特征包括长宽比、紧凑度、密度、形状指数等4个指标。纹理特征描述了图像灰度级别的分布和关系,灰度共生矩阵(gray level co-occurrence matrices, GLCM)能够很好地描述像素对的联合概率分布,对改善影像分类精度方面效果显著[29]。在经过对比试验后,选取了熵、对比度、角二阶矩、相关性等4个纹理特征,分别对应图像的信息量、清晰度、均匀度和线性相关程度。
3 结果与分析
依据以上参数设置,南京市生态红线区分类总体精度为91.65%,Kappa系数达到0.889 8,满足精准监测的应用需求。分类结果的具体精度评价结果如表3所示。各地类中,水体、林地、房屋建筑及其他人工建筑的分类精度较高,主要是由于这几种土地覆盖类型在影像中的光谱特征较为明显,其中水体与林地一般都是大片成块状分布,形状特征较易区分; 建筑物光谱反射率高,形状特征的差异又能将其与光谱特征相似的道路进行很好区分。分类精度最低的是草地,主要原因是草地很容易被错分到林地或耕地,其中林地与草地都属于植被,在光谱上具有很强的相似性; 草地与耕地的混淆主要是由于田埂、休耕地上生长的野草与草地不易区分。
表3 地表覆盖分类精度评价
Tab.3
| 地表类型 | 草地 | 林地 | 耕地 | 建筑物 | 道路 | 水体 | 人工堆掘地 | 合计 | 用户精度/% |
|---|---|---|---|---|---|---|---|---|---|
| 草地 | 1 013 | 292 | 119 | 0 | 0 | 0 | 1 | 1 425 | 71.09 |
| 林地 | 40 | 6 792 | 213 | 4 | 9 | 2 | 0 | 7 060 | 92.28 |
| 耕地 | 43 | 37 | 2 290 | 6 | 7 | 20 | 9 | 2 412 | 89.04 |
| 建筑物 | 6 | 1 | 48 | 1 273 | 29 | 11 | 3 | 1 371 | 92.85 |
| 道路 | 4 | 0 | 10 | 70 | 916 | 0 | 0 | 1 000 | 91.60 |
| 水体 | 0 | 0 | 3 | 4 | 62 | 5 495 | 20 | 5 584 | 97.88 |
| 人工堆掘地 | 6 | 7 | 10 | 68 | 0 | 8 | 471 | 5 70 | 82.63 |
| 合计 | 1 112 | 7 129 | 2 693 | 1 425 | 1 023 | 5 536 | 504 | 19 912 | |
| 生产者精度/% | 67.00 | 95.27 | 84.41 | 86.31 | 89.54 | 98.90 | 93.45 | ||
| 总体精度: 91.65%; Kappa系数: 0.889 8 | |||||||||
南京市生态红线区土地覆盖分类结果如图3所示。结合各类型面积占比统计可得出以下结论: ①林地面积占比最高,接近整个研究区的1/3,森林既是极其重要的自然生态系统,又是可供人们游览的风景区,兼具生态效益与社会效益,多分布于生态红线区中的自然保护区、森林公园、生态公益林等区域; ②水体面积占比仅次于林地,达到25%,为确保水质洁净和水源输送通畅,生态红线区涵盖了大片饮用水水源保护区、重要水源涵养区和清水通道维护区,湿地对调节气候、降解污染、涵养水源、调蓄洪水、保护生物多样性等方面具有重要作用,因此一些重要湿地也是需要重点保护的区域; ③除林地与水体以外,耕地占比最高,达到21%,确保耕地面积不低于18亿亩是我国设立的耕地红线,生态红线区涵盖大片耕地可在一定程度上保护基本农田,以确保粮食安全[32]; ④建筑物和人工堆掘地表征生态红线区内的人为扰动程度,是生态红线区域内部需要严格管控的地表覆盖类型,两者分别达到6%和2%的覆盖度,总体来看占比面积不大,但是后期需要对其进行连续监测。
图3
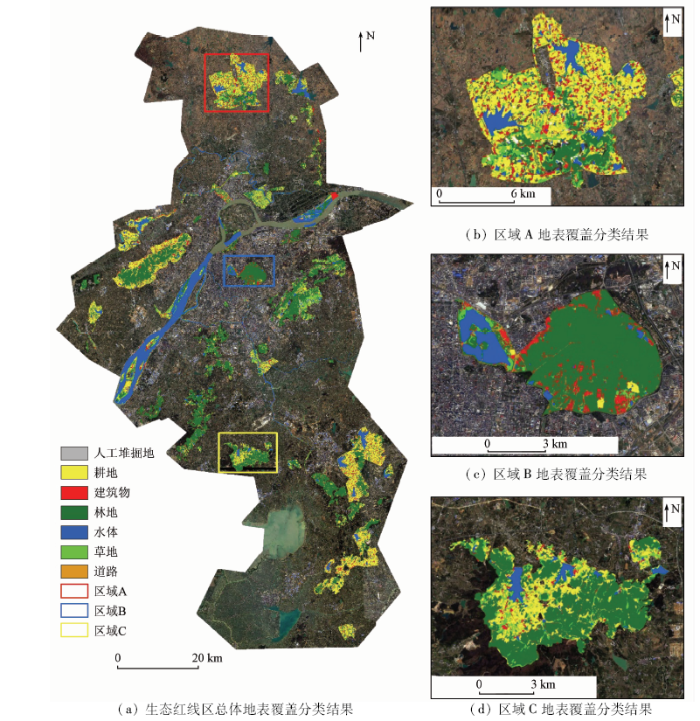
图3
南京市生态红线区地表覆盖分类结果
Fig.3
Land-cover classification results in the ecological redline areas of Nanjing City
图4
4 讨论
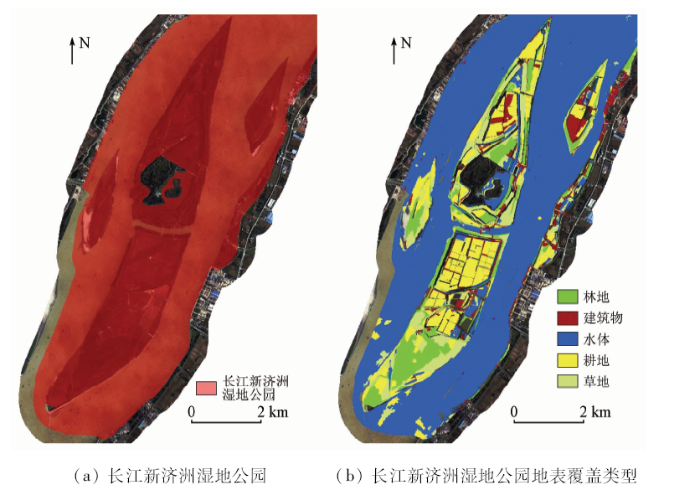
南京生态红线区湿地分布广泛,种类繁多,光谱、纹理、形状差异较大,若将各类型湿地归为一类进行提取较为困难。本文将湿地生态系统进一步细化为水体、林地、草地、耕地等类型进行提取。以长江新济洲国家湿地公园为例,其主要由新济洲、新生洲、再生洲、子母洲、子汇洲5个岛屿以及长江水域和两岸滩涂地组成。岛屿以农田、林地、草地为主要地表类型,林地以壳斗科落叶树种为主,并有少量常绿阔叶混交林。滩涂地以人工植被为主,包括杨树和柳树等。长江新济洲国家湿地公园及其地表覆盖类型如图5所示。
图5
将生态红线区中的湿地公园和重要湿地的地表覆盖分类结果进行面积统计,如表4所示。可以发现湿地公园和重要湿地的主体部分是水体,之后是耕地、林地与草地,并混有少量建筑物、人工堆掘地、道路等人工地表类型。耕地类型占比较多的原因是划分的湿地范围内水田和水产养殖用地较多; 林地和草地作为湿地的基本植被类型,也分别占据了一定的比例; 而其他少量建筑物等人工地表也处于划分的湿地范围内。
表4 湿地公园和重要湿地的地表覆盖面积统计
Tab.4
| 地表覆盖类型 | 面积/km2 | 占比/% |
|---|---|---|
| 水体 | 142.366 7 | 62.76 |
| 耕地 | 35.912 2 | 15.83 |
| 林地 | 19.354 8 | 8.53 |
| 草地 | 16.706 7 | 7.36 |
| 建筑物 | 6.704 3 | 2.95 |
| 人工堆掘地 | 3.964 5 | 1.75 |
| 道路 | 1.848 9 | 0.82 |
5 结论
为达到对大范围、多云雨环境的生态红线区进行精准、动态监测的要求,本文以南京生态红线区为研究区,提出了一套利用高时空分辨率的北京二号数据进行精细化地表覆盖分类的技术流程,分类总体精度达到91.65%。
1)建立了利用北京二号遥感影像的面向对象分类技术流程,可有效获取生态红线区地表覆盖精细分类信息,表明北京二号影像因高时空分辨率、全色与多光谱观测的优势能够用于生态红线区精准监测。
2)南京市生态红线区主体由林地、耕地、水体3种地表覆盖类型构成,3种地类共占整个研究区的80%左右,其中林地占比最高,达到33%; 此外,建筑物和人工堆掘地总占比达到8%。总体看来,目前生态红线区的生态质量良好,后期需要持续监测各地表类型变化情况,重点监测人类开发建设活动。
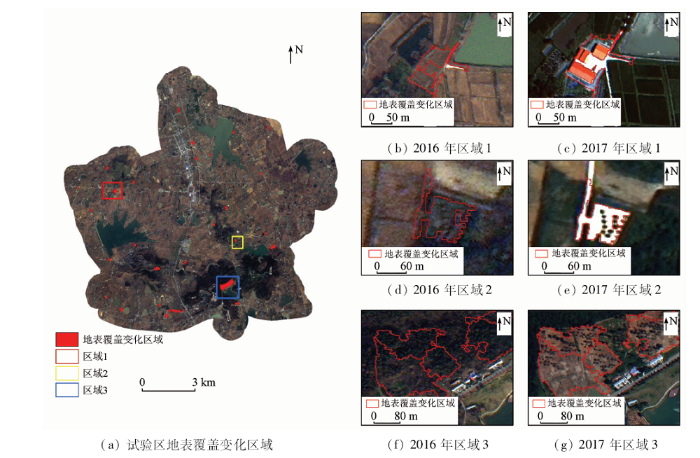
3)利用多时相北京二号数据获取的地表覆盖变化信息,可以监测到中低分辨率影像难以识别的地表覆盖细节变化,达到生态红线动态精准监测目的。
本文提出的方法流程具有一定的通用性,可对全国范围内的生态红线区资源调查与环境监测工作提供方法参考。后期随着北京二号影像或其他国产高分影像的积累,可进一步利用多年份数据分析整个生态红线区的地表覆盖变化情况,达到持续、精准监测目标。
参考文献
生态红线划分的理论和技术
[J].
DOI:10.5846/stxb201407091405
URL
[本文引用: 1]

在重要生态功能区、生态环境敏感区/脆弱区等区域划定生态红线,控制人类活动强度,对于维护区域生态完整性和生态服务功能的可持续性,解决生态环境退化和资源枯竭问题,减轻异常自然灾害不利影响具有重要意义.虽然不少省市已开展生态红线划分和管理试点工作,但生态红线划分的理论和技术尚不完善。生态红线区划和管理急需理论指导和技术支持。对生态红线的内涵进行了分析,指出了空间红线、面积红线和管理红线之间的有机联系,强调了生态安全空间格局和区域生态服务需求在生态红线划分中的重要性;在生态红线划分技术研究综述基础上剖析了生态红线的研究中存在的问题,如划分方法简单粗放、对景观和区域尺度上的空间过程和空间联系考虑不足以及由于部门和学科分割带来的(海)水陆缺乏统筹等;论述了生态适宜性评价、景观/区域安全格局理论、海陆统筹理论、干扰生态学理论、生态系统管理和适应性理论以及驱动力-压力-状态-影响-响应(DPSIR)模型框架等技术方法和理论以及它们在在生态红线划分中的潜在应用;最后提出了基于生态安全格局和区域生态服务需求的生态红线划分的技术路线,并对今后生态红线划分研究进行了展望。提出的生态红线划分技术和理论方法可为今后生态红线的研究提供有益参考。
Primary exploration of ecological theories and technologies for delineation of ecological redline zones
[J].
Detecting trends in forest disturbance and recovery using yearly landsat time series:1.LandTrendr-temporal segmentation algorithms
[J].DOI:10.1016/j.rse.2010.07.008 URL [本文引用: 1]
A LandTrendr multispectral ensemble for forest disturbance detection
[J].DOI:10.1016/j.rse.2017.11.015 URL [本文引用: 1]
Near real-time disturbance detection using satellite image time series
[J].DOI:10.1016/j.rse.2012.02.022 URL [本文引用: 1]
An automated approach for reconstructing recent forest disturbance history using dense Landsat time series stacks
[J].DOI:10.1016/j.rse.2009.08.017 URL [本文引用: 1]
Continuous change detection and classification of land cover using all available Landsat data
[J].DOI:10.1016/j.rse.2014.01.011 URL [本文引用: 1]
Landscape conditions and trends in and around delaware water gap and upper delaware national recreation areas:Summary of findings
[R].
2000—2012年京津风沙源治理区植被覆盖时空演变特征
[J].
DOI:10.5846/stxb201305251179
URL
[本文引用: 1]
植被是陆地生态系统的主体,分析长时期植被覆盖变化,有助于揭示陆地生态环境的演变规律。研究以京津风沙源重点治理区的MODIS02B产品为数据源,通过数据处理获得2000-2012年的NDVI(Normalized difference vegetation index)时序数据集,采用线性趋势分析、标准差、Hurst指数和相关系数等方法,分析京津风沙源重点治理区植被覆盖的时空变化特征及影响因子。结果显示:(1)近13年来,治理区植被覆盖总体呈上升趋势(R2=0.70),2012 年NDVI值达最大值0.324,比2000年增加了135.62%。但增加速率和幅度各异:北部干旱区(Bbghq)增加速度最快,浑善达克区(Hsdkq)次之,农牧交错区(Nmjcq)植被变化相对稳定。(2)工程区地表植被覆盖改善区域的面积明显大于退化区域,其中得到改善且通过显著性检验(P =0.10)的区域约占总面积的94.31%;Hurst指数分析表明,工程区植被变化整体呈中强持续性特征,面积合计约占64.48%;综合分析表明,工程区植被变化以良性发展为主,特别是强持续性的退化区和弱持续性的改善区值得关注,二者合计占35.27%。(3)人类活动是京津风沙地区植被覆盖上升的重要驱动因素;自然因素中,降水是控制工程区植被生长的主要因子,温度的影响相对较弱。
The spatiotemporal changes of vegetation cover in Beijing-Tianjin sandstorm source control region during 2000—2012
[J].
Analysis of MODIS NDVI time series to calculate indicators of mediterranean forest fire susceptibility
[J].
水土流失区生态变化的遥感评估
[J].水土流失是世界面临的一个严峻问题,它已给全球的生态造成了严重的威胁,及时快速地监测水土流失区的生态变化已显得尤为重要。为此,该文提出遥感生态指数(RSEI)来监测水土流失区的生态变化。该指数选取了绿度、湿度、热度和干度作为四大生态指标,并分别以遥感植被指数、湿度分量、地表温度和土壤-建筑指数为代表。同时采用主成分变换技术来集成各个指标,使各指标的权重是由数据本身的性质来决定,而不是人为的设定。将RSEI应用于福建长汀水土流失区的结果表明,RSEI指数可以定量地评价水土流失区生态修复的效果。数据显示,该区经过20多年的水土流失治理,RSEI生态指数值上升了17%,生态为优良的等级所占的面积比例从33.9%上升到52.3%,总体反映了该区的生态质量有了较明显的提高。
Assessment of ecological change in soil loss area using remote sensing technology
[J].Severe soil loss has caused ecological degradation for the global ecosystem, thus it is a major problem facing the world today. Timely and fast monitoring ecological changes in soil loss regions has become an increasing concern. This paper develops a remote sensing assessment method of soil erosion-induced changes in regional ecological quality based ecological index (RSEI). The proposed index combines four indicators from existing remote-sensing indices/components to represent greenness, dryness, wetness and heat, which are the important ecological indicators frequently used in assessing regional ecological status. The four remote-sensing indices/components are the normalized difference vegetation index (NDVI), soil index (SI), wetness component of the tasseled cap transformation (Wet), and land surface temperature (LST). The principal component analysis (PCA) was utilized to compress the four indicators into one index - RSEI, in order to assess overall ecological status. The new index, RSEI, was thus constructed using the first component as it was proved to have effectively combined the most information of the four indicators. The application of the RSEI in Hetian basin area in Changting county of Fujian province, one of the most serious reddish soil erosion areas in southern China, showed that the RSEI can quantitatively assess the ecological effects of soil loss treatment in the area and easily detect spatial and temporal changes of the ecological quality through a time period from 1988 to 2010. The application utilized three Landsat TM images of 1988, 2004 and 2010. The four indicators (NDVI, SI, Wet and LST) of each year were retrieved from the images and then combined through the PCA transform to form the RSEIs for the study years. The RSEI-based analysis indicated that after a more than 20 years fight for soil loss in the area by the local people and government, the ecological quality of the area has been significantly improved. This is suggested by an increase in the mean RSEI value from 0.5 in 1988 to 0.59 in 2010, accompanied by a decrease in low level RSEI area from 66.1% to 47.7%, and an increase of high level RSEI area from 33.9% to 52.3% in this duration. Quantitative analysis reveals that the greenness indicator represented by NDVI contributes most to the RSEI change among the four indicators used for generating the index. This suggests that the biological restore of soil erosion areas by planting tree and grass is an effective way to soil-erosion treatment for Hetian basin.
托木尔峰国家级自然保护区土地利用/覆被生态服务价值变化分析
[J].
DOI:10.11821/dlyj201611009
URL
[本文引用: 1]
8元/a,突出了保护区重要的生态地位。在保护区11项生态服务功能中,水文调节和水资源供给生态服务功能价值最高,食物和原料生产生态服务功能价值较低。③ 1989-2014年生态服务总价值量降低31.49%,其中冰川和草地的总价值量持续增长27.63%和35.70%,水体和荒地的持续减少55.43%和13.81%,林地的先减22.13%,后增15.75%。在价值构成比例上,1989年水体占主要地位,2014年冰川占主要地位。]]>
Analysis on the change of land use/cover ecological service value in Tomur National Nature Reserve
[J].
国务院关于加强环境保护重点工作的意见
[EB/OL].(
Opinions of the state council on strengthening the key work of environmental protection
[EB/OL].(
A review of supervised object-based land-cover image classification
[J].
国产高分卫星数据在高海拔地区地质调查中的应用潜力分析
[J].随着国产高分卫星的陆续发射,高分卫星数据在区域地质调查中的应用能力显得越来越突出。采用资源一号02C(ZY-1 02C)和高分一号(GF-1)卫星数据,在对原始数据质量进行评价的基础上,开展其在高海拔地区地质调查应用中的潜力分析。研究结果表明: ZY-1 02C和GF-1卫星数据已基本满足大比例尺地质制图的要求; 在区域构造解译和岩性信息提取方面已达到同等空间分辨率国外卫星数据的水平,在高海拔地区地质调查中有很大的应用潜力。
Potential of applying domestic high-resolution remote sensing data to geological survey in high altitudes
[J].
资源一号02C卫星数据在地质公园调查中的应用——以天津市蓟县为例
[J].
Application of ZY1-02C remote sensing data to the investigation of geoparks:Taking Jixian County,Tianjin City for example
[J].
北京一号小卫星数据的城市景观格局监测分析——以徐州市城区为例
[J].为了推进北京一号小卫星遥感数据在城市景观生态研究中的应用,针对其全色影像4m分辨率、多光谱影像32m分辨率的特点,试验分析北京一号小卫星影像在城市景观格局变化中的应用效果和特点。通过对不同分类器的比较,选择支持向量机分类器对多光谱影像、全色影像、全色与多光谱融合影像三个数据集进行景观组分分类,结果表明,全色与多光谱融合影像的分类精度最高。利用多时相、多光谱遥感数据统计分析了城市景观组分与格局变化,表明32m空间分辨率的多光谱影像可以用于城市景观格局变化和土地覆盖变化分析。本文全面试验和分析评价了北京一号多分辨率数据在城市景观格局研究中的应用效果。通过对同一年份全色影像和多光谱影像计算的景观格局指标的分析表明,全色数据能更有效地描述景观详细信息,多光谱数据可展现城市景观的整体格局,而融合后对景观格局分析能够获得优于单一数据的效果。试验和分析表明,北京一号小卫星4m全色高分辨率影像和32m多光谱数据的波段组合,能从不同尺度揭示城市景观格局和变化过程。
Monitoring and analyzing urban landscape pattern change using Beijing-1 small satellite remote sensing data:Taking the urban area of Xuzhou City as an example
[J].
面向对象的鄱阳湖南矶湿地国家级自然保护区烧荒地信息提取
[J].
DOI:10.3724/SP.J.1047.2014.00499
URL
[本文引用: 1]
鄱阳湖南矶湿地国家级自然保护区内时常有烧荒事件发生,这对保护区生物多样性和区域生态环境造成一定影响,快速、便捷、准确地获取烧荒地信息是该区域环境管理的紧迫需求。本文针对2012年1月初鄱阳湖南矶山湿地发生的烧荒事件,采用环境与灾害监测预报小卫星影像数据,以鄱阳湖南矶湿地国家级自然保护区所在的新建县为研究区。以面向对象的遥感影像分析方法,通过对影像的多尺度分割,根据影像的光谱信息、空间特征、纹理特征等,构建烧荒地提取的规则集,对影像中的烧荒地信息进行提取,并利用混淆矩阵对信息提取结果进行精度检验。精度检验结果表明,烧荒信息提取的总体精度为99.38%,Kappa系数为0.89,证明面向对象的遥感信息提取方法可以有效、快速地提取烧荒地信息,避免了传统方法中的椒盐状破碎图斑的现象。
The moorburn information extraction on Poyang Lake Nanji Wetland Nature Reserve area based on the object-oriented classification method
[J].
基于多尺度影像分割的面向对象城市土地覆被分类研究——以马来西亚吉隆坡市城市中心区为例
[J].
DOI:10.11834/jrs.20070472
URL
[本文引用: 1]
城市受人类活动影响比较大,结构组成比较复杂,对该区域进行分类研究存在一些问题。甚高分辨率遥感影像,以其丰富的细节信息为城市土地覆被分类研究提供了可能。本文结合使用甚高分辨率QuickBird遥感影像和激光扫描LIDAR数据,论述了利用多尺度、多变量影像分割的面向对象的分类技术对马来西亚基隆坡市城市中心区的土地覆被分类研究。针对特定地物选择合适的影像分割特征和分割尺度、按照合理的提取顺序逐步进行城市土地覆被信息提取。在建筑物的提取过程中构建了归一化数字表面模型nDSM,使用成员函数将建筑物信息提取出来。精度评价结果表明,利用该方法得到了理想的城市土地覆被分类结果,其分类总精度从常规面向对象分类方法的83.04%上升到88.52%,其中建筑物生产精度从60.27%增加到93.91%。
Object-oriented urban land-cover classification of multi-scale image segmentation method:A case study in Kuala Lumpur City Center,Malaysia
[J].
DOI:10.11834/jrs.20070472
URL
[本文引用: 1]
Urban land cover classification is not easy for its inner complexity resulting from human's impact.The emergency of very high resolution remote sensing images makes it possible to classify the urban land cover for its ample details.The paper is about urban land cover classification method using multi-scale and multi-variable image segmentation method.The innovation of this method lies in selection of proper scale parameter resulting from proper image data and certain classification order.Normalized Digital Surface Model(nDSM) is constructed in the process of building extraction;the threshold of elevation difference is used to extract building.Accuracy assessment result indicates that the ideal urban land cover classification results have been obtained using this method.The total accuracy has increased from 83.04% to 88.52% compared with traditional object oriented classification result.The product accuracy of building increases from 60.27% to 93.91%,which is the highest among all the six objects.
Object based image analysis for remote sensing
[J].
DOI:10.1016/j.isprsjprs.2009.06.004
URL
[本文引用: 1]
AbstractRemote sensing imagery needs to be converted into tangible information which can be utilised in conjunction with other data sets, often within widely used Geographic Information Systems (GIS). As long as pixel sizes remained typically coarser than, or at the best, similar in size to the objects of interest, emphasis was placed on per-pixel analysis, or even sub-pixel analysis for this conversion, but with increasing spatial resolutions alternative paths have been followed, aimed at deriving objects that are made up of several pixels. This paper gives an overview of the development of object based methods, which aim to delineate readily usable objects from imagery while at the same time combining image processing and GIS functionalities in order to utilize spectral and contextual information in an integrative way. The most common approach used for building objects is image segmentation, which dates back to the 1970s. Around the year 2000 GIS and image processing started to grow together rapidly through object based image analysis (OBIA - or GEOBIA for geospatial object based image analysis). In contrast to typical Landsat resolutions, high resolution images support several scales within their images. Through a comprehensive literature review several thousand abstracts have been screened, and more than 820 OBIA-related articles comprising 145 journal papers, 84 book chapters and nearly 600 conference papers, are analysed in detail. It becomes evident that the first years of the OBIA/GEOBIA developments were characterised by the dominance of ‘grey’ literature, but that the number of peer-reviewed journal articles has increased sharply over the last four to five years. The pixel paradigm is beginning to show cracks and the OBIA methods are making considerable progress towards a spatially explicit information extraction workflow, such as is required for spatial planning as well as for many monitoring programmes.]]>
Object-based classification of wetland vegetation using very high-resolution unmanned air system imagery
[J].DOI:10.1080/22797254.2017.1373602 URL [本文引用: 1]
鄱阳湖南矶湿地景观信息高分辨率遥感提取
[J].
DOI:10.3724/SP.J.1047.2016.00847
URL
[本文引用: 1]
鄱阳湖南矶湿地是亚热带典型过水性湿地,由于该区域水文情况复杂,且泥滩、沼泽和疫水(血吸虫)分布较广,导致野外考察验证工作困难,使用传统的遥感信息提取方法很难保证该地区湿地景观的提取精度。本文以高分一号影像为数据源,综合运用数字高程模型(DEM)、归一化植被指数(NDVI)、归一化水体指数(NDWI)等辅助数据,采用面向对象分类方法,对鄱阳湖南矶湿地景观信息进行提取研究,并取得了较好的分类效果。研究结果表明:(1)基于国产高分辨率影像的面向对象分类,既兼顾了国产高分辨率影像光谱、空间、结构、纹理信息,又综合利用多源辅助数据参与到分类计算中,分类精度得到明显的提升;(2)基于面向对象与多源数据分类方法对湿地混合像元有较好地识别能力,可获得较高的总体分类精度(94.3275%)和Kappa系数(0.9324),说明利用多源数据的面向对象方法提取湿地信息是可行的,其分类结果具有较高的准确性和可信度,较好地解决了过水性湿地景观分类问题;(3)该分类方法弥补了单一遥感影像分类方法的不足,对研究国产高分卫星在提取过水性湿地景观信息方面具有重要的参考和实际意义。最后,分析了多源数据面向对象分类尚待解决的问题和下一步的研究方向。
The wetland information extraction research of Nanji Wetland in Poyang Lake based on high resolution remote sensing image
[J].
Per-pixel vs.object-based classification of urban land cover extraction using high spatial resolution imagery
[J].
DOI:10.1016/j.rse.2010.12.017
URL
[本文引用: 2]
In using traditional digital classification algorithms, a researcher typically encounters serious issues in identifying urban land cover classes employing high resolution data. A normal approach is to use spectral information alone and ignore spatial information and a group of pixels that need to be considered together as an object We used QuickBird image data over a central region in the city of Phoenix, Arizona to examine if an object-based classifier can accurately identify urban classes. To demonstrate if spectral information alone is practical in urban classification, we used spectra of the selected classes from randomly selected points to examine if they can be effectively discriminated. The overall accuracy based on spectral information alone reached only about 63.33%. We employed five different classification procedures with the object-based paradigm that separates spatially and spectrally similar pixels at different scales. The classifiers to assign land covers to segmented objects used in the study include membership functions and the nearest neighbor classifier. The object-based classifier achieved a high overall accuracy (90.40%), whereas the most commonly used decision rule, namely maximum likelihood classifier, produced a lower overall accuracy (67.60%). This study demonstrates that the object-based classifier is a significantly better approach than the classical per-pixel classifiers. Further, this study reviews application of different parameters for segmentation and classification, combined use of composite and original bands, selection of different scale levels, and choice of classifiers. Strengths and weaknesses of the object-based prototype are presented and we provide suggestions to avoid or minimize uncertainties and limitations associated with the approach. (C) 2011 Elsevier Inc.
面向对象的高分辨率遥感影像城区建筑物分级提取方法
[J].
Object-oriented method of hierarchical urban building extraction from high-resolution remote-sensing imagery
[J].
Object-based land-cover classification for metropolitan Phoenix,Arizona,using aerial photography
[J].DOI:10.1016/j.jag.2014.04.018 URL [本文引用: 1]
A comparison of pixel-based and object-based image analysis with selected machine learning algorithms for the classification of agricultural landscapes using SPOT-5 HRG imagery
[J].
DOI:10.1016/j.rse.2011.11.020
URL
[本文引用: 1]
Pixel-based and object-based image analysis approaches for classifying broad land cover classes over agricultural landscapes are compared using three supervised machine learning algorithms: decision tree (DT), random forest (RF), and the support vector machine (SVM). Overall classification accuracies between pixel-based and object-based classifications were not statistically significant (p > 0.05) when the same machine learning algorithms were applied. Using object-based image analysis, there was a statistically significant difference in classification accuracy between maps produced using the DT algorithm compared to maps produced using either RF (p = 0.0116) or SVM algorithms (p = 0.0067). Using pixel-based image analysis. there was no statistically significant difference (p > 0.05) between results produced using different classification algorithms. Classifications based on RF and SVM algorithms provided a more visually adequate depiction of wetland, riparian, and crop land cover types when compared to DT based classifications, using either object-based or pixel-based image analysis. In this study, pixel-based classifications utilized fewer variables (15 vs. 300), achieved similar classification accuracies, and required less time to produce than object-based classifications. Object-based classifications produced a visually appealing generalized appearance of land cover classes. Based exclusively on overall accuracy reports, there was no advantage to preferring one image analysis approach over another for the purposes of mapping broad land cover types in agricultural environments using medium spatial resolution earth observation imagery. (C) 2011 Elsevier Inc.
基于高分1号杭州湾南岸滨海陆地土地覆盖信息提取方法研究
[J].
Research on the extraction method of landcover information in southern coastal land of Hangzhou Bay based on GF-1 image
[J].
Landscape analysis of wetland plant functional types:The effects of image segmentation scale,vegetation classes and classification methods
[J].
面向对象影像分类中分割参数的选择
[J].提出了一种基于区域生长方法的分割参数选择方案,从各个类别的训练样区中提取分割参数信息。通过一系列的影像区域分割,计算得出一个最大的目标函数值,为每个类别推演出最佳分割参数;在单个类别参数影像分割和分类的基础上,融合所有处理结果,最后完成影像分类。实验验证了所提出方法的有效性。
Automatic selection of segmentation parameters for object oriented image classification
[J].Image segmentation is prerequisite for object-oriented image analysis.Most image segmentation algorithms need the user to provide parameters to control the quality of the resulting segmentation.Selecting suitable parameters is a challenging task in using such algorithms.We proposed a method of parameters selection for region-growing image segmentation.Information about segmentation parameters was extracted from training sample areas of each class in the image.By multiple-segmentation of the training sample area,a maximum of objective function was found to deduce the suitable parameters for a class.Using the obtained parameters,n(the number of classes) resulting segmentations and subsequent resulting classifications were achieved.Then the n resulting classifications were fused to complete the final image classification.We tested the parameters selection for image segmentation in an object-oriented classification of remote sensing image.
A comparative analysis of high spatial resolution IKONOS and WorldView-2 imagery for mapping urban tree species
[J].
DOI:10.1016/j.rse.2012.06.011
URL
[本文引用: 1]
优化子空间SVM集成的高光谱图像分类
[J].
Optimal subspace ensemble with SVM for hyperspectral image classification
[J].
SVM在多源遥感图像分类中的应用研究
[J].
DOI:10.11834/jig.20070410
URL
[本文引用: 1]
在利用遥感图像进行土地利用/覆盖分类过程中,可采用以下两种途径来提高分类精度:一是通过增加有利于分类的数据源,引入地理辅助数据和归一化植被指数(NDVI)来进行多源信息融合;二是选择更好的分类方法,例如支持向量机(SVM)学习方法,由于该方法克服了最大似然法和神经网络的弱点,非常适合高维、复杂的小样本多源数据的分类。为了提高多源遥感图像分类的精度,还研究了支持向量机在遥感图像分类中模型的选择,包括多类模型和核函数的选择。分类结果表明,支持向量机比传统的分类方法具有更高的精度,尤其是基于径向基核函数和一对一多类方法的支持向量机模型更适合多源遥感图像分类,因此,基于支持向量机的多源土地利用/覆盖分类能大大提高分类精度。
Study on multi-source remote sensing images classification with SVM
[J].
DOI:10.11834/jig.20070410
URL
[本文引用: 1]
There are two ways to improve the performance of land cover classification with remote sensing images.The first way is to apply new data source including GIS data and normalized difference vegetation index(NDVI) to multi-source information fusion.The second one is to use methods with higher accuracy.Support vector machines(SVM) overcome the defects of maximum-likelihood and neural networks classifiers.SVMs are suitable to process complex data of high dimension and small number of training data.In this paper,selection of SVM models including kernel functions and multi-class methods is studied in order to improve the accuracy of multi-source remote sensing images classification.Experimental results show that the SVMs have higher accuracy than other traditional classifiers for the classification of multi-source remote sensing data.The SVM with a RBF kernel function and One-against-one multi-class method is the best classifier in this study.SVM methods could greatly improve the multi-source land cover classification.
