

0 引言
遥感具有宏观性、数据易获取和信息量大等传统调查不具备的优势,已被广泛应用于作物种植面积提取研究[4]。利用作物生长关键期的中高分辨率数据能够得到较高的提取精度,但受重访周期影响很难获取适时的关键期影像,并且窄幅宽难以实现大范围的作物监测[5,6]。AVHRR多时相数据曾在作物宏观持续监测研究中得到广泛应用[7,8],但由于影像空间分辨率低难以保证提取精度。近年来,MODIS遥感影像因其高时间分辨率、中等空间分辨率、大幅宽的综合优势被广泛应用在作物种植面积提取研究中[1]。其中,植被指数产品能够获取覆盖作物完整生育期的时序数据,良好的作物识别和持续监测能力使其在农作物种植面积提取方面占有重要地位[9]。目前,国内外利用MODIS植被指数获取作物分布信息的研究方法,已经发展出阈值法[10]、相似性度量法[11]、物候特征参数法[12]、混合像元分解法[13]和二次差分法[14]等。其中,二次差分法可以快速提取出曲线上的峰谷点,因此对于区分时序曲线上具有明显“峰”或“谷”状特征的作物更具优势。从目前国内的研究成果来看,利用MODIS植被指数时序数据对油菜、冬小麦、水稻等单种农作物的种植信息研究较多[13,15-16],而对生长重合期较长的两种作物的遥感识别甚少。
江汉平原油菜和冬小麦的生育期相似,在遥感识别时容易造成混淆。因此文章以江汉平原为研究区,使用MODIS增强型植被指数(enhance vegetation index,EVI)时序数据集,依据不同地物的MODIS EVI时序曲线特征,采用决策树和二次差分法相结合的方法提取研究区油菜和冬小麦种植面积。
1 研究区概况及数据源
1.1 研究区概况
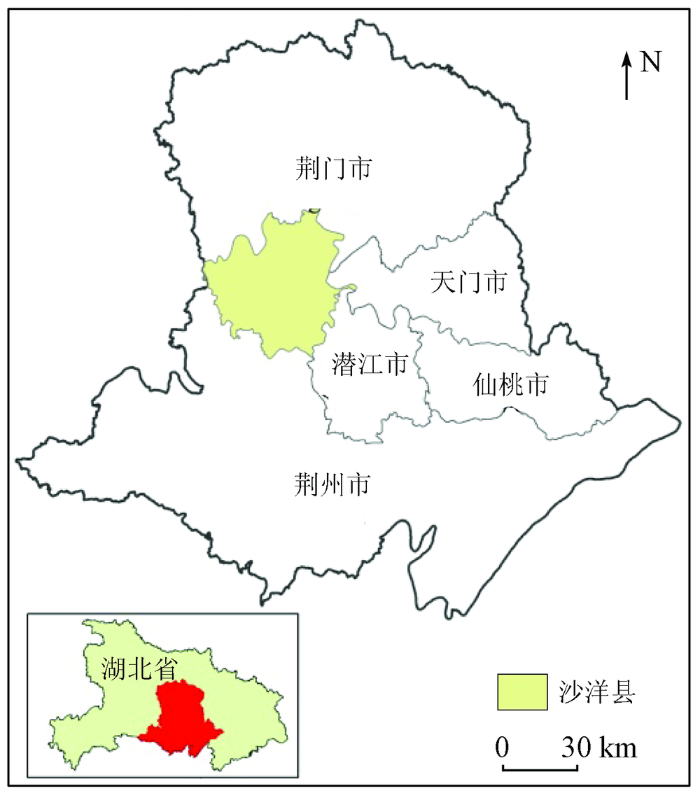
江汉平原位于湖北省中南部(N29°26' ~ 31°36',E111°15' ~ 114°5'),地处长江中游,是湖北省的粮食主产区,对湖北省农业发展和社会经济发展起着至关重要的作用,因此本文选取江汉平原为研究区,提取主要作物面积(图1)。研究区总面积为34 668 km2,占全省面积的19%。该区属亚热带季风气候,四季分明,雨水充沛,光热资源丰富,利于油菜、小麦、水稻等作物的生长。研究区内主要的越冬作物为油菜和冬小麦,二者生育期相近,生长重叠期达7个月(表1)。文章选取荆门市沙洋县作为参考区,获取油菜种植分布信息(图1)。该区位于江汉平原中部(N30°23'~30°55',E112°02'~112°42'),地势平坦,种植结构相对单一,油菜和冬小麦为主要的夏收作物。其中,油菜种植面积约41.62 ×10³ hm2,是冬小麦种植面积的2.5倍[17]。利用该区进行油菜分布信息的遥感识别能一定程度上减少“同物异谱”和“异物同谱”的几率。
图1

1.2 数据源及预处理
本研究使用的数据主要包括: ①30 m空间分辨率Landsat7 ETM+影像(
2 研究方法
图2
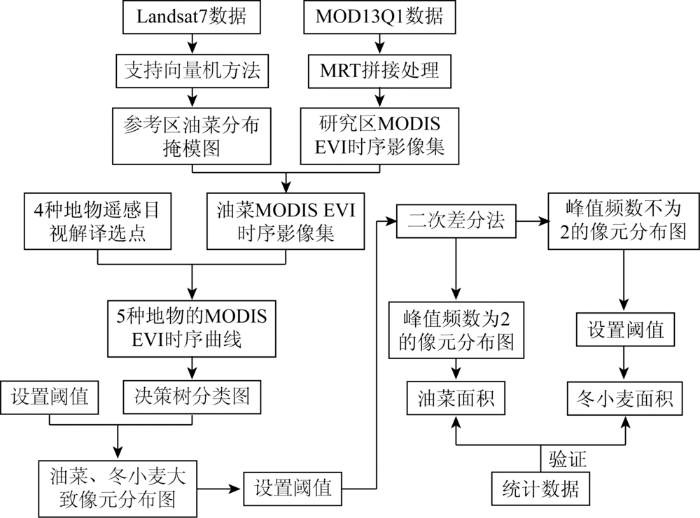
图2
油菜、冬小麦遥感提取流程图
Fig.2
Flow chart of remote sensing extraction of rape and winter wheat
2.1 参考区油菜提取方法
1)利用SVM方法对参考区3个不同时相的Landsat7 ETM+影像进行分类。通过目视解译将10月23日和11月8日两景影像分为植被、建筑用地、水体和裸地4类地物; 3月16日的林地与其他植被在假彩色合成图上差异明显,因此将该时相影像的植被细分为其他植被和林地两种类别,共得到5类地物。
2)分别提取ETM+影像中10月23日裸地、11月8日植被、3月16日其他植被,并做空间交集运算,得到大致的油菜种植区域; 将种植区域中水体周围的油菜像元剔除,以免将水体误分为油菜,最后得到参考区油菜种植面积。
2.2 二次差分法
二次差分法能够根据时序曲线上峰谷点的差异快速区分油菜和冬小麦,以达到提取二者种植面积的目的。
对于n个时相的EVI时序数据,每一个像元构成含有n个元素的离散EVI系列
式中diff为计算前后两个元素差值的函数。然后将系列
式中Sign为判断元素值符号的函数。最后,再对
得到含有n-2个元素的系列
3 结果与分析
3.1 不同地物时序EVI曲线
图3

MODIS EVI时序影像中的油菜、冬小麦、水体、建筑用地、林地按每个地类分别取平均值,得到5种不同地物的EVI时序曲线(图4)。油菜时序曲线由沙洋县油菜分布图与EVI时序图进行掩模得到。冬小麦EVI时序曲线通过在荆门市、荆州市和天门市的冬小麦集中种植区各选择15个像元得到。建筑用地、林地和水体在遥感影像上容易识别和区分,所以通过各选择研究区内15个像元来获得相应的时序曲线。
图4
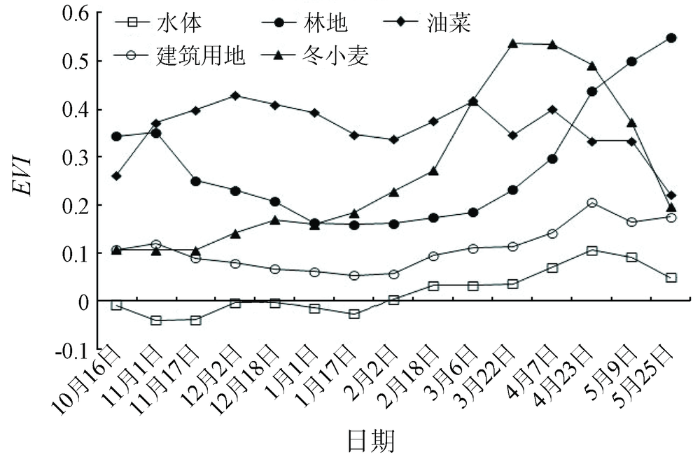
图4
江汉平原不同地物时序EVI曲线
Fig.4
EVI curve of different geomorphic time series in Jianghan Plain
3.2 江汉平原提取结果及验证
3.2.1 决策树分类结果
水体、建筑用地和林地的EVI时序曲线之间有着明显的差别(图4),易于区分,利用决策树分类方法将这3种地物进行剔除。水体和建筑用地的EVI整体水平较低,变化趋势缓慢,形状较为相似,但水体EVI低于建筑用地,且有负值出现。林地由于在春夏和秋冬交界时EVI波动较大,最低0.16,最高能达0.55,形成一条独特的 “两头高中间低”的时序曲线。而油菜和冬小麦由于表现出较强的季节性特征,时序曲线与其他3种地物有着明显的差异。依据以上不同地物的时序EVI特征可设计决策树模型图(图5),判别规则如下: ①在EVI时间序列中,只要当某一个像元值存在负数,或者10月16日至2月2日的EVI值均小于0.1时,判定为水体; ②当3月22日、4月7日和4月23日的EVI值均小于0.35,且10月16日的EVI值小于0.15时,判定为建筑用地; ③当10月16日的EVI值大于1月17日,且5月25日的EVI大于0.25时,判定为林地。将剔除水体、建筑用地和林地之后的地物合归为其他植被,得到决策树分类结果(图6)。最后,保留只含其他植被类别的时序数据集P1,利用P1进行下一步油菜和冬小麦的提取。
图5
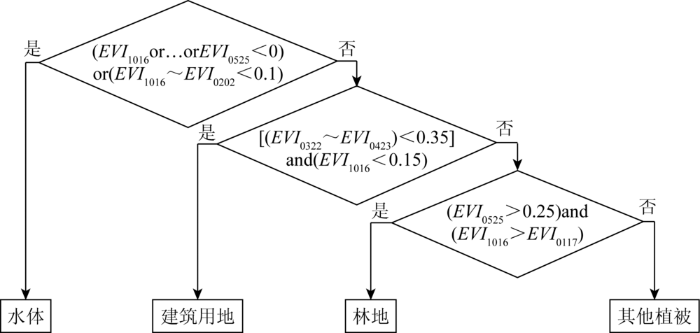
图6

3.2.2 差分法提取油菜和冬小麦种植面积
3月上旬至3月下旬期间,江汉平原油菜和冬小麦的EVI时序曲线出现了明显的差异(图4)。在此期间,油菜由于正处于盛花期, 其EVI时序曲线中3月下旬处呈现出一个明显的波谷,而此时的冬小麦正处于快速生长的分蘖—拔节期,EVI从3月上旬至3月下旬都呈现出持续上升的趋势,并没有出现EVI低谷的特征。因此,3月下旬是识别油菜和冬小麦的最佳时段,利用差分法对3月22日这一时相数据进行油菜和冬小麦的识别和提取。
图7(a)为提取的江汉平原油菜和冬小麦种植面积空间分布。首先通过设置阈值剔除P1中的无关植被,再利用差分法提取油菜和冬小麦种植面积。
图7
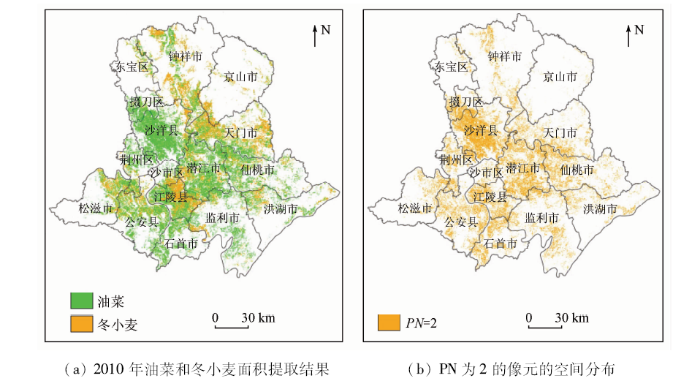
图7
P2中峰值频数等于2的像元和油菜、冬小麦空间分布
Fig.7
Pixels with a peak frequency equal to 2 in P2, rape and winter wheat spatial distribution map
1)根据图4中EVI时序曲线对P1设置阈值: ①在2月18日,油菜和冬小麦分别处于蕾薹和分蘖期的,EVI值均高于0.1,与没有经历过越冬期的植被相比,油菜和冬小麦会表现出更高的EVI值,所以设置阈值EVI0218>0.1来排除其他植被的干扰; ②在11月17日至12月2日期间,油菜和冬小麦正处于苗期,EVI时序曲线均呈上升趋势,设置阈值EVI1202>EVI1117; ③从4月23日到5月25日,油菜和冬小麦由于进入成熟收获期,EVI逐渐降低,设置阈值EVI0423>EVI0525。综上,当MODIS EVI数据集同时满足以上3个判别条件时,得到大致只含油菜和冬小麦的像元集,将其保存为数据集P2。
2)利用二次差分法提取P2在3月22日的峰值频数(peak number,PN)(图7(b))。其中,PN为2的像元代表在3月22日这一时相上,EVI时间序列曲线刚好为波谷的作物,即油菜。在PN不等于2的像元里,除了冬小麦,还存在少量3月中下旬开始播种的农作物,这些农作物在4月初的EVI值远远低于冬小麦,因此设置阈值EVI0407>0.37过滤掉干扰作物,最终得到冬小麦种植面积。
总体来看,江汉平原油菜的种植面积比冬小麦大。油菜主要分布在包括沙洋县、潜江市、仙桃市和荆州区在内的中部地区,以及以江陵县、监利市、公安县为代表的南部地区; 冬小麦主要分布于天门市、潜江市,江陵县东部、松滋市东北部以及公安县西北部等地区。在京山市和洪湖市,油菜和冬小麦均只有少量分布,这是由于京山市山区较多,地形较为破碎,洪湖市水域面积大,油菜和冬小麦分布较少。5个省直管市中,荆州市是油菜和冬小麦两种作物均分布最多的地区,一方面由于荆州是研究区中面积最大的市,另一方面其地理环境以大片的平原为主体,有利于作物的生长。
3.2.3 验证结果
表2 基于统计数据的总面积精度验证
Tab.2
| 类别 | 统计面积/hm2 | 提取面积/hm2 | 精度/% |
|---|---|---|---|
| 油菜 | 512 610 | 545 170 | 93.7 |
| 冬小麦 | 321 080 | 362 480 | 87.1 |
表3 基于统计数据的相关性验证
Tab.3
| 市 | 县级行 政区 | 油菜 | 冬小麦 | ||
|---|---|---|---|---|---|
| 统计值/ (103hm2) | 提取值/ (103hm2) | 统计值/ (103hm2) | 提取值/ (103hm2) | ||
| 荆州 | 荆州区 | 17.93 | 25.70 | 11.75 | 10.43 |
| 监利市 | 70.97 | 43.19 | 15.85 | 13.65 | |
| 公安县 | 38.69 | 46.08 | 21.78 | 25.83 | |
| 松滋市 | 35.23 | 19.10 | 14.23 | 17.34 | |
| 洪湖市 | 29.33 | 28.26 | 22.88 | 14.79 | |
| 石首市 | 25.35 | 30.31 | 1.22 | 4.51 | |
| 江陵县 | 21.35 | 31.10 | 14.20 | 42.14 | |
| 沙市区 | 3.84 | 9.30 | 6.25 | 7.23 | |
| 荆门 | 沙洋县 | 41.62 | 87.15 | 18.05 | 16.78 |
| 钟祥市 | 39.21 | 30.61 | 35.75 | 60.19 | |
| 京山市 | 15.36 | 6.15 | 30.38 | 17.23 | |
| 东宝区 | 8.86 | 9.19 | 5.07 | 5.72 | |
| 掇刀区 | 11.85 | 15.03 | 30.38 | 1.87 | |
| 仙桃 | — | 50.25 | 54.77 | 20.90 | 22.13 |
| 潜江 | — | 35.09 | 72.81 | 30.64 | 35.97 |
| 天门 | — | 66.10 | 37.21 | 52.56 | 66.79 |
图8
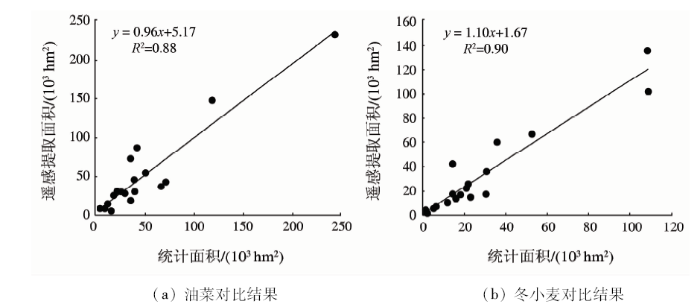
图8
遥感提取结果与统计数据相似性分析
Fig.8
Similarity analysis of remote sensing extraction results and statistical data
图9
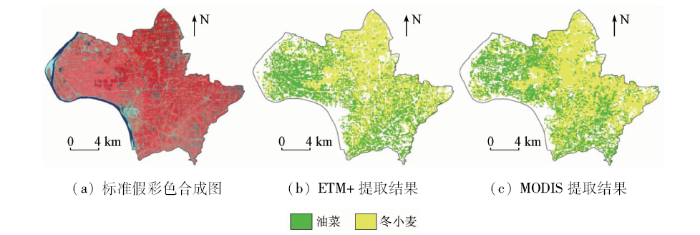
图9
江陵县标准假彩色合成图以及油菜和冬小麦空间分布
Fig.9
Standard false color composite image of Jiangling County and distribution map of rape and winter wheat spatial distribution map
3.3 提取方法普适性分析
图10
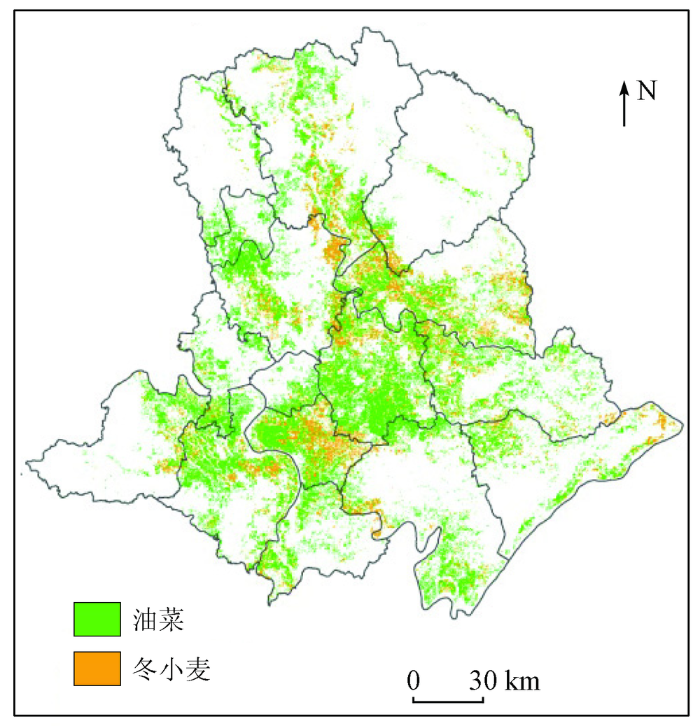
图10
2011年油菜和冬小麦面积提取结果
Fig.10
Rape and winter wheat area extraction results in 2011
4 结论与讨论
4.1 结论
本研究基于MODIS EVI时序数据,提取江汉平原生育期相近的油菜和冬小麦种植面积。相比于单一时相的遥感影像数据,作物完整生育期的时序植被指数数据能够反映植被随时间的变化,结合各典型地物的光谱、时序特征以及农作物物候信息,可以有效实现油菜和冬小麦种植信息提取。利用决策树的方法实现水体、建筑用地和林地的分类,能够在很大程度上减少非植被地物对油菜和冬小麦提取的干扰。针对生育期重合度较高的油菜和冬小麦,采用二次差分法可以快速识别具有明显波谷的农作物像元,以达到区分生育期较接近的油菜和冬小麦的目的,且二者的提取面积均达到了较高的精度,经不同年份提取结果的验证,此方法具有一定普适性。
2010年江汉平原遥感提取的油菜和冬小麦种植面积共907 650 hm2,其中油菜545 170 hm2,冬小麦362 480 hm2。油菜比冬小麦的种植面积大,油菜主要分布在中部地区的沙洋县、潜江市、仙桃市和荆州区,以及南部地区的江陵县、监利市和公安县; 冬小麦主要分布在中部的天门市和潜江市,南部的江陵县东部、松滋市东北部以及公安县西北部。而在江汉平原西北部、京山市、洪湖市,油菜和冬小麦均只有少量分布。在5个省直管市中,荆州市是油菜和冬小麦两种作物均分布最多的地区。
本研究对于大范围的遥感提取效果较好,2010年油菜和冬小麦的总体精度分别达到了93.7%和87.1%,油菜比冬小麦的提取效果好; 而从市(县、区)尺度来看,油菜和冬小麦遥感提取效果与统计数据的相关性分别为0.88和0.90,冬小麦的相关性更高些。
4.2 讨论
由于不同的气候条件会导致各个地区作物的生长速率及长势存在一定的差异,因此使用同一套判别规则进行作物提取会存在一定误差。再加上MODIS影像250 m分辨率所导致的混合像元的存在,作物识别和提取精度有待进一步的提高。为此,探求区域地理环境差异和混合像元这两个因素对提取精度的影响是本研究下一步工作的重点。
参考文献
基于时序MODIS影像的农作物遥感识别方法研究
[D].
Research on crop remote sensing recognition method based on time series MODIS image
[D].
Global crop monitoring:A satellite-based hierarchical approach
[J].DOI:10.3390/rs70403907 URL [本文引用: 1]
基于MODIS-NDVI时间序列数据的油菜识别与复种指数提取
[D].
Identification of rapeseed and multiple cropping index based on MODIS-NDVI time series data
[D].
基于HJ-1A/B-CCD影像的湖北省冬小麦和油菜分布信息的提取方法
[J].
DOI:10.3969/j.issn.1000-6362.2012.04.015
URL
[本文引用: 1]

利用不同时期HJ-1A/B-CCD影像提取湖北省冬小麦和油菜分布信息。计算冬小麦、油菜不同生长期的NDVI曲线,通过野外调查和测量,获取冬小麦、油菜和其它典型地物的光谱特征。确定CCD影像提取冬小麦和油菜信息的最佳时相及不同地物在CCD影像上的色彩特征。采取最大似然分类法,对CCD影像进行分类,提取冬小麦、油菜分布信息。结果表明,HJ-1A/B-CCD影像提取精度达95.48%,可以用于提取冬小麦、油菜分布信息;对于湖北省而言,3月中、下旬(冬小麦拔节、油菜开花)是HJ卫星提取冬小麦、油菜信息的最佳时相;在最佳时相内,冬小麦和油菜具有不同的光谱特征和CCD影像色彩特点,且样本分布服从近似正态分布,可以用最大似然方法提取其信息。
Extraction method of winter wheat and rape distribution information in Hubei Province based on HJ-1A/B-CCD image
[J].
DOI:10.3969/j.issn.1000-6362.2012.04.015
URL
[本文引用: 1]
An application of using HJ-1A/B-CCD images in extracting the distribution of winter wheat and rape in Hubei province was searched in this paper NDVI curve of winter wheat and rape in different growth stage were calculated by different periods of CCD images,the spectral features of the winter wheat,rape and other typical features were obtained according to the field investigation and measurement.The best phase for extracting rape and winter wheat and the color of different surface objects in CDD image were confirmed.The maximum likelihood classification method was taken to extract winter wheat and rape in CDD images.The results indicated that: HJ-1A/B-CCD data could be used to extract the winter wheat and rape,the extracting precision was 95.48%;the late 10 day of March was the best phase for extracting winter wheat and rape using HJ-1A/B satellite in Hubei province.In the best phase,winter wheat and rape had different spectrums and CCD image color,and their sample distributions satisfied the normal distribution,so the maximum likelihood method can be used to extract the distribution of winter wheat and rape.
基于典型物候特征的MODIS-EVI时间序列数据农作物种植面积提取方法——小区域冬小麦实验研究
[J].
DOI:10.11834/jrs.20110066
URL
[本文引用: 1]
利用MODIS植被指数时间序列这一特性,以北京市通州及周边为实验区,冬小麦种植面积为研究对象,提出了农作物种植面积指数模型(Pan-CPI模型)的概念,并构造了冬小麦特征物候期植被指数与种植面积的定量函数关系,通过样区TM影像求解关键参数,对研究区冬小麦种植面积测量方法进行了试验研究。研究结果表明:(1)Pan-CPI模型能够很好地反映特定目标农作物种植面积状况,为基于植被指数时间序列影像识别农作物种植面积提供了新方法;(2)精度分析结果表明:Pan-CPI模型具有很高的稳定性,且不受样本变化的影响,只要达到满足模型计算的样本量(如:5%),多次测量结果间具有很好的一致性。选取MODIS 6×6像元大小的窗口时,TM样本的复相关系数(R2)稳定在0.85左右,与TM结果比较,窗口相对精度稳定在95%左右,区域精度稳定在92%以上,经调整的区域精度高达96%以上;(3)对于种植结构复杂、目标作物种植破碎的地区,Pan-CPI模型可以充分利用MODIS植被指数时间序列的优势,有效改善TM单时相和多时相提取信息因时相缺失无法表征作物变化的不足。
Extraction method of crop planting area based on typical phenological characteristics of MODIS-EVI time series data:Experimental study on winter wheat in small area
[J].
DOI:10.11834/jrs.20110066
URL
[本文引用: 1]
Other than the refl ectance comparing to natural vegetation, various types of crop have their own representative phenologicalcalendar features. This dramatic change of crops along seasons makes a great difference to the regular order changesof natural vegetation. MODIS-VI time series become the best indicator for these phonological features. In this paper, a new croparea index, called Pan-CPI, is proposed to refl ect the quantitative functional relationship between the MODIS-EVI time seriesand crop planted area. The research region is located at Tongzhou, Beijing and its surrounding areas. The winter wheat plantedarea was determined by the key parameters of the Pan-CPI model from the samples collected by TM images and MODIS-EVItime series. The results demonstrated that: (1) The Pan-CPI model can well monitor the goal crop area and provide a new methodfor crop area estimation based on MODIS-EVI time series. (2) Accuracy analysis shows that: As long as the population of samplesmeet the requirement of model calculation (for example: 5%), the Pan-CPI model has a high stability to get a high consistencybetween multiple measurements and will not be infl uenced by different samples. While the size of stats window is 6×6MODIS pixels, the multiple correlation coeffi cient (R2) reach above 0.85.Compared with the result of TM, the Overall WindowsAccuracy stabilizes at around 95%, Total Quantity Accuracy stabilizes above 92% and Post-Adjusted Total Quantity Accuracyreaches up to 96%. (3) For the area with complex, fragmental cultivation structure, the Pan-CPI model can provide a more reasonablecrop area estimation than those results from TM, which may easily be infl uenced by the loss of images in key phenology phases.
基于Landsat/TM遥感的冬小麦长势分级监测研究
[J].
DOI:10.7606/j.issn.1009-1041.2010.01.019
URL
[本文引用: 1]
为给遥感技术在冬小麦长势分级监测预报中的应用提供依据,以江苏省兴化市为例,利用TM卫星遥感影像,提取冬小麦的种植面积并分析了长势情况。在利用GPS实地取样调查和建立解译标志的基础上,进行TM影像校正、非监督分类和人机交互式判读解译等操作,并将GPS样点数据校验贯穿到整个分类过程中,信息解译精度在95%以上。结合NDVI指数反演的叶面积指数数据进行小麦长势分级分类,并制作了兴化市冬小麦长势分级监测图。
Study on the grading monitoring of winter wheat growth based on Landsat/TM remote sensing
[J].
DOI:10.7606/j.issn.1009-1041.2010.01.019
URL
[本文引用: 1]
Monitoring winter wheat growth status at different stages by remote sensing technology may obtain the growth information of winter wheat timely and widely, based on which many crop producers and agricultural managements can frame and adopt efficient management measures to achieve the objective of high yield and good quality. The winter wheat growing area was extracted from the Landsat/TM image and the growth status were analyzed in Xinghua city, Jiangsu province. The geographical positions and some other information of the test sites where samples collected were measured by the handhold GPS. The GPS data and the interpretation mark are used to correct the TM image, to verify the unsupervised classification, and to assist human computer interactive interpretation and other operations. The test data had been participated the whole classification process. The accuracy of information interpret is more than 95%. And combined with NDVI index inversion of leaf area index data classification grading of wheat growth, a winter wheat growing hierarchical classification grading thematic map of Xinghua city was obtained.
Crop identification using harmonic analysis of time-series AVHRR NDVI data
[J].
Estimating spatio-temporal patterns of agricultural productivity in fragmented landscapes using AVHRR NDVI time series
[J].DOI:10.1016/S0034-4257(02)00128-1 URL [本文引用: 1]
基于MODIS时序NDVI主要农作物种植信息提取研究
[J].
Research on planting information extraction of main crops based on MODIS timing NDVI
[J].
基于MODIS EVI时序数据的江汉平原油菜种植分布信息提取
[J].
Extraction of Jianghan Plain oil vegetable planting distribution information based on MODIS EVI time series data
[J].
A comparison of time series similarity measures for classification and change detection of ecosystem dynamics
[J].
基于拟合物候参数的植被遥感决策树分类
[J].针对目前遥感分类较少利用植被物候特征参数的现状,该研究以内蒙古自治区额尔古纳、根河两市作为试验区,基于2012年根河土地覆盖数据,采用双Logistic 函数拟合的方法对跨度范围为2011年7月下旬至2013年7月下旬的时间序列MODIS EVI 数据进行植被物候参数的分析与提取,并依据物候参数特征构建决策树对试验区土地覆盖进行分类。研究表明,不同植被的物候有较明显的特征,森林、草原与作物的生长季开始时间依次滞后,作物的生长季最短,森林与草原生长季基本持平;利用植被物候特征参数进行决策树分类,作物和森林2种植被类型取得较好分类效果,分类的总体精度达到73.67%,优于该区域MODIS土地覆盖产品的总体精度(66.08%)。该研究可为呼伦贝尔地区生态环境评价和农、牧、林业生产活动提供一定的参考。
Vegetation remote sensing decision tree classification based on fitting phenological parameters
[J].Phenology refers to periodic plant life cycle events influenced by climate and other environmental factors, such as sprouting, flowering, fruiting and leaves falling, etc. Different vegetation types have distinct growth characteristics, and phenology can be a good representative parameter to classify vegetation types. Phonological parametric analysis is mainly used to find out significant changes in specific time points and extract corresponding characteristic VI values, by analyzing a time-series vegetation index, e.g., start of season (SOS), end of season (EOS), length of season (LOS), max of EVI (MOE) and amplitude of EVI (AOE). These key phenology parameters can be used to classify vegetation types. Eerguna and Genhe in Hulunbeier city, Inner Mongolia Autonomous Region were selected as the study area. A double logistic function fitting method was used to smooth the time series MODIS-EVI data. The time range was from the summer of 2011 (DOY=209) to the summer of 2013 (DOY=193), and the total number of images was 46. Then, 100 points of each land cover type (grass, forest, crops, other non-vegetation) were chosen as classification samples. Five key phenological parameters mentioned above were extracted and used to build the decision tree classifier. The overall classification accuracy of the results reached to 73.67%. The results show that vegetation in Hulunbeier northern region had obvious unique features. The season of forest started earliest (145-160 days, DOY, hereinafter), and ended quiet early (250-275 days); the season of grass started slightly later than forest (160-170 days), but the length of season was similar to forest, both were from 90 to 120 days. The season of crops started late and ended early, so the season of crops was short and concentrated, the length of the samples was from 60 to 90 days. The classification achieved better results than MODIS land cover products (66.08%). Except for grass' user accuracy being a little lower, producer accuracy and user accuracy of the 4 kinds of land cover types reached to 79%. The phonological information extracted in this paper had a high consistency with existing research results; it is shown that monitoring phenology based on time-series EVI data was reliable. This research can provide a reference to ecological environment evaluation and agriculture, animal husbandry, forestry production activities in the Hulunbeier northern region.
基于时序MODIS-NDVI的油菜种植面积变化趋势分析——以江汉平原为例
[J].
DOI:10.11870/cjlyzyyhj201603007
URL
[本文引用: 2]
R2大于0.9。油菜种植面积的时空变化结果很好地反映出江汉平原油菜种植面积总体呈增长态势。此外,政策导向和市场价格对油菜种植面积的影响明显。]]>
Analysis of the change trend of rapeseed planting area based on time series MODIS-NDVI:Taking Jianghan Plain as an example
[J].
基于时序NDVI的关中地区冬小麦种植信息遥感提取
[J].
Remote sensing extraction of winter wheat planting information in Guanzhong area based on time series NDVI
[J].
基于MODIS-EVI及物候差异免阈值提取黄淮海平原冬小麦面积
[J].
Extraction of winter wheat area in Huanghuaihai Plain based on MODIS-EVI and phenological difference threshold extraction
[J].
基于多时相遥感数据提取水稻种植面积的研究
[J].
Study on extraction of rice planting area based on multi-temporal remote sensing data
[J].
基于决策树和SVM的Sentinel-2A影像作物提取方法
[J].
Sentinel-2A image crop extraction method based on decision tree and SVM
[J].
基于作物空间物候差异提取黄淮海夏玉米种植面积
[J].
Extraction of summer maize planting area in Huang-Huai-Hai based on differences in crop space phenology
[J].
基于MODIS数据的湖北省油菜种植分布信息提取
[J].MODIS归一化差值植被指数(MODIS-normalized difference vegetation index,MODIS-NDVI)时间序列产品能够连续反映植被的覆盖情况,是农作物遥感测量的重要数据源。为研究基于MODIS数据的油菜种植分布信息提取技术,选取湖北省为研究区,利用2008-2013年75个时相的MODIS-NDVI时序数据,结合农作物物候和地面调查样本等辅助资料,通过建立油菜种植面积提取模型,采用多次阈值比较方法提取了2009-2013年湖北省油菜种植分布信息,与统计数据比较,总体提取精度为85%左右。最后利用环境小卫星HJ-1A CCD数据进行精度验证,证明了MODIS-NDVI时序数据及本文方法在油菜种植面积提取中的可靠性,对掌握油菜种植面积和产量信息、加强农业生产管理、调整农业结构及辅助政府有关部门制定科学合理的农业政策具有重要意义。
Extraction of rapeseed planting distribution information based on MODIS data in Hubei Province
[J].
基于随机森林算法的冬小麦提取研究
[J].
Research on winter wheat extraction based on random forest algorithm
[J].
