

0 引言
随着我国经济的迅速发展和城市的急剧扩张,空气污染已成为了我国亟需解决的重要环境问题[1,2,3,4]。研究表明,悬浮在空气中的动力学直径小于2.5 μm的细颗粒物(PM2.5)是造成我国大部分城市地区雾霾的主要污染物,且其与人体的负面健康密切相关[5,6,7,8]。因此,有必要对我国城市地区的近地面PM2.5浓度进行有效的估算。传统的地面环境监测网络可以提供准确的监测站点周围的PM2.5浓度数据,但却无法获取连续的近地面PM2.5浓度空间分布。研究表明,卫星遥感方式可有效用于缺少地面监测网络区域的PM2.5浓度估算,其中,由卫星遥感反演的气溶胶光学厚度(aerosol optical depth, AOD)产品已被广泛应用于全球范围内的PM2.5估算[9,10,11,12,13]。
利用AOD产品来反演区域近地面PM2.5浓度的相关模型已经从简单的回归模型(如: 线性回归模型[14,15])逐渐发展为高级统计模型(如: 土地利用回归模型(land use regression, LUR)[16,17]、地理加权回归模型(geographically weighted regression, GWR)[18,19]、地理和时间加权回归模型(geographically and temporally weighted regression, GTWR)[20,21]以及线性混合效应模型(linear mixed effects model, LME)[22,23,24])。与简单的回归模型相比,这些高级统计模型通常获得较高的PM2.5浓度反演精度,但由于受气候条件的影响,同一模型在不同研究区的反演能力也有所差异。例如,Lee等[22]利用LME模型对美国东北部地区的PM2.5浓度进行反演,结果表明,模型反演的R2为0.92,均方根误差(root mean square error,RMSE)为2.45 μg/m3; 而Sorek等[25]将LME模型运用在以色列地区的PM2.5浓度反演时,其R2仅为0.45,RMSE高达12.06 μg/m3。因此,为了提高模型反演的准确性,研究者们逐渐引入更多的辅助变量(如气象参数和土地利用信息)来构建AOD-PM2.5模型。例如,Ma等[26]构建了包含8个变量的GWR模型来反演全国的PM2.5浓度,结果表明,GWR模型反演的R2为0.64,RMSE为32.98 μg/m3; He等[21]通过考虑AOD-PM2.5的时间变化引入5个气象参数和2个土地利用变量,进一步将GWR模型扩展成GTWR模型来反演全国的PM2.5浓度,结果表明由GTWR模型反演的R2提高至0.80,RMSE也下降为18.58 μg/m3。
此外,也有研究者采用机器学习算法来反演区域的近地面PM2.5浓度。例如,Gupta等[14]使用人工神经网络(artificial neural network, ANN)算法来减少由AOD带来的估算误差,其结果表明由ANN反演的PM2.5浓度与实测值之间的R2为0.61; Mehdipour等[27]比较了3种机器学习算法: 决策树(decision tree, DT)、批量归一化(batch normalization,BN)和支持向量机(support vector machine, SVM)在伊朗德黑兰的PM2.5浓度反演能力,结果证实 SVM的反演精度最高。与高级统计模型类似,机器学习算法也引入了辅助变量来提高模型的反演精度,但这些多参数反演模型在建模前均需要对各参数和PM2.5浓度之间的相关性以及各参数之间的自相关性进行验证,且模型的结果不能体现各输入变量影响PM2.5浓度变异的重要性[28,29]。因此,本研究利用一种集成的机器学习算法(随机森林)来反演区域的PM2.5浓度。随机森林不仅可以通过调整2个参数(即mtry和ntree)来获得模型的最优估计,同时还能提供各变量影响PM2.5浓度变异的重要性指标,从而比其他机器学习算法更合理地解释了近地面PM2.5浓度的变化特征。
本研究的主要目的是利用随机森林模型来估算城市地区的近地面PM2.5浓度。其中,用于构建模型的数据主要有来自中分辨率成像光谱仪(Moderate-Resolution Imaging Spectroradiometer,MODIS)空间分辨率为3 km的AOD产品(以下简称为MODIS 3 km AOD)、气象因子、植被覆盖度和道路密度等4类参数。本研究选择2个东部沿海地区作为研究区域,即: 长江三角洲(YRD)和珠江三角洲(PRD)地区,并构建包含多参数的随机森林模型来估算该区域的近地面PM2.5浓度。由于MODIS 3 km AOD产品是采用暗像元算法反演而得,这将导致高反射率的地表(建筑密集的城区和道路等)无有效的AOD值。为此,本研究提出了一种2层的随机森林估算模型,其中第一层模型主要用来估算高反射率地表的AOD值,并结合MODIS 3 km AOD产品来获取能够覆盖YRD和PRD区域的 AOD全空间覆盖分布; 在此基础上,结合AOD、气象因子、植被覆盖度和道路密度等参数来构建第二层随机森林模型,以估算2018年YRD和PRD地区的近地面PM2.5浓度。
1 研究区概况及数据源
1.1 研究区概况
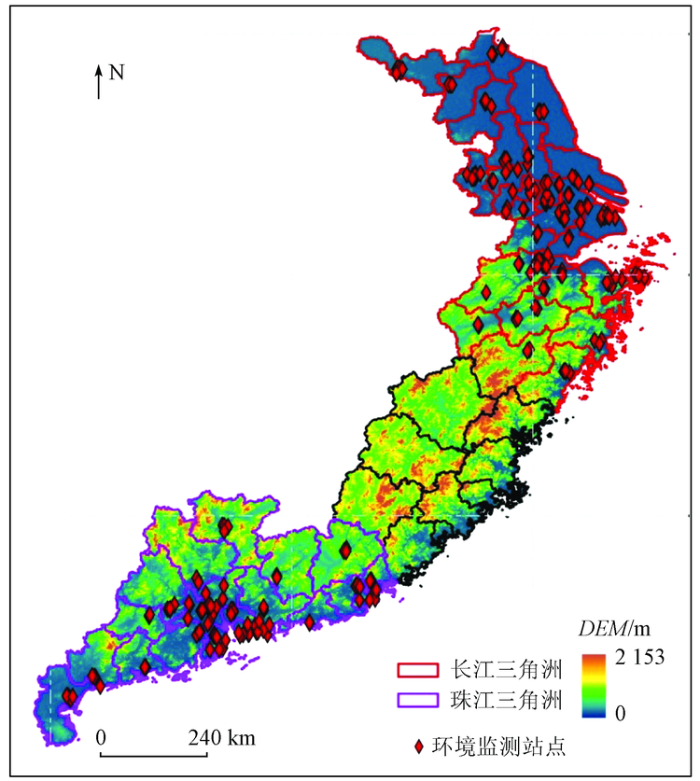
图1
1.2 数据源
1.2.1 PM2.5和MODIS AOD数据
本研究的PM2.5浓度数据主要来自2018年上海市、江苏省、浙江省和广东省环境保护厅网站提供的共260个地面监测站点的每小时PM2.5浓度。建模前需先对所有站点的PM2.5浓度异常值进行剔除,如PM2.5 小于0 μg/m3和PM2.5为NA(not available,即该值不可用)等。AOD数据主要由Terra星上搭载的MODIS传感器所提供的空间分辨率为3 km的AOD产品,该数据下载于美国航空航天局网站(
1.2.2 气象数据
气象数据主要来源于戈达德地球观测系统数据同化系统提供的空间分辨率为0.25°×0.312 5°的前向处理数据(GEOS-5 FP)。本研究共下载了10个气象参数: 行星边界层高度(PBLH,m)、地表温度(Ts,K)、2 m分辨率气温(T2 m,K)、10 m分辨率气温(T10 m,K)、10 m分辨率东向风( U10 m,m/s)、10 m分辨率北向风(V10 m,m/s)、相对湿度(RH,%)、风的纬向分量(U-component,m/s)和经向分量(V-component,m/s)以及气压(PS,hPa)。采用最临近插值法将所有气象参数插值到3 km×3 km网格中,插值过程在Python软件中完成。
1.2.3 土地利用数据
本研究的土地利用数据包含植被覆盖度和道路密度数据。其中,植被覆盖度数据来源于MODIS提供的空间分辨率为1 km的植被指数产品(MOD13A3),该产品已被广泛用于全球植被状况的监测。道路数据来源于百度地图提供的包含高速公路、国道和省道等主要道路的矢量文件,并在ArcGIS软件中计算每个3 km×3 km网格单元的道路密度值。
2 模型开发和验证
随机森林是一种集成的机器学习方法,最初由Breiman[31]开发,目前已被广泛用于市场营销、生物分类和医学等各个领域。随机森林使用bootstrap重采样方法选择随机子样本,然后基于随机子样本的特征选择方法为每个子样本选择一个预测子集,并将多数选票结果作为随机森林的最终预测结果[32]。随机森林通过确定每个节点的预测变量数(mtry)和每个决策树的数目(ntree)这2个重要参数来获得最优估计[33]。本研究旨在构建包含MODIS 3 km AOD、气象因子、植被覆盖度和道路密度等参数的随机森林模型,以估算YRD和PRD地区的近地面PM2.5浓度。由于MODIS 3 km AOD主要采用暗像元算法来反演,因此在高反射率的地表(建筑密集的城区和道路等)无有效的AOD值。已有的研究主要利用简单的克里格插值法或将多个传感器反演的AOD进行融合来获取连续的AOD空间分布[28,34],但这2种方法的估算精度均较低。为此,本研究通过构建随机森林模型,利用相关气象因子(如PBLH和RH等)来估算缺失的AOD值。在此基础上,结合AOD、气象、植被覆盖度以及道路密度等参数,构建第二层随机森林模型来估算2018年YRD和PRD地区的近地面PM2.5浓度。另一方面,随机森林模型中的指标——增长的错误率平方均值(increased in mean squared error, IncMSE)可用于验证各变量在PM2.5浓度变异中的重要性,因此,相比于其他机器学习算法,随机森林算法的应用更广泛。IncMSE值越大,代表该变量的重要性越大。本研究所提出的2层随机森林模型可简写为:
式中: AOD为第一层模型的估算值; meteorologicalfields主要包含了PBLH,Ts, T2 m, T10 m, U10 m, V10 m, RH, U-component, V-component和PS等10个参数; vegetationcover为植被覆盖度,roaddensity为道路密度。
本研究采用10折交叉验证方法来评价2层随机森林模型估算PM2.5浓度的能力。10折交叉验证法是指将建模数据集随机分为10个部分,90%的数据用于模型训练,剩余10%用于模型预测。另外,本研究使用决定系数(R2)和RMSE这2项指标来评估模型估算的PM2.5浓度和地面实测值之间的相关性。
3 结果与分析
3.1 数据统计
表1给出了参与建模的14个参数的统计数据。其中,2018年YRD和PRD地区的PM2.5浓度范围为1~377 μg/m3,总体表现为YRD地区较高,PRD地区略低; AOD的分布和PM2.5浓度类似,2018年AOD平均值呈现YRD高于PRD的格局。就AOD-PM2.5关系而言,二者在夏秋2季的相关性约为0.25,而在冬春2季则下降至0.10。造成这种关系差异的主要原因是AOD-PM2.5之间的相关性易受不同气候条件的影响。PBLH与PM2.5浓度的季节性特征呈现明显的相反趋势,即在PM2.5浓度较高(低)的冬春(夏秋)2季,PBLH较低(高)。MODIS NDVI的季均值分别为0.32(春)、0.40(夏)、0.40(秋)和0.30(冬)。
表1 建模参数的统计数据
Tab.1
| 变量 | 最小值 | 最大值 | 均值 | 标准差 |
|---|---|---|---|---|
| PM2.5 /(μg·m-3) | 1.00 | 377.00 | 41.53 | 32.00 |
| AOD | 0.01 | 2.20 | 0.26 | 0.18 |
| PBLH/m | 63.38 | 2 227.65 | 940.37 | 941.88 |
| PS/hPa | 918.60 | 1 034.00 | 1 003.20 | 1 007.00 |
| RH/% | 13.50 | 100.00 | 62.30 | 64.30 |
| T2 m/K | 269.80 | 310.20 | 294.90 | 296.00 |
| T10 m/K | 269.40 | 309.30 | 294.20 | 295.30 |
| Ts/K | 271.90 | 320.80 | 297.70 | 298.90 |
| U10 m/(m·s-1) | -11.44 | 9.04 | -0.79 | -0.95 |
| U-component/(m·s-1) | -15.35 | 14.36 | -1.07 | -1.38 |
| V10 m/(m·s-1) | -17.95 | 11.59 | -0.23 | -0.18 |
| V-component/(m·s-1) | -24.14 | 18.07 | -0.40 | -0.42 |
| vegetationcover | 0.00 | 0.87 | 0.35 | 0.33 |
| roaddensity/(km·km-2) | 0.11 | 2.31 | 1.13 | 1.05 |
3.2 随机森林建模和验证
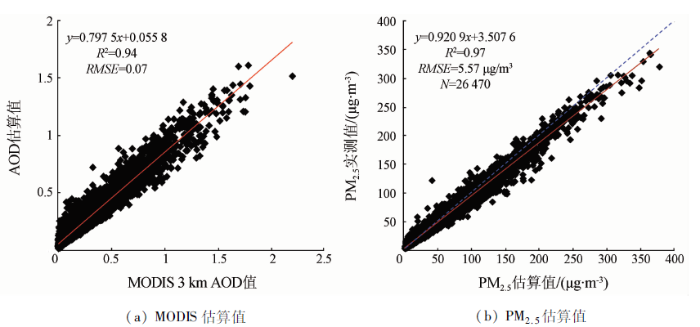
本研究共使用了前文所说的14个变量来参与建模。通过对随机森林模型的训练,最终将mtry和ntree分别设为4和500,以达到最优估计。图2给出了13个自变量在PM2.5浓度变异中的重要性评价。结果表明,AOD,PBLH和RH是解释YRD和PRD区域中PM2.5浓度变化的前3个最重要变量。此外,研究发现,在获取的29 873组建模数据中,9 871组(33%)的数据具有完整的AOD和PM2.5值,剩余的20 002组(67%)只有PM2.5值(缺少AOD)。本文首先选择33%的数据集(同时拥有AOD和PM2.5值)对随机森林模型进行训练,结果表明模型估算的PM2.5浓度和地面实测值之间的R2为0.95,RMSE为5.73 μg/m3。为了获取完整的AOD值空间分布,本研究构建了包含PBLH,RH,PS和Ts等气象参数的随机森林模型来预测缺失的AOD值,结果表明,由随机森林估算的AOD与MODIS 3 km AOD高度相关,二者之间的R2 高达0.94(图3(a))。在此基础上,进一步利用第一层模型估算的AOD值,并结合气象因子以及植被覆盖度和道路密度等参数来构建第二层随机森林模型,结果显示模型估算的2018年YRD和PRD地区的PM2.5浓度值和实际测量值之间的R2达到了0.97,RMSE为5.57 μg/m3(图3(b))。
图2
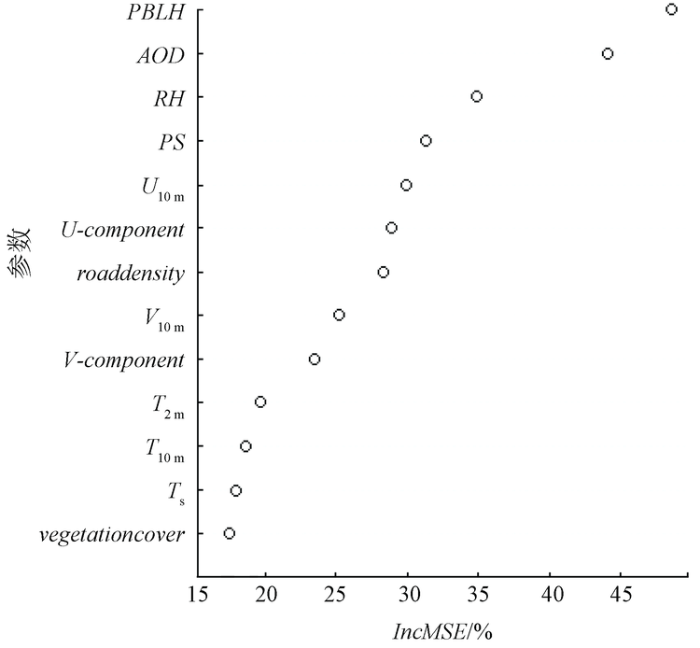
图3
进一步分地区对模型性能进行验证,结果发现由随机森林模型估算的YRD和PRD地区的PM2.5浓度与地面实测值之间的R2分别为0.98和0.97; RMSE分别为5.85 μg/m3和4.67 μg/m3。Ma等[13]和Song等[30]分别利用LME和GWR模型对YRD和PRD地区开展了PM2.5浓度遥感估算,结果表明模型估算值和地面实测值之间的R2仅为0.67(YRD)和0.73(PRD)。图4显示了4个季节和12个月份的模型反演结果对比,结果表明春季、夏季、秋季和冬季模型的R2分别为0.97,0.96,0.98和0.98; 4个季节的RMSE总体表现为: 冬季(7.34 μg/m3)> 春季(5.00 μg/m3)> 秋季(4.35 μg/m3)> 夏季(3.60 μg/m3)。而12个月份中模型拟合的R2均在0.93以上,6—10月份的RMSE略低于其他月份。分区域和分季节的模型估算结果表明了本研究所提出的2层随机森林模型在YRD和PRD区域中具有较高的PM2.5估算能力。图5和表2显示了利用10折交叉验证法(cross validation,CV)对2层随机森林模型进行验证的结果。可以看出,全年和4个季节的模型交叉验证结果和拟合结果均表现出良好的一致性,模型CV估算的R2均大于0.95,且4个季节的RMSE也呈现出冬春2季高于夏秋2季的特点。
图4
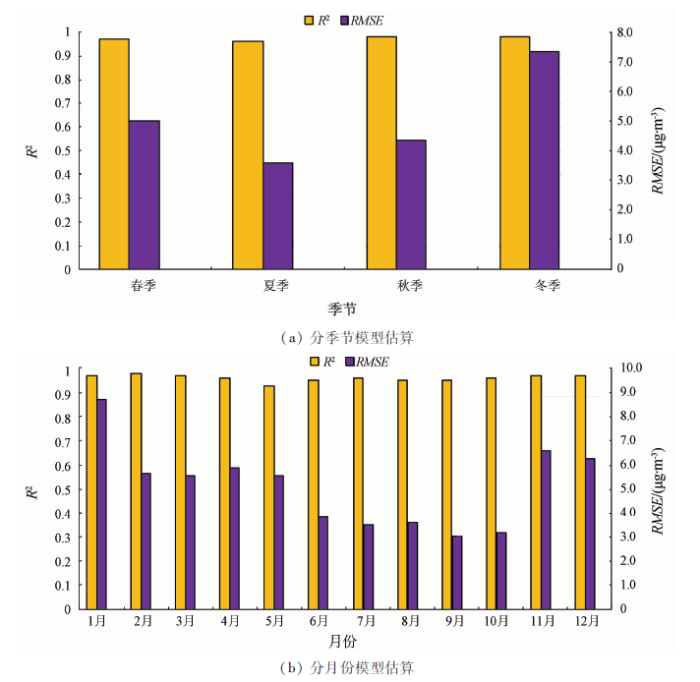
图4
分季节和分月份的模型估算结果
Fig.4
Estimated results of random forest model for four seasons and twelve months
图5
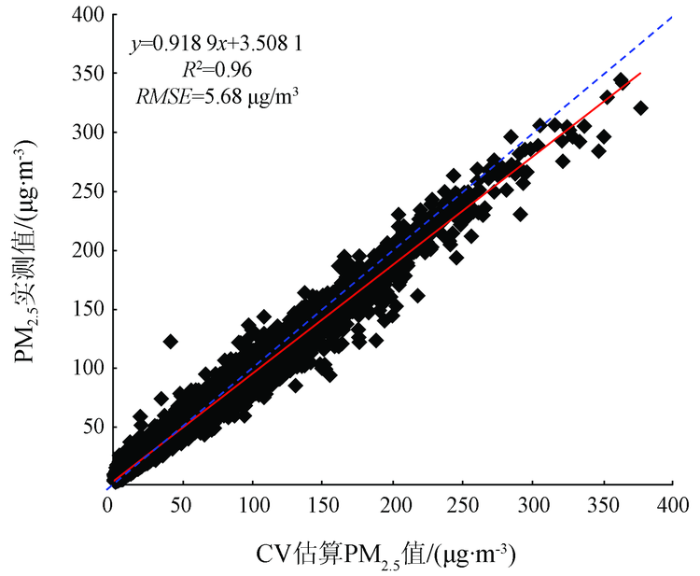
表2 全年和4个季节的模型CV估算结果
Tab.2
| 时间 | R2 | RMSE/(μg·m-3) |
|---|---|---|
| 全年 | 0.97 | 5.73 |
| 春季 | 0.97 | 5.99 |
| 夏季 | 0.95 | 3.99 |
| 秋季 | 0.96 | 4.62 |
| 冬季 | 0.96 | 7.66 |
3.3 区域PM2.5浓度估算
图6分别显示了2018年YRD和PRD区域的年均PM2.5浓度分布和46个城市的年均PM2.5浓度分布。从图6可以看出,整个研究区的PM2.5年均浓度在29~64 μg/m3之间,其中,位于YRD的大部分地区PM2.5年均浓度均超过46 μg/m3。46个城市中,PM2.5年均浓度的高值区域主要分布在江苏省的所有城市(PM2.5≥40 μg/m3),其中,徐州市、无锡市和宿迁市是空气污染最严重的3个地区,年均PM2.5浓度值超过50 μg/m3; 而浙江省南部地区的年均PM2.5浓度均低于35 μg/m3,其中,PM2.5年均浓度的最低值位于浙江省的丽水市。PRD地区的PM2.5年均浓度总体比YRD的低,其中,广州市、东莞市和佛山市等城市的PM2.5年均浓度高于其他省内城市。对比YRD和PRD区域的地表高程可以看出,海拔较低的YRD北部地区的PM2.5年均浓度较高,而海拔较高的PRD北部部分区域则表现为PM2.5年均浓度相对较低。这是由于频繁的人类活动主要集中在海拔较低的平原,由人类活动带来的汽车尾气和工业排放的废气会使空气中的颗粒物浓度急剧升高。
图6
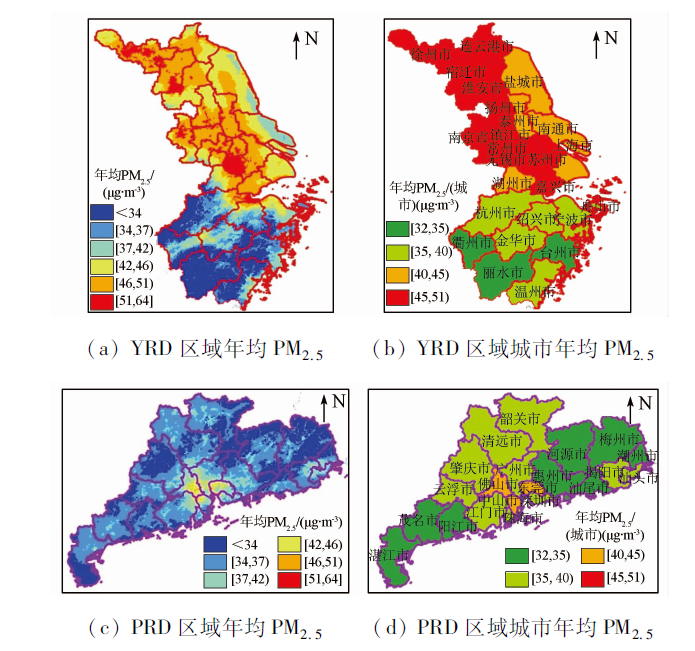
图6
YRD和PRD区域的年均PM2.5浓度空间分布
Fig.6
Spatial distribution of annual PM2.5 concentrations in YRD and PRD
图7显示了YRD和PRD区域4季的PM2.5平均浓度。4个季节中,冬季的PM2.5浓度最高(~46.32 μg/m3),其次是春季(~38.80 μg/m3)和秋季(~36.15 μg/m3); 夏季的PM2.5平均值最低,仅为30.16 μg/m3,比冬季低35%。分地区来看,YRD地区4个季节的平均PM2.5浓度要高于PRD。从图7还可以看出,PM2.5季均浓度的高值区域全部位于YRD的北部,其中,徐州市、无锡市和宿迁市等城市的冬季PM2.5平均浓度分别达到71.38 μg/m3,68.91 μg/m3和68.82 μg/m3。此外,位于PRD地区的广州市、东莞市和佛山市的PM2.5季均浓度要略高于广东省的其他城市。本文的研究成果与Ma等[13]和Song等[30]的研究结果基本一致,均体现出了位于YRD的徐州市、无锡市和宿迁市以及位于PRD的广州市、东莞市和佛山市等城市的空气污染状况较严重。进一步对YRD和PRD区域的PM2.5浓度季节性变化进行分析。总体来看,该区域的边界层高度(PBLH)夏季较高,冬季较低; 而气压(PS)与PBLH相比则呈现相反的趋势。较低的大气边界层高度以及较高的气压等不利条件均易使空气中的颗粒物浓度迅速增加,因此,这也是导致YRD和PRD区域的PM2.5浓度呈现冬春2季高于夏秋2季的重要原因。
图7
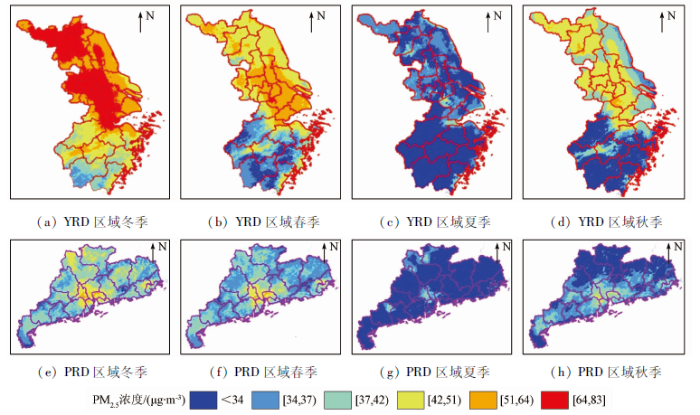
图7
YRD和PRD区域4季的PM2.5空间分布
Fig.7
Spatial distribution of seasonal PM2.5 concentrations in YRD and PRD
4 结论
本研究基于MODIS 3 km AOD、气象因子、植被覆盖度和道路密度等多类参数,构建了2层随机森林模型来估算YRD和PRD地区的近地面PM2.5浓度,得到以下结论:
1) AOD是解释YRD和PRD地区PM2.5浓度变化的最重要变量之一,利用随机森林模型可有效填补高反射率地表的AOD值,从而获得连续的AOD空间分布。
2) 由2层随机森林模型反演的YRD和PRD地区的PM2.5浓度与地面实测值高度相关; 分季节的模型性能对比结果也表明了本研究的2层随机森林模型在YRD和PRD地区具有较高的PM2.5反演能力。
3) 已有研究结果表明YRD和PRD地区的冬春2季PM2.5浓度均高于夏秋2季,这与本文的结论相似。此外,已有研究主要利用AOD来反演YRD和PRD地区的PM2.5浓度,并未获取连续空间分布的AOD,结果有失准确性。本文利用2层随机森林模型获取了研究区全空间覆盖的PM2.5浓度空间分布,从而更清晰地揭示了YRD和PRD地区的PM2.5污染的时空分异趋势。
本研究还存在几点不足: 首先,本研究没有考虑地面环境监测站点的地理位置差异,因此,模型的估算精度是否会受站点地理位置的影响还需要进一步验证; 其次,本研究提出的模型虽然获得了较高的R2,但模型的RMSE也略高于一些应用在欧美国家的模型。因此,今后的研究将进一步考虑地理位置以及人为因素(如: 人口密度和工业污染源)等对区域近地面PM2.5浓度的影响。
志谢:
本研究所用的MODIS数据和气象数据由美国国家航空航天局(NASA)提供,在此表示感谢。
参考文献
Strong air pollution causes widespread haze-clouds over China
[J].
Long-term atmospheric visibility trend in Southeast China,1973—2010
[J].
Satellite-based ground PM2.5 estimation using timely structure adaptive modeling
[J].
MERSI和MODIS卫星监测京津冀及周边地区PM2.5浓度
[J].
Utilization of MERSI and MODIS data to monitor PM2.5 concentrations in Beijing-Tianjin-Hebei and its surrounding areas
[J].
Long-term visibility trends and characteristics in the region of Beijing,Tianjin,and Hebei,China
[J].
Winter and summer PM2.5 chemical compositions in fourteen Chinese cities
[J].
Spatial distribution,seasonal variation and regionalization of PM2.5 concentrations in China
[J].
A consistent aerosol optical depth (AOD) dataset over mainland China by integration of several AOD products
[J].
Estimating ground-level PM2.5 using aerosol optical depth determined from satellite remote sensing
[J].
Retrieval of aerosol optical properties over the Beijing area using POLDER/PARASOL satellite polarization measurements
[J].
DOI:10.1007/s00376-009-8103-x
URL
[本文引用: 1]

Aerosol optical properties over Beijing and Xianghe under several typical weather conditions (clear sky, light haze, heavy pollution and dust storm) are derived from POLDER (POLarization and Directionality of the Earth’s Reflectances)/PARASOL (Polarization and Anisotropy of Reflectances for Atmospheric Sciences coupled with Observations from a Lidar) multi-directional, multi-spectral polarized signals using a more reliable retrieval algorithm as proposed in this paper. The results are compared with those of the operational retrieval algorithm of POLDER/PARASOL group and the ground-based AERONET (AErosol RObotic NETwork)/PHOTONS (PHOtométrie pour le Traitement Opérational de Normalisation Satellitaire) measurements. It is shown that the aerosol optical parameters derived from the improved algorithm agree well with AERONET/PHOTONS measurement. The retrieval accuracies of aerosol optical thickness (AOT) and effective radius are 0.06 and 0.05 μm respectively, which are close to or better than the required accuracies (0.04 for AOT and 0.1 μm for effective radius) for estimating aerosol direct forcing.]]>
Comparison of MODIS 3 km and 10 km resolution aerosol optical depth retrievals over land with airborne sunphotometer measurements during ARCTAS summer 2008
[J].
卫星遥感监测近地表细颗粒物多元回归方法研究
[J].
A study of multiple regression method for estimating concentration of fine particulate matter using satellite remote sensing
[J].
Satellite-derived high resolution PM2.5 concentrations in Yangtze River Delta region of China using improved linear mixed effects model
[J].
Particulate matter air quality assessment using integrated surface,satellite,and meteorological products:2.A neural network approach
[J].
DOI:10.1029/2008JE003285
URL
PMID:27630378
[本文引用: 2]
The first systematic observations of the middle atmosphere of Mars (35km-80km) with the Mars Climate Sounder (MCS) show dramatic patterns of diurnal thermal variation, evident in retrievals of temperature and water ice opacity. At the time of writing, the dataset of MCS limb retrievals is sufficient for spectral analysis within a limited range of latitudes and seasons. This analysis shows that these thermal variations are almost exclusively associated with a diurnal thermal tide. Using a Martian General Circulation Model to extend our analysis we show that the diurnal thermal tide dominates these patterns for all latitudes and all seasons.
Satellite-based estimation of regional particulate matter (PM) in Beijing using vertical-and-RH correcting method
[J].
Development of PM2.5 and NO2 models in a LUR framework incorporating satellite remote sensing and air quality model data in Pearl River Delta region,China
[J].
LUR模型模拟的南昌市PM2.5浓度与土地利用类型的关系
[J].
Relationship of PM2.5 concentration and land use type in Nanchang City based on LUR simulation
[J].
Ground level PM2.5 estimates over China using satellite-based geographically weighted regression (GWR) models are improved by including NO2 and enhanced vegetation index (EVI)
[J].DOI:10.3390/ijerph13121215 URL [本文引用: 1]
High-resolution spatiotemporal mapping of PM2.5 concentrations at mainland China using a combined BME-GWR technique
[J].
A Geographically and temporally weighted regression model for ground-level PM2.5 estimation from satellite-derived 500 m resolution AOD
[J].
Satellite-based mapping of daily high-resolution ground PM2.5 in China via space-time regression modeling
[J].
A novel calibration approach of MODIS AOD data to predict PM2.5 concentrations
[J].
MODIS卫星遥感估计福州地区近地面PM2.5浓度
[J].
Estimation of ground-level PM2.5 concentrations using MODIS satellite data in Fuzhou,China
[J].
Estimating ground-level PM2.5 over a coastal region of China using satellite AOD and a combined model
[J].
Assessment of PM2.5 concentrations over bright surfaces using MODIS satellite observations
[J].DOI:10.1016/j.rse.2015.03.014 URL [本文引用: 1]
Estimating ground-level PM2.5 in China using satellite remote sensing
[J].
Comparing different methods for statistical modeling of particulate matter in Tehran,Iran
[J].
Estimating PM2.5 concentrations in the conterminous united states using the random forest approach
[J].
Predicting daily urban fine particulate matter concentrations using a random forest model
[J].
DOI:10.1021/acs.est.7b05381
URL
PMID:29537833
[本文引用: 1]
The short-term and acute health effects of fine particulate matter less than 2.5 mum (PM2.5) have highlighted the need for exposure assessment models with high spatiotemporal resolution. Here, we utilize satellite, meteorologic, atmospheric, and land-use data to train a random forest model capable of accurately predicting daily PM2.5 concentrations at a resolution of 1 x 1 km throughout an urban area encompassing seven counties. Unlike previous models based on aerosol optical density (AOD), we show that the missingness of AOD is an effective predictor of ground-level PM2.5 and create an ensemble model that explicitly deals with AOD missingness and is capable of predicting with complete spatial and temporal coverage of the study domain. Our model performed well with an overall cross-validated root mean squared error (RMSE) of 2.22 mug/m(3) and a cross-validated R(2) of 0.91. We illustrate the daily changing spatial patterns of PM2.5 concentrations across our urban study area made possible by our accurate, high-resolution model. The model will facilitate high-resolution assessment of both long-term and acute PM2.5 exposures in order to quantify their associations with related health outcomes.
A satellite-based geographically weighted regression model for regional PM2.5 estimation over the Pearl River Delta region in China
[J].
A random forest-based framework for crop mapping using temporal,spectral,textural and polarimetric observations
[J].
Predicting monthly high-resolution PM2.5 concentrations with random forest model in the North China Plain
[J].
DOI:10.1016/j.envpol.2018.07.016
URL
PMID:30025341
[本文引用: 1]
Exposure to fine particulate matter (PM2.5) remains a worldwide public health issue. However, epidemiological studies on the chronic health impacts of PM2.5 in the developing countries are hindered by the lack of monitoring data. Despite the recent development of using satellite remote sensing to predict ground-level PM2.5 concentrations in China, methods for generating reliable historical PM2.5 exposure, especially prior to the construction of PM2.5 monitoring network in 2013, are still very rare. In this study, a high-performance machine-learning model was developed directly at monthly level to estimate PM2.5 levels in North China Plain. We developed a random forest model using the latest Multi-angle implementation of atmospheric correction (MAIAC) aerosol optical depth (AOD), meteorological parameters, land cover and ground PM2.5 measurements from 2013 to 2015. A multiple imputation method was applied to fill the missing values of AOD. We used 10-fold cross-validation (CV) to evaluate model performance and a separate time period, January 2016 to December 2016, was used to validate our model's capability of predicting historical PM2.5 concentrations. The overall model CV R(2) and relative prediction error (RPE) were 0.88 and 18.7%, respectively. Validation results beyond the modeling period (2013-2015) shown that this model can accurately predict historical PM2.5 concentrations at the monthly (R(2)=0.74, RPE=27.6%), seasonal (R(2)=0.78, RPE=21.2%) and annual (R(2)=0.76, RPE=16.9%) level. The annual mean predicted PM2.5 concentration from 2013 to 2016 in our study domain was 67.7 mug/m3 and Southern Hebei, Western Shandong and Northern Henan were the most polluted areas. Using this computationally efficient, monthly and high-resolution model, we can provide reliable historical PM2.5 concentrations for epidemiological studies on PM2.5 health effects in China.
