

0 引言
针对区域生态环境脆弱性评价,学者们已在其定义[1,2,3]、地区选择[1,5,6]、指标体选择[3,7-10]和计算模型的选择[3,11-13]等方面取得诸多成果。特别是已经形成层次分析(analytic hierarchy process,AHP)[3,12,14]、主成分[2,15-17]、投影寻踪[5,18-19]和信息熵[20,21]等多种评价模型。近年来,随着研究不断深入,研究员发现仍有2项不足尚需完善: ①大多成果主要针对地区生态环境脆弱性现状进行评价或变化分析,却忽视了未来发展状况的模拟预测[22,23],然而实现其发展预测却有着重要的意义[24]; ②大多学者在进行指标权重确定时,均仅从其属性或数量结构单方面进行计算具有一定局限[25,26]。李峰等[25]借助AHP-PCA模型对典型煤矿城市的生态环境状况进行了评估分析; 夏兴生等[26]以三峡库区(重庆段)为研究区,结合AHP-PCA熵组合权重模型对该地区生态环境的脆弱状况进行了评价与分析; 陈朝亮等[27]利用AHP-Logistic熵权模型实现了内江市地质灾害的风险评价。这些成果均表明,利用最小相对信息熵模型将各指标从属性和数量结构计算得到的权重,进行优化重组而计算得到的权重比从单方面计算的结果更具准确性[28,29]。
1 研究区概况及数据源
1.1 研究区概况
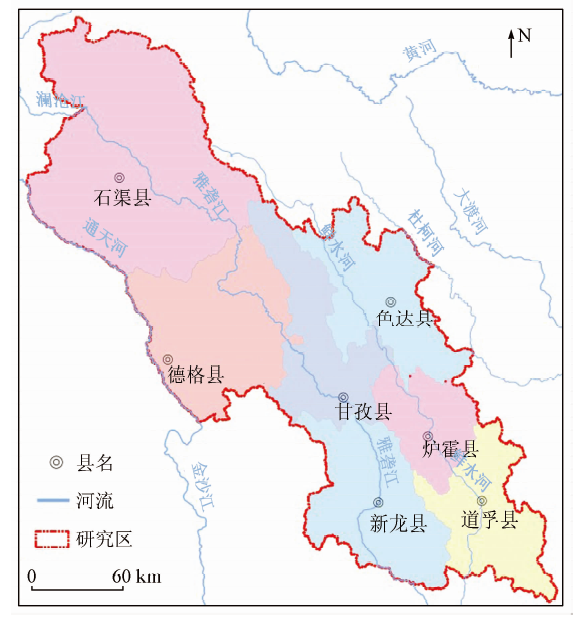
该地区位于四川省西北部(N30°32'~34°20',E97°20'~101°44'),总面积约67 257 km2,主要包括石渠、德格、甘孜、色达和新龙等7个县级行政单元(图1)。地形呈现西北向东南倾斜的变化形态,西北相比东南地区地势相对陡峭,地区海拔平均值约4 929.26 m,地貌类型以中山和高山地貌为主。区域年平均气温相对较低约1.14 ℃,年累计降水量在451.23~962.86 mm之间且主要集中于5—10月。地区土地生态景观以有林地、疏林地和中高覆盖度草地为主,耕地和建设用地资源相对稀缺。草毡土、黑毡土和灰褐土等为其主要的土壤类型。受海拔高、温度低、土壤贫瘠和地质灾害频发等自然条件的限制,区域生态环境先天性脆弱。
图1
1.2 数据来源
研究的基础数据主要是利用遥感技术和统计手段2种方法获取(表1)。
表1 研究区基础数据来源及描述
Tab.1
| 名称及描述 | 数据来源 |
|---|---|
| 雅砻江中上游流域90 m空间分辨率DEM数据 | 地理空间数据云平台(http: //www.gscloud.cn) |
| 雅砻江中上游流域1∶100万矢量土壤类型数据 | 中国土壤数据库 |
| 2000—2018年研究区及周边气象观测数据 | 中国气象数据网(http: //data.cma.cn/) |
| 2000—2018年研究区1∶10万土地利用类型矢量数据,分为水田、旱地、有林地和疏林地等22个二级类 | 中国科学院资源环境科学数据中心(http: //www.resdc.cn) |
| 各年份6—8月的MODIS-NDVI数据,空间分辨率250 m,周期16 d,采用最大化合成获取最终成果数据 | NASA |
| 各年份各县的人口和GDP统计数据 | 《四川省统计年鉴》及各县统计公报等资料 |
| 全国1∶10万土壤侵蚀强度等级遥感解译成果矢量数据 | 国家地球系统科学数据共享平台 (http: //loess.geodata.cn) |
2 研究方法
2.1 指标与数据
2.1.1 指标体系构建
2.1.2 基础数据处理
图2-1
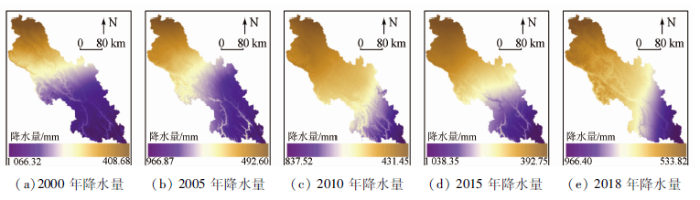
图2-1
流域年累计降水量和年均气温空间插值
Fig.2-1
Annual precipitation and average annual temperature spatial interpolation in the basin
图2-2
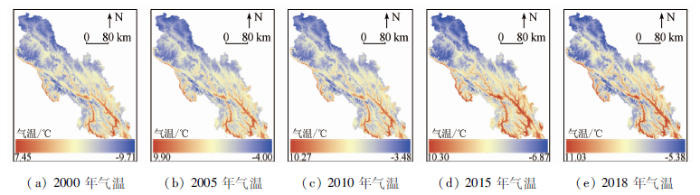
图2-2
流域年累计降水量和年均气温空间插值
Fig.2-2
Annual precipitation and average annual temperature spatial interpolation in the basin
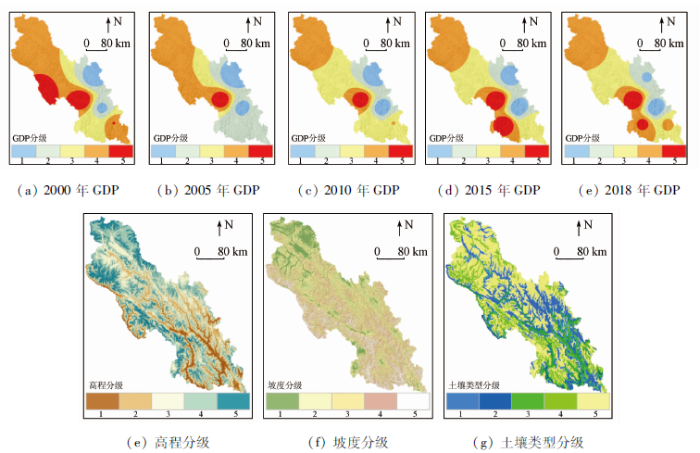
2)基础数据分级。由于各指标在维度和表达方式上存在明显差异无法直接比较,在参考已有成果的基础上[11,19,32],将9项指标均分为5个等级。一方面,土地数据主要在参考已有成果的基础上[11,19,32]结合地区实际将各地类进行初分级,然后将其与土壤侵蚀类型/强度图叠加进行分类修正(表2); 土壤类型则在参考已有成果的基础上[18,19,33],结合其贫瘠程度和保水性等完成分级(表2)。另一方面,针对其他7项指标则采用“自然间断点分级”的方式完成,其以数据空间“空间聚类”原理为基础,具有操作简便且准确度较高的优势[19,32](图3),图例数字为指标分级数值,指标若与脆弱性呈正相关,数值越大生态环境越脆弱; 负相关则相反。
表2 研究区土地利用和土壤类型分级
Tab.2
| 指标 | 分级 | ||||
|---|---|---|---|---|---|
| 1 | 2 | 3 | 4 | 5 | |
| 土壤类型 | 泥炭土、草甸土、黑毡土和粗骨土 | 褐土 | 湖泊、水库、灰褐土、棕壤和棕色针叶林土 | 寒冻土、沼泽土、石质土和暗棕壤 | 草毡土 |
| 土地利用 类型 | 有林地、灌木林地和高度盖度草地 | 中覆盖度草地、疏林地、沼泽地和旱地 | 低覆盖度草地、河渠、湖泊、水库坑塘和滩地 | 城镇用地、农村居民点和其他建设用地 | 裸岩石质地 |
图3-1
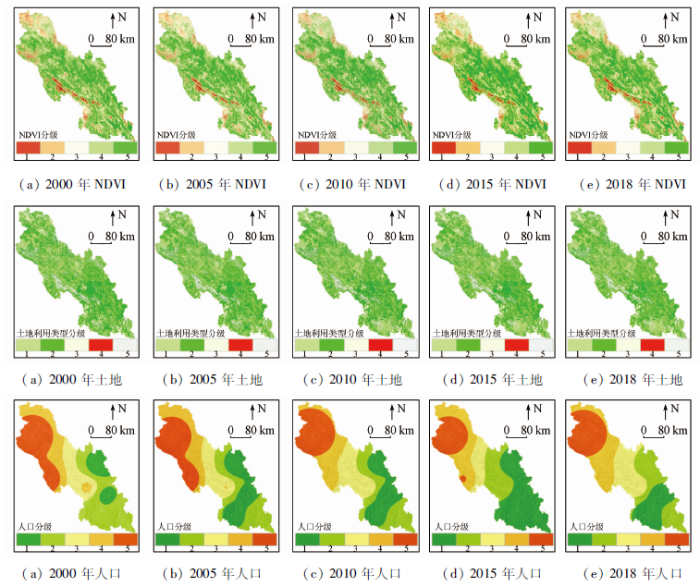
图3-2
3)坐标系统与分辨率统一。为确保各指标在空间位置上有较好的重合性,研究规定9项指标均采用Krasovsky_1940_Albers坐标系统,空间分辨率均为250 m。
2.2 评价模型
2.2.1 数据标准化
正相关指标为:
负相关指标为:
式中:
2.2.2 权重计算
表3 研究区各指标AHP计算权重
Tab.3
| 决策层 | 方案层 | 指标层 | 权重 |
|---|---|---|---|
| 生态环境脆弱性 | 土地生态 (0.528 7) | NDVI | 0.307 5 |
| 土地利用类型 | 0.163 4 | ||
| 土壤类型 | 0.057 9 | ||
| 气候 (0.268 7) | 年降水量 | 0.089 6 | |
| 年均气温 | 0.179 1 | ||
| 地形 (0.134 3) | 高程 | 0.100 6 | |
| 坡度 | 0.033 6 | ||
| 社会 (0.068 3) | GDP | 0.045 5 | |
| 人口 | 0.022 8 |
式中:
同时,由拉格朗日中值定理可知:
研究利用AHP-PCA熵组合权重模型完成不同年份各指标数据的最终权重计算(表4)。
表4 2000—2018年流域地区各指标权重
Tab.4
| 指标 | W1j | 2000年 | 2005年 | 2010年 | 2015年 | 2018年 | |||||
|---|---|---|---|---|---|---|---|---|---|---|---|
| W2j | Wj | W2j | Wj | W2j | Wj | W2j | Wj | W2j | Wj | ||
| NDVI | 0.307 5 | 0.064 4 | 0.163 1 | 0.076 8 | 0.173 8 | 0.077 8 | 0.176 5 | 0.061 3 | 0.161 8 | 0.077 9 | 0.177 2 |
| 土地利用类型 | 0.163 4 | 0.091 2 | 0.141 6 | 0.118 8 | 0.157 6 | 0.098 2 | 0.144 6 | 0.087 7 | 0.141 1 | 0.096 4 | 0.143 7 |
| 年降水量 | 0.089 6 | 0.119 7 | 0.120 1 | 0.059 3 | 0.082 5 | 0.071 7 | 0.091 5 | 0.079 1 | 0.099 3 | 0.067 9 | 0.089 3 |
| DEM | 0.100 6 | 0.060 8 | 0.090 7 | 0.094 6 | 0.110 3 | 0.084 2 | 0.105 0 | 0.058 9 | 0.090 7 | 0.082 6 | 0.104 4 |
| 年均气温 | 0.179 1 | 0.070 7 | 0.130 5 | 0.100 4 | 0.151 6 | 0.092 6 | 0.147 0 | 0.070 5 | 0.132 5 | 0.087 3 | 0.143 2 |
| 土壤类型 | 0.057 9 | 0.182 1 | 0.119 1 | 0.199 7 | 0.121 6 | 0.197 3 | 0.122 0 | 0.190 4 | 0.123 8 | 0.195 4 | 0.121 8 |
| 坡度 | 0.033 6 | 0.167 4 | 0.087 0 | 0.193 8 | 0.091 3 | 0.198 1 | 0.093 1 | 0.195 2 | 0.095 5 | 0.198 9 | 0.093 6 |
| GDP | 0.045 5 | 0.127 1 | 0.088 2 | 0.055 9 | 0.057 1 | 0.063 8 | 0.061 5 | 0.141 7 | 0.094 7 | 0.077 7 | 0.068 1 |
| 人口 | 0.022 8 | 0.116 6 | 0.059 8 | 0.100 7 | 0.054 2 | 0.116 4 | 0.058 8 | 0.115 1 | 0.060 4 | 0.115 8 | 0.058 8 |
2.2.3 脆弱性指数
式中:
2.3 脆弱性分等定级
研究先采用“自然间断点分级法”将各年份EVI值进行分级,分别找到各等级上下限阈值,最后取同等级阈值的均值为数据分类最终的标准,最后将EVI分为5级: I级,潜在(<0.284 0); II级,微度[0.284 0,0.495 8); III级,轻度[0.495 8,0.642 8); IV级,中度[0.642 8,0.744 7); V级,重度(≥0.744 7)。等级越高脆弱程度越严重。
2.4 脆弱性综合指数
式中:
2.5 CA-Markov模型
元胞自动机(cellular automata,CA)是一种能实现巨复杂系统时空演变过程模拟的数学模型[35],模型为:
式中:
式中:
研究以IDRISI17.0软件为工具,以2005和2010年数据为基础计算其概率矩阵,以迭代系数取10,过滤器为5×5,等比例系数为0.15的参数设置,完成2015年脆弱性成果的预测,采用CROSSTAB模块完成真实和模拟成果Kappa系数的计算与精度验证。同理,完成该地区2021年的模拟预测。
3 结果与分析
3.1 空间分布
研究结合空间分布特征(图4)分析可知,流域生态环境脆弱性整体呈现出由北向南逐渐降低的空间变化,南部相比北部地区的脆弱程度相对较低。
图4
图4
2000—2018年雅砻江中上游流域生态环境脆弱性评价结果
Fig.4
Assessment results of ecological environment vulnerability in the middle and upper reaches of Yalong River from 2000 to 2018
同时,流域地区各等级脆弱区在空间分布上也呈现出明显的区域差异性。潜在和微度脆弱区的空间分布范围最广,约占据整个地区的65%,其大部分主要分布于雅砻江和鲜水河干流两侧地势相对平缓的中山区,小部分位于河谷两侧高植被覆盖的高山区,结合土地利用类型可知,其是流域地区社会经济发展的核心区居民点和建设用地主要集中区。此外,其主要的土地景观类型包括有林地、高覆盖度草地和耕地等。轻度脆弱区约占据整个地区的25%,大多主要集中于流域的河谷两侧的中高山区,其人口密度相对较低,人类活动不明显,结合地形资料分析可知,其是区域水土流失和生态环境保护重要的缓冲区与重点监测预防区,主要的生态系统相对复杂多样,土地景观以中覆盖度草地和疏林地为主。中度和重度脆弱区在整个研究区的占比最小,约为10%,主要集中分布于石渠县北部和西南部,在甘孜县和德格县西南部地区也均有零散分布,结合这2个等级脆弱区的环境特征可知,其主要的地貌类型以高山和高原为主,具有海拔高、温度低和生态系统结构相对简单,以低覆盖度草地和裸岩石质地为主。
3.2 结构特征
对各等级脆弱区栅格比例进行分析,能有助于进一步全面了解该地区生态环境脆弱状况的结果差异和变化特征(表5)。
表5 2000—2018年雅砻江流域各等级脆弱区栅格数及比例
Tab.5
| 等级 | 2000年 | 2005年 | 2010年 | 2015年 | 2018年 | |||||
|---|---|---|---|---|---|---|---|---|---|---|
| 栅格数 | 比例/% | 栅格数 | 比例/% | 栅格数 | 比例/% | 栅格数 | 比例/% | 栅格数 | 比例/% | |
| 潜在 | 202 043 | 18.77 | 205 514 | 19.10 | 205 124 | 19.06 | 207 976 | 19.33 | 215 774 | 20.05 |
| 微度 | 395 374 | 36.74 | 398 513 | 37.03 | 405 941 | 37.72 | 413 468 | 38.42 | 412 936 | 38.37 |
| 轻度 | 266 690 | 24.78 | 275 921 | 25.64 | 273 948 | 25.46 | 271 215 | 25.20 | 271 778 | 25.26 |
| 中度 | 120 452 | 11.19 | 119 127 | 11.07 | 119 614 | 11.12 | 117 882 | 10.95 | 113 105 | 10.51 |
| 重度 | 91 576 | 8.51 | 77 060 | 7.16 | 71 508 | 6.64 | 65 594 | 6.10 | 62 535 | 5.81 |
分析表5可知,各等级栅格比例在结构分布上存在较明显的差异性,其比例大小关系为微度>轻度>潜在>中度>重度。以2018年为例,微度的比例最大为38.37%,重度最小仅为5.81%,而轻度、潜在和中度的比例分别为25.26%,20.05%和10.51%,处于居中且数值依次降低。同时,2000—2018年间轻度及以下程度脆弱区的栅格比例均占据整个地区的80%以上,客观程度上可以判定研究期内该地区生态环境脆弱性整体持续处于中等脆弱水平。
3.3 预测结果
2015年真实与模拟成果的Kappa系数检验值为0.857 6,表明模拟结果整体精度较高,CA-Markov模型适用于该预测研究。同时,为进一步研究该地区生态环境脆弱性未来发展状况,又对其2021年状况进行模拟预测(图5)。
图5
图5
流域2015和2021年脆弱性预测模拟结果
Fig.5
Simulation results of vulnerability prediction in 2015 and 2021
通过分析2015年预测模拟结果可知: 其空间分布特征与真实成果基本吻合; 2015年潜在、微度、轻度、中度和重度预测的栅格比例分别为19.00%,37.73%,25.79%,11.87%和5.62%,通过与该年份各类别真实比例进行对比可以发现,各类别预测的准确度呈现潜在>微度>轻度>中度>重度的变化状态; 精度检验表明CA-Markov模型在实现该地区生态环境脆弱性预测分析时,不仅整体的预测精度较高,各类别预测精度也较高; 2021年预测成果显示,潜在、微度、轻度、中度和重度各类别的栅格比例分别为20.18%,38.02%,25.71%,10.96%和5.13%,相比2018年潜在、轻度和重度的占比呈增加的变化趋势,而微度和重度则表现出减少的变化趋势。
3.4 趋势变化
研究利用式(8)对2000年、2005年、2010年、2015年和2018年该地区的E值进行计算,其数值分别为2.539 2,2.501 6,2.485 6,2.460 7和2.436 6,呈现出逐渐降低的变化趋势,这客观表征出近20 a内,流域地区生态环境整体呈现出好转的发展状态。同时,研究预测该地区2021年的ESVI为2.428 5,也呈现下降的变化趋势,这预示着随着系列环境措施的有效实施,区域生态环境整体将继续朝着持续好转的方向发展。
4 讨论与结论
4.1 讨论
以往单一的CA模型虽然能实现系统的空间演变,但其主要着眼于元胞的局部相互作用,存在局限性; 单一的Markov模型虽然能对系统整体的发展趋势进行预测,但是不能进行空间格局变化的分析; 而CA-Markov模型将两者进行有机结合则能有效弥补以上不足,既能有效实现系统空间格局的演变分析,又能对其未来发展状况进行科学预测模拟。CA-Markov模型最初被广泛运用于区域土地利用变化的预测研究中,随着研究进程不断加快,其也逐渐被用于植被覆盖度和土壤侵蚀的预测研究,且取得了较好的效果。因此,本研究尝试采用CA-Markov模型完成雅砻江中上游流域生态环境脆弱性状况的模拟预测,并结合Kappa系数对预测结果进行精度验证,结果表明该模型适用于地区生态环境脆弱性的模拟预测,其可作为区域生态环境脆弱性模拟预测的一种技术手段。
4.2 结论
研究以雅砻江中上游流域为对象,完成其2000—2018年生态环境脆弱性的动态评价及预测,主要结论如下:
1)雅砻江中上游流域整体呈现北部相比南部地区整体脆弱性相对较高的空间变化; 各等级栅格比例亦呈现微度、轻度、潜在、中度和重度逐渐下降的变化; 趋势变化和预测结果表明,该地区整体的生态环境质量将继续好转。
2)研究表明,将RS和GIS与AHP-PCA熵权模型相结合进行生态环境脆弱性评价具有较高的准确性; 利用CA-Markov模型实现其未来发展预测的方法基本可行。同时,与以往的研究不同,本研究实现了多期成果长时间变化规律的探索且预测分析了区域生态环境未来发展,较有效弥补了该空缺。
由于部分资料是利用统计手段获取的属性数据,虽然可以通过栅格插值的方式将它们转换为空间数据,该方法也具备一定的合理性,但是数据精度仍然存在一定不足。因此,更科学合理地实现基础数据的搜集与处理,将有助于进一步提高研究成果的准确性。
参考文献
桂西北喀斯特区域生态环境脆弱性
[J].
The quantitative assessment of eco-environment vulnerability in Karst regions of northwest Guangxi
[J].
三江源地区生态环境脆弱性评价
[J].三江源地区的生态问题对全国经济和生态具有十分重要的影响,研究、分析其生态环境脆弱性具有重要的理论和现实意义。本文基于生态敏感性生态恢复力生态压力概念模型(SRP),选取了气温、降水、地形起伏度等16个评价指标,使用层次分析法(AHP)与主成分分析法相结合的手段,建立了三江源地区生态环境脆弱性评价指标体系,通过计算生态环境脆弱性指数(EEVI)对研究区生态环境进行定量分析与评价。结果表明:三江源地区生态环境以中度脆弱区为主,所占面积比例为45.55%,轻微、轻度、重度、极度脆弱区分别占总面积的5.76%、23.12%、20.14%和5.43%,重度与极重脆弱区集中分布在地形复杂的西北部裸地、低植被覆盖地带及人口、经济活动压力较大的东北部地区。
Evaluation of ecological environment vulnerability for Sanjiangyuan area
[J].The ecological situation in Sanjiangyuan area has an important influence on China’s national economy and ecology. Besides, studies on the ecological environment vulnerability also have its own theoretical and practical significance. Based on ecological sensitivityresiliencepressure (SRP) conceptual model, we selected sixteen evaluation indices (including temperature, precipitation, topography, etc.) and established the indicators system of ecological vulnerability evaluation in Sanjiangyuan area using the AHP method and the principal component analysis (PCA) method. Through calculating the ecological environment vulnerability index (EEVI), we conducted vulnerability analysis and evaluation of ecological environment in the study area. The results showed that, in the study area, moderately vulnerable areas occupied 45.55% of the total, while the slightly, lightly, heavily and extremely vulnerable areas occupied 5.76%, 23.12%, 20.14% and 5.43% respectively. The heavily and extremely vulnerable areas are primarily located in the bare soil and low vegetation coverage zones of the northwest part of Sanjiangyuan area and in the northeast part under the greater pressure of large population and economic activities.
基于栅格尺度的喀斯特槽谷区生态环境脆弱性时空分异研究
[J].
Spatio-temporal differentiation of ecological environment vulnerability in Karst trough region based on grid scale
[J].
闽三角城市群生态环境脆弱性及其驱动力
[J].
Ecological environmental vulnerability and its driving forces in urban agglomeration in the Fujian Delta region
[J].
长江上游安宁河流域生态环境脆弱性遥感监测
[J].
Monitoring eco-environmental vulnerability in Anning River Basin in the upper reaches of the Yangtze River using remote sensing techniques
[J].
吉林省西部地区生态脆弱性的动态评价
[J].
Dynamic evaluation of ecological vulnerability in western Jilin Province
[J].
基于DPRISM概念框架的生态环境脆弱性评价——以岷江上游为例
[J].
Assessment of eco-environmental vulnerability based on DPRISM conceptual framework:A case study of upper Minjiang River
[J].
资源型城市脆弱性评价——以攀枝花市为例
[J].
Vulnerability assessment of resource-based city:A case study of Panzhihua
[J].
基于SVM的安宁河流域生态环境脆弱性评价
[J].
Ecological frangibility evaluation of Anning River Basin in the Upper Yangtze River based on support vector machine
[J].
岷江上游生态环境脆弱性评价
[J].
Ecological environment vulnerability assessment in upper reaches of Minjiang River
[J].
岷江上游流域环境脆弱性评价
[J].
Evaluation of environmental vulnerability in the upper reaches of the Minjiang River
[J].
南水北调中线汉中市水源地生态脆弱性评价与特征分析
[J].
Analysis of eco-environmental vulnerability characteristics of Hanzhong City,near the water source midway along the route of the south-to-north water transfer project,China
[J].
岷江上游生态脆弱性评价
[J].
Assessment ecological vulnerability in the upper reaches of the Minjiang River
[J].
基于主成分分析的云南省生态脆弱性评价
[J].
Ecological vulnerability evaluation based on principal component analysis in Yunnan Province
[J].
基于SRP概念模型的沂蒙山区生态环境脆弱性评价
[J].
Vulnerability assessment of eco-environment in Yimeng Mountainous area of Shandong Province based on SRP conceptual model
[J].4.0). In the study area, moderately vulnerable area occupied 43.3% of the total, while the slightly, lightly, heavily, and extremely vulnerable areas occupied 6.1%, 33.8%, 15.9%, and 0.9%, respectively. The heavily and extremely vulnerable areas mainly located in the topographically complicated hilly area or the hill-plain ecotone with frequent human activities.]]>
Research on eco-environmental vulnerability evaluation of the Anning River Basin in the upper reaches of the Yangtze River
[J].
Environmental vulnerability assessment in middle-upper reaches of Dadu River watershed using projection pursuit model and GIS
[J].
A method to the impact assessment of the returning grazing land to grassland project on regional eco-environmental vulnerability
[J].
基于熵权计算的公路生态环境评价
[J].
Entropy weight-based evaluation of ecological environment along highways
[J].
GIS支持下的公路生态环境评价
[J].
GIS-based eco- environmental quality evaluation of highway
[J].
基于GIS和RBF的城郊区生态安全评价及变化趋势预测——以成都市龙泉驿区为例
[J].
Regional ecological security assessment and change trend prediction in per-urban areas based on GIS and RBF:A case study in Longquanyi District of Chengdu City
[J].
生态脆弱性评价与预测研究进展
[J].
Assessment and forecast of ecological vulnerability:A review
[J].
基于MCE-CA-Markov的三峡库区土地利用演变模拟及预测
[J].
Simulation and prediction of land use change in Three Gorges Reservoir Area based on MCE-CA-Markov
[J].
基于AHP-PCA模型的煤炭城市生态环境质量评价
[J].
Eco-environmental quality evaluation of coal city based on AHP-PCA model
[J].
基于AHP-PCA熵组合权重模型的三峡库区(重庆段)农业生态环境脆弱性评价
[J].
Evaluation for vulnerability of agroecological environment in Three Gorges Reservoir area(Chongqing section)based on AHP-PCA entropy combination weight mode
[J].
基于AHP-Logistic熵权模型的西南浅丘区地质灾害分布特征研究——以内江市为例
[J].
Distribution characteristics of geological hazards in southwestern shallow hill based on AHP-Logistic entropy combined weight model:A case study of Neijiang
[J].
基于熵组合权重属性识别模型的草原生态安全评价——以甘南黄河水源补给区为例
[J].
Ecological security evaluation of grassland based on combined weight on principle of relative entropy:A case of Yellow River water source areas of Gannan
[J].
区域生态安全评价的熵组合权重属性识别模型
[J].为合理地确定区域生态安全评价的指标权重,提出把指标的权重结构分为反映评价指标不同属性对生态安全等级的影响程度的主观权重,和反映各区域评价指标样本值差异信息对生态安全等级的影响程度的客观权重,可分别采用层次分析法和熵权法确定这些权重,再用最小相对信息熵原理把它们综合为组合权重;为体现单指标评价过程中的评价作用,提出用属性识别模型进行单指标评价的新思路;对组合权重值和单指标评价值进行相乘并累加,建立了区域生态安全评价的熵组合权重属性识别模型(AR-CWE)。结果说明:用AR-CWE既可利用指标中的专家主观经验信息,又可挖掘各区域评价指标样本值的客观差异信息,权重信息利用全面,评价结果合理,方法通用,在安全系统综合评价中具有一定的应用价值。
Attribute recognition method of regional ecological security evaluation based on combined weight on principle of relative entropy
[J].In order to determine indexes weights in regional ecological security evaluation, a weight structure of evaluation indexes consisted of subjective weight and objective weight was presented. The two weights can be computed by using Analytic Hierarchy Process and entropy weight method, and combination weight can be synthesized according to minimum relative information entropy principle. In order to realize the evaluation function of single index evaluation process, a new evaluation method of single index was proposed using attribute recognition model. And then a new model for evaluating regional ecological security, named AR-CWE for short, was established. The result shows that both subjective information of expert experience and objective variation information of samples values can be fully mixed using AR-CWE, and its evaluated results are reasonable. AR-CWE is a general and can be applied to comprehensive evaluation of different security systems.
四川省“十三五”生态保护与建设规划
[EB/OL].[
Sichuan Province’s “13th Five-Year Plan” for ecological protection and construction
[EB/OL].[
青藏高原东南缘气象要素Anusplin和Cokriging空间插值对比分析
[J].
DOI:10.7522/j.issn.1000-0534.2015.00037
URL
[本文引用: 1]

选取地形起伏度巨大的青藏高原东南缘为研究区,利用该研究区96个气象站点,结合高程数据,分别采用Cokriging和Anusplin空间插值方法,获取2010年250 m分辨率的年均温度和年累计降水插值曲面。并采用交叉验证方法对比Anusplin与Cokriging插值精度,分析了误差的空间分布特征,重点对比两种插值曲面差异较大的区域精度优劣,评价两种方法在复杂地区的适用性。结果表明,Anusplin在复杂地表的插值表现优于Cokriging,其中Anusplin气温插值的均方差仅为0.82℃,而Cokriging的均方差为1.45℃;两者的降水插值精度基本一致,但Anusplin在气象要素空间异质性大的区域优于Cokriging。因此,与Cokriging相比,Anusplin更适合青藏高原东南缘复杂地表气象要素空间插值。
Contrast on Anusplin and Cokriging meteorological spatial interpolation in southeastern margin of Qinghai-Xizang Plateau
[J].
DOI:10.7522/j.issn.1000-0534.2015.00037
URL
[本文引用: 1]
Meteorological data is the essential data of ecological, resources, environment, global change and other research areas. However, the meteorological in Mountain are rare and complex than in plain. And acquiring precise spatial grid meteorological data has been a difficult task in this area. Anusplin and Cokriging interpolation method are one of the most common method that considering terrain’impacts during the Meteorological Spatial Interpolation. To ensure which one is more suit for complex area, we take the most complex mountain area (the Southeastern margin of the Qinghai-Xizang Plateau) as study area to compare the two methods. Based on Anusplin and Cokriging meteorological spatial interpolation method separately, combined with the terrain data and 96 meteorological stations in the southeastern margin of the Qinghai-Xizang Plateau region, 250 m resolution average temperature and total precipitation interpolated surfaces in 2010 was obtained. With the cross-validation method comparison method, the interpolation accuracy of Anusplin and Cokriging was compared, and the spatial distribution of errors was analyzed. Applying relevant information, accurate of the two methods in local area where the result of interpolation are quite different was qualitatively analyzed. Through this, the method which is more suit for this area is sought out and the applicability of Anusplin in this area was assessed. The results showed that, Anusplin interpolation outperformed Cokriging. In the comparing of mean square error(RMSE) of the interpolation of temperature and precipitation, Anusplin temperature is only 0.82℃ and Cokriging is 1.45℃, the RMSE of precipitation of the two methodes are consistent, but Anusplin are superior to Cokriging in the highly heterogeneous area. Therefore Anusplin can achieve better results than Cokriging, indicating that Anusplin is suit for the interpolation in Southeastern Margin of Qinghai-Xizang Plateau.
Eco-environmental vulnerability evaluation in mountainous region using remote sensing and GIS:A case study in the upper reaches of Minjiang River,China
[J].DOI:10.1016/j.ecolmodel.2005.07.005 URL [本文引用: 3]
四川自然土壤和旱耕地土壤可蚀性特征研究
[J].
Soil erodibility characteristics of natural soil and dryland in Sichuan Province
[J].
三峡库区生态脆弱性评价
[J].
DOI:10.5846/stxb201309252364
URL
[本文引用: 2]
基于遥感和地理信息系统技术,采用"压力-状态-响应"评价模型,选取18个指标,利用空间主成分分析对2001-2010年三峡库区(重庆段)生态脆弱性进行综合定量评价,对生态脆弱性时空分布及动态变化进行分析。根据计算得到的生态脆弱性指数,将生态脆弱性划分为5个等级:微度脆弱、轻度脆弱、中度脆弱、重度脆弱和极度脆弱。通过统计不同脆弱性等级面积,求算得到生态脆弱性综合指数。结果表明:三峡库区(重庆段)2001-2010年生态脆弱性指数标准化平均值为4.23±1.29,整体处于中度脆弱。生态脆弱性空间分布呈现西高东低的格局特征,高度脆弱地区主要分布在中西部,低度脆弱地区主要分布在东北部和东南部。近10年生态脆弱性综合指数最小值为2002年的2.37,最大值为2008年的2.99,三峡水库蓄水后生态脆弱性综合指数逐年递增,2008年到达峰值后有所降低。三峡库区生态脆弱性是人类活动与自然环境相互作用的结果,城市生活污染、水土流失、植被状况等为主要的驱动因子。研究时段内三峡库区(重庆段)生态脆弱性呈现两极化趋势,高度脆弱地区的脆弱性显著增加,低度脆弱地区脆弱性明显降低。
Dynamic evaluation of ecological vulnerability in the Three Gorges Reservoir Region in Chongqing Municipality,China
[J].
草海湿地区域土地利用/覆被变化与预测研究
[J].
Analysis and prediction of land use and land cover changes in Caohai Wetland areas
[J].
1997—2017年锡林郭勒盟中部草原植被覆盖时空演变及预测
[J].
Spatial-temporal evolution and prediction of vegetation cover in central part of Xilingol grassland during 1997—2017
[J].
Study on NDVI changes in Weihe Watershed based on CA-Markov model
[J].
