

0 引言
目前国内外学者在土地利用遥感监测方面做了大量研究。在土地利用遥感分类方法上,常用的方法有面向对象的分类方法[10]、支持向量机 [11]、决策树分类法[12]、神经网络法[13]等。针对不同的场景和需求,学者们在其基础上进行了改进研究,例如,Alimjan等[14]用支持向量机改进了K最邻近分类方法; Bazi等[15]针对高分辨率无人机影像的目标监测提出一种新的卷积支持向量机网络。在土地利用分析方面上,除了常见的土地利用变化幅度、单一土地利用动态度、土地利用程度变化综合指数、景观格局指数等分析方法外[16],Aldwaik等[17]提出的了一种具有系统性的土地变化分析理论—强度变化分析理论,这种理论具有自上而下的层次性结构,可帮助研究人员深入理解土地利用变化过程[18],之后Sang等[19]对其此理论进行了补充,使其更加清晰明了地服务于区域的可持续发展。对于长时间序列的土地利用变化研究,传统的遥感处理软件如ENVI及ERDAS等无法满足大量遥感影像的快速处理需求。针对此挑战,谷歌公司研发了谷歌地球引擎(Google Earth Engine,GEE)平台—可以批量处理卫星影像等数据的云端运算平台,具有快速、批量处理“巨大”影像数据集的优势。目前,很多学者基于GEE平台开展了地表变化和生态参数反演等应用研究,空间范围从全球尺度、国家尺度到区域尺度[20,21,22]。而对于GEE中土地利用的研究,当前多为对其分类算法[23,24]与数量变化[25,26]的研究,鲜有对其强度变化的研究。
为探索煤炭开采活动背景下的地表土地利用变化特征,本文选取重要煤炭基地内蒙古自治区伊金霍洛旗为研究区,借助GEE云计算平台,以长时间序列Landsat遥感影像为数据源,提取研究区1990—2019年各时期的土地利用分布信息,并利用强度分析理论分析矿区土地利用变化特征,进而结合煤炭开采统计资料,揭示煤炭开采对不同土地利用类型的影响差异及在不同开采阶段的影响特征。
1 研究区概况
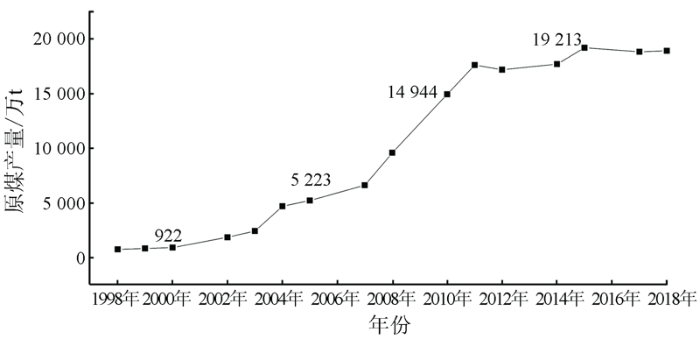
伊金霍洛旗隶属于内蒙古自治区鄂尔多斯市,位于我国黄河流域中上游区域,是我国北方重要的生态安全屏障,地理位置如图1所示。基本地势呈西高东低,海拔在1 070~1 556 m之间。东部属晋陕黄土高原的北缘水蚀沟壑丘陵区,中西部为坡梁起伏的鄂尔多斯高原,西南部是毛乌素沙漠,地表属于干燥剥蚀地带。伊金霍洛旗是亚洲中部草原向荒漠草原过渡的半干旱、干旱地带,有干旱少雨、日照强烈、冷热剧变、风大沙多的特点,自然生态十分脆弱。与此同时,该区域是我国重要的能源战略基地之一,有丰富的煤炭资源,煤炭开采活动始于20世纪90年代,历年的煤炭产量如图2所示。根据开采量变化趋势,煤炭开采活动大致划分为起步阶段(1990—2000年)、高速发展阶段(2000—2010年)及平稳发展阶段(2010—2019年)。伊金霍洛旗已查明煤炭资源储量约560亿t(
图1

图2
2 数据源及其处理
本文使用的数据有Landsat 5—8系列遥感影像、高空间分辨率卫星影像、数字高程模型(digital elevation model,DEM)、基础地理信息、原煤产量等。Landsat系列遥感影像来源于GEE平台(
遥感影像预处理。通过GEE平台筛选1990年、2000年、2005年、2010年、2015年及2019年6—8月份的Landsat卫星遥感影像,将含有云、阴影等的区域进行影像替换镶嵌,并结合矢量行政边界裁剪提取研究区遥感影像。
影像分类。根据国家现行土地利用分类标准(GB/T 21010—2017)及伊金霍洛旗的区域特点,将土地利用类型分为6类,即水域、耕地、植被、采矿用地、人工用地及裸地。水域指河流、水库、滩涂、沼泽等区域; 耕地指人工种植农作物的土地,包括熟地、新开发地、复垦地、休耕地等; 植被指生长乔木、灌木、竹类以及草本植物的土地; 采矿用地泛指采矿、采石、采砂(沙)场、砖瓦窑、尾矿堆放地等地面生产用地及附属设施; 人工用地泛指服务于人类居住生活及其附属设施的土地,如农村宅基地、城镇住宅用地、城镇商业服务用地、公共管理与服务用地; 裸地泛指表层为土质且无植被覆盖的土地。按此分类体系,采用随机森林[27]方法处理遥感影像,其分类标签通过目视解译高空间分辨卫星影像(GF-1/2/6)与Google Earth的历史高分辨率影像获取,并进行分类后处理,结果如图3所示。随机选取500个点对分类结果进行精度评定,包括Kappa系数与总体精度,计算结果如表1所示。根据影像分类精度与分类质量的关系: Kappa系数在[0.6,0.8)之间分类质量为很好,在[0.8,1.0]之间分类质量为极好,表明提取结果可以满足本文对数据质量的精度要求[28]。
图3
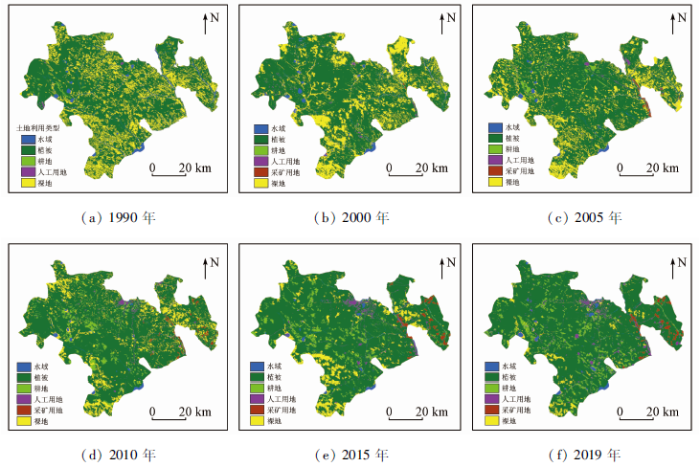
表1 分类结果精度
Tab.1
| 年份 | 总体精度 | Kappa系数 |
|---|---|---|
| 1990年 | 0.91 | 0.81 |
| 2000年 | 0.91 | 0.81 |
| 2005年 | 0.94 | 0.85 |
| 2010年 | 0.91 | 0.78 |
| 2015年 | 0.95 | 0.86 |
| 2019年 | 0.90 | 0.73 |
表2 研究区各土地利用类型面积及占比
Tab.2
| 土地利 用类型 | 1990年 | 2000年 | 2005年 | 2010年 | 2015年 | 2019年 | ||||||
|---|---|---|---|---|---|---|---|---|---|---|---|---|
| 面积/km2 | 占比/% | 面积/km2 | 占比/% | 面积/km2 | 占比/% | 面积/km2 | 占比/% | 面积/km2 | 占比/% | 面积/km2 | 占比/% | |
| 水域 | 150.89 | 2.75 | 123.14 | 2.25 | 91.99 | 1.68 | 57.18 | 1.04 | 74.25 | 1.35 | 87.79 | 1.60 |
| 植被 | 3 898.04 | 71.07 | 3 931.19 | 71.66 | 4 115.91 | 75.03 | 4 332.48 | 78.99 | 4 388.27 | 80.00 | 4 547.15 | 82.91 |
| 耕地 | 43.02 | 0.78 | 128.74 | 2.35 | 214.25 | 3.91 | 320.12 | 5.84 | 389.98 | 7.11 | 459.45 | 8.38 |
| 人工用地 | 8.36 | 0.15 | 31.10 | 0.57 | 42.77 | 0.78 | 65.52 | 1.19 | 112.34 | 2.05 | 146.69 | 2.67 |
| 采矿用地 | 0 | 0 | 3.19 | 0.06 | 21.32 | 0.39 | 42.27 | 0.77 | 68.51 | 1.25 | 75.90 | 1.38 |
| 裸地 | 1 384.74 | 25.25 | 1 267.69 | 23.11 | 998.81 | 18.21 | 667.48 | 12.17 | 451.70 | 8.24 | 168.07 | 3.06 |
3 强度变化分析
土地利用的强度变化分析理论是由Aldwaik等[17]于2012年提出的一种系统性的土地变化分析理论。此理论借助于土地利用的转移矩阵,自上而下从间隔层次、类别层次、转化层次3个层次深入分析土地利用变化过程。
3.1 间隔层次
间隔层次的强度分析反映了研究期每个时间间隔的土地利用面积总变化。强度分析使用观察变化强度S(t)(式(1))来解释t时期内土地利用变化,使用平均强度U(式(2))表达整个研究时期的年均变化强度。以U为基准,如果S(t)>U,则这一时期的土地利用的变化是快速的,反之则变化缓慢。具体计算公式为:
式中: J为土地利用类别数; Ctij为时间t内由第i类转化为第j类的面积;
图4
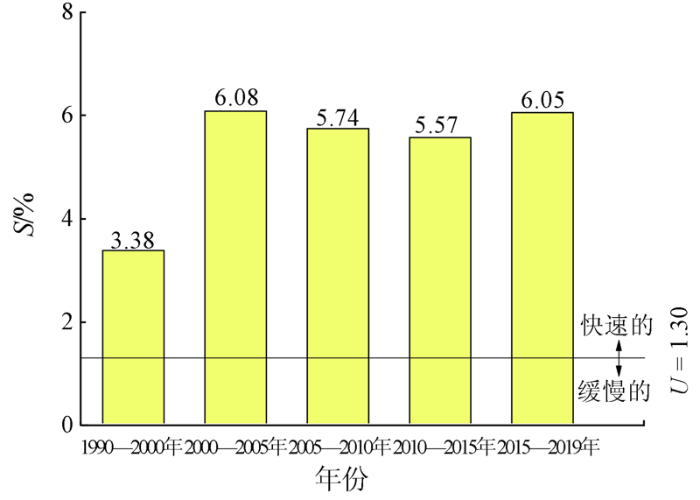
图4
土地利用变化强度-间隔层次
Fig.4
Land use intensity change of study area at interval level
3.2 类别层次
类别层次的强度分析研究的是特定时间间隔内每个土地利用类别的强度变化。它使用年均增加强度Gtj(式(3))和年均减少强度Lti(式(4))来解释某一类别的土地利用变化,具体公式为:
式中: Gtj为时间t内土地利用类别j的增加强度; Lti为时间t内土地利用类别i的减少强度。以观察变化强度S(t)为基准,如果Gtj或Lti大于S(t),则该土地利用类别处于活跃状态; 否则,它的变化则处于休眠状态。Gtj与Lti的差即为净增加强度。
结合土地利用转移矩阵及式(3)和(4)中得出结果如表3所示。
表3 土地利用变化强度-类别层次
Tab.3
| 类别 | 1990—2000年 (S=3.38%) | 2000—2005年 (S=6.08%) | 2005—2010年 (S=5.74%) | 2010—2015年 (S=5.57%) | 2015—2019年 (S=6.05%) | |||||
|---|---|---|---|---|---|---|---|---|---|---|
| 增加 | 减少 | 增加 | 减少 | 增加 | 减少 | 增加 | 减少 | 增加 | 减少 | |
| 水域 | 3.94 | 5.78 | 6.71 | 11.77 | 4.44 | 12.01 | 14.65 | 8.68 | 14.67 | 10.11 |
| 植被 | 2.33 | 2.24 | 4.51 | 3.67 | 4.15 | 3.10 | 3.44 | 3.18 | 4.01 | 3.10 |
| 耕地 | 29.20 | 9.27 | 28.46 | 15.17 | 25.10 | 15.22 | 25.32 | 16.40 | 22.87 | 18.42 |
| 人工用地 | 35.07 | 7.87 | 25.36 | 17.85 | 26.85 | 16.21 | 27.17 | 12.88 | 21.45 | 13.81 |
| 采矿用地 | — | — | 127.90 | 14.23 | 35.17 | 15.52 | 25.40 | 12.99 | 17.07 | 14.37 |
| 裸地 | 5.26 | 6.11 | 7.86 | 12.10 | 6.74 | 13.37 | 11.04 | 14.44 | 4.42 | 20.12 |
由表3可知,在煤炭开采起步阶段(1990—2000年),变化最为活跃的是人工用地和耕地,可以推断其主要原因是这两种用地类型总面积较小,且城市建设迅速、人口增长快等。对于水域,其减少强度大于增长强度,整体呈现减少趋势,主要受气候因子、用水量增加等影响。裸地的减少强度大于增加强度,整体呈减少趋势。植被的增加强度略大于减少强度,但由于其面积基数较大,其变化强度均小于观察变化强度3.38,处于休眠状态。
在煤炭开采高速发展阶段(2000—2010年),采矿用地是变化最活跃的,其净增加强度在2000—2005年间达到了113.67,远超这一期间的年均土地利用观察变化强度6.08; 在2005—2010年间达到了19.65,约为同时期年均土地利用变化强度的3.5倍。水域仍然呈减少趋势,且净减少强度较煤炭开采起步阶段更大,可以推断是由煤炭开采活动与气候因子、用水活动的叠加作用导致。耕地在两个阶段的净增加强度分别为13.29与9.88,体现了当地种植农业的快速发展。人工用地在2000—2005年间、2005—2010年间的净增加强度分别为7.51与10.64,体现了当地城镇建设的强度逐渐增强。裸地持续减少,植被持续增长,说明这一时期对裸地的利用有所加强,此外植树造林活动的持续开展使地表产生明显变化。
在煤炭开采平稳发展阶段(2010—2019年),采矿用地仍呈增长趋势,其净增加强度在2010—2015年间、2015—2019年间分别为12.41与2.7,较其高速发展阶段下降很多。耕地在2010—2015年间、2015—2019年间的净增加强度分别为8.83与4.45; 人工用地在2010—2015年间、2015—2019年间的净增加强度分别为14.29与7.64,这两类用地的增长强度均比上一阶段减弱。值得注意的是水域在这一阶段增加强度大于减少强度,呈增长趋势,可以推断研究区内在逐步实施生态环境保护措施。植被依旧呈现增长趋势并处于休眠状态。
依据上述分析,煤炭开采在不同阶段对各类用地的影响具有差异。煤炭开采起步阶段,对各种类型用地影响较小,地类的变化主要受气候因子、城镇开发活动等影响; 煤炭开采高速发展阶段,煤炭开采主要影响矿区及周边植被、裸地和水域。煤炭开采平稳发展阶段,对各地类的影响强度减小,加上相关环保措施的实施,使水域面积逐渐恢复。
3.3 转化层次
转化层次的强度分析研究了特定土地类别的转变。对于土地类别n,假设其在整个研究期间内呈增加趋势,Rtin(式(5))是在特定时间间隔t中从土地利用类别i到土地利用类别n的土地利用转化强度,Wtn是在该时间间隔期间的平均过渡强度(式(6))。对于土地类别n; Ptin(i)(式(7))从土地利用类别i的角度出发,描述在特定时间间隔t内从土地利用类别i到土地利用类别n的变化强度。
结合土地利用转移矩阵及式(5)—(7),采矿用地的转换结果如图5所示。采矿用地在煤炭开采起步阶段经历了从无到有的过程,因此无法计算这一期间的转化强度。由图5(a)可知,采矿用地的平均转化强度W在2000—2005年、2005—2010年、2010—2015年及2015—2019年间分别为0.07,0.14,0.20及0.22。这与研究区煤炭的开采量变化特征相吻合(图2),即煤炭的开采量在高速发展阶段增速较快增长,然后在平稳发展阶段基本保持稳定。从采矿用地视角看(图5(b)),采矿用地的主要转化来源是植被和裸地。植被在5个时段对采矿用地的转化占主导地位,且呈现增长趋势; 裸地在前4个时段对采矿用地的转化较多,而由于裸地面积逐渐下降,因此在第5个时段对其转化所占比例较低。
图5
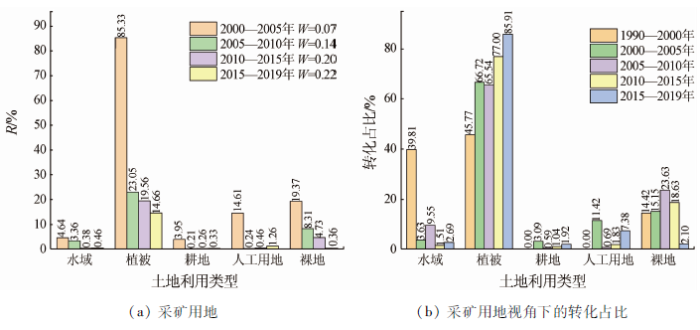
图5
土地利用变化强度-转化层次
Fig.5
Land use intensity change of study area at transition level
综上所述,煤炭开采活动对不同地类的影响不一样,采矿用地主要从植被和裸地转化而来,但植被减少的现象主要聚集在矿区小范围上,而研究区的植被覆盖整体趋势向好,呈现逐年增长。水域减少是由于气候因子、城镇开发活动和煤炭开采的叠加作用,在煤炭开采高速发展阶段矿区周边的水域受到较大影响,但在煤炭开采平稳阶段逐渐恢复。研究区的裸地发生大幅减少,特别是矿区周边更明显。煤炭开采对耕地、人工用地影响较小。针对采矿用地的转化层次分析,可以清晰地了解到煤炭产业发展过程中其用地的主要来源和周边的用地变化状况,反映煤炭开采活动对地表景观的详细影响过程。
4 结论
煤炭是我国的主要能源资源,其大规模的开采活动不可避免地改变地表景观,进而影响周边的生态环境。为探索煤炭开采活动背景下的地表土地利用变化特征,本文以我国的重要产煤区伊金霍洛旗为研究区,借助GEE平台,以长时间序列Landsat影像为数据源,采用随机森林分类方法提取1990—2019年间土地利用分布信息,结合土地利用强度分析理论对煤炭开采3个阶段的矿区土地利用变化特征进行分析。研究结果表明:
1)基于强度变化理论对土地利用变化从间隔层次、类别层次、转化层次进行分析,可较单一指数等方法更加系统地展示出研究区30 a间的土地利用变化特征及人类活动的影响。
2)煤炭开采对不同地类的影响具有差异,植被和裸地是其用地来源,水域是其影响地类,对耕地、人工用地影响较小。
3)煤炭开采在不同阶段对各类用地的影响作用具有差异。在煤炭开采起步阶段,对各种类型用地影响较小,地类的变化主要受气候因子、城镇开发活动等影响; 在煤炭开采高速发展阶段,煤炭开采主要影响矿区及周边植被、裸地和水域。在煤炭开采平稳发展阶段,对各地类的影响强度减小,加上相关环保措施的实施,使水域面积逐渐恢复。研究结果可服务于制定在不同阶段对不同地类的精准防护实施方案,为矿区生态环境的保护提供科学依据。
参考文献
Research progress in coal and gas co-mining modes in China
[J].DOI:10.1002/ese3.v8.9 URL [本文引用: 1]
Intelligent and ecological coal mining as well as clean utilization technology in China:Review and prospects
[J].DOI:10.1016/j.ijmst.2018.06.005 URL [本文引用: 1]
Dynamic changes in landscape pattern in a large-scale opencast coal mine area from 1986 to 2015:A complex network approach
[J].
Prioritizing abandoned coal mine reclamation projects within the contiguous United States using geographic information system extrapolation
[J].Coal mine reclamation projects are very expensive and require coordination of local and federal agencies to identify resources for the most economic way of reclaiming mined land. Location of resources for mine reclamation is a spatial problem. This article presents a methodology that allows the combination of spatial data on resources for the coal mine reclamation and uses GIS analysis to develop a priority list of potential mine reclamation sites within contiguous United States using the method of extrapolation. The extrapolation method in this study was based on the Bark Camp reclamation project. The mine reclamation project at Bark Camp, Pennsylvania, USA, provided an example of the beneficial use of fly ash and dredged material to reclaim 402,600 sq mi of a mine abandoned in the 1980s. Railroads provided transportation of dredged material and fly ash to the site. Therefore, four spatial elements contributed to the reclamation project at Bark Camp: dredged material, abandoned mines, fly ash sources, and railroads. Using spatial distribution of these data in the contiguous United States, it was possible to utilize GIS analysis to prioritize areas where reclamation projects similar to Bark Camp are feasible. GIS analysis identified unique occurrences of all four spatial elements used in the Bark Camp case for each 1 km of the United States territory within 20, 40, 60, 80, and 100 km radii from abandoned mines. The results showed the number of abandoned mines for each state and identified their locations. The federal or state governments can use these results in mine reclamation planning.
Monitoring coal mine changes and their impact on landscape patterns in an alpine region:A case study of the Muli coal mine in the Qinghai-Tibet Plateau
[J].DOI:10.1007/s10661-017-6284-9 URL [本文引用: 1]
霍林河南露天矿土地利用与景观格局变化研究
[D].
Study on land use and landscape pattern change in Huolinhenan open-pit coal mine
[D].
Effects of surface coal mining and land reclamation on soil properties:A review
[J].
A review of remote sensing for environmental monitoring in China
[J].DOI:10.3390/rs12071130 URL [本文引用: 1]
Temporal and spatial change of land use in a large-scale opencast coal mine area:A complex network approach
[J].
DOI:10.1016/j.landusepol.2019.05.020
[本文引用: 1]

Large-scale opencast coal mining results in the severe destruction of original ecosystems, as well as changes in land use. The complex network approach can be helpful for understanding the complex land use process. In this study, the complex network approach was used to analyze the land use change in the Pingshuo opencast coal mine area in the Shanxi province of China. Using six periods of land use data from 1986 to 2015, a complex network of land use change of five stages was constructed. The values of node degree, betweenness, and average shortest path in the network were calculated to identify the key land use type, the transformation process of different land use types and to discuss the stability of land use systems. Moreover, the main parts of complex networks were selected to evaluate the temporal and spatial changes of land use processes. From 1986 to 2015, with the dual influence of coal mining and high-speed urbanization, the amount of agricultural land decreased; in contrast, the amount of construction land, industrial and mining area land generally increased. Agricultural land was the main output land type, and construction land and industrial and mining area land were the main input land types. Cultivated land, forest land, and grassland were the key land use types during land processes from 1986 to 2009. Cultivated land, forest land, stripping areas and dumping areas became the key land types from 2009 to 2013, and from 2013 to 2015, cultivated land, forest land, and transportation land became the key land types. Large-scale opencast mining activities severely affect land use change. The overall stability of the land-use system was poor, and the system had the worst stability because of the intensification of mining activities from 2009 to 2013. Local government and coal enterprise should carry out some measures to improve the land use in large-scale opencast coal mine areas, including laying emphasis on land-saving use during mining processes, protecting agricultural land, controlling construction land, strengthening land reclamation, optimizing the use of reclamation land, and using "lease instead of expropriation" to carry out the reform of mined land.
Half a century of forest cover change along the Latvian-Russian border captured by object-based image analysis of Corona and Landsat TM/OLI data
[J].DOI:10.1016/j.rse.2020.112010 URL [本文引用: 1]
Inducing contextual classifications with kernel functions into support vector machines
[J].DOI:10.1109/LGRS.2018.2816460 URL [本文引用: 1]
Decision-tree,rule-based,and random forest classification of high-resolution multispectral imagery for wetland mapping and inventory
[J].
DOI:10.3390/rs10040580
PMID:30147945
[本文引用: 1]
Efforts are increasingly being made to classify the world's wetland resources, an important ecosystem and habitat that is diminishing in abundance. There are multiple remote sensing classification methods, including a suite of nonparametric classifiers such as decision-tree (DT), rule-based (RB), and random forest (RF). High-resolution satellite imagery can provide more specificity to the classified end product, and ancillary data layers such as the Normalized Difference Vegetation Index, and hydrogeomorphic layers such as distance-to-a-stream can be coupled to improve overall accuracy (OA) in wetland studies. In this paper, we contrast three nonparametric machine-learning algorithms (DT, RB, and RF) using a large field-based dataset (n = 228) from the Selenga River Delta of Lake Baikal, Russia. We also explore the use of ancillary data layers selected to improve OA, with a goal of providing end users with a recommended classifier to use and the most parsimonious suite of input parameters for classifying wetland-dominated landscapes. Though all classifiers appeared suitable, the RF classification outperformed both the DT and RB methods, achieving OA > 81%. Including a texture metric (homogeneity) substantially improved the classification OA. However, including vegetation/ soil/ water metrics (based on WorldView-2 band combinations), hydrogeomorphic data layers, and elevation data layers to increase the descriptive content of the input parameters surprisingly did not markedly improve the OA. We conclude that, in most cases, RF should be the classifier of choice. The potential exception to this recommendation is under the circumstance where the end user requires narrative rules to best manage his or her resource. Though not useful in this study, continuously increasing satellite imagery resolution and band availability suggests the inclusion of ancillary contextual data layers such as soil metrics or elevation data, the granularity of which may define its utility in subsequent wetland classifications.
Comparison of differences in resolution and sources of controlling factors for gully erosion susceptibility mapping
[J].DOI:10.1016/j.geoderma.2018.05.027 URL [本文引用: 1]
A new technique for remote sensing image classification based on combinatorial algorithm of SVM and KNN
[J].DOI:10.1142/S0218001418590127 URL [本文引用: 1]
Convolutional SVM networks for object detection in UAV imagery
[J].DOI:10.1109/TGRS.2018.2790926 URL [本文引用: 1]
基于TM和OLI数据山西省潞城市土地利用动态变化分析与预测
[J].DOI:10.6046/gtzyyg.2018.02.17 [本文引用: 1]
Research on land use dynamic change and prediction in Lucheng City of Shanxi Province based on TM and OLI
[J].DOI:10.6046/gtzyyg.2018.02.17 [本文引用: 1]
Intensity analysis to unify measurements of size and stationarity of land changes by interval,category,and transition
[J].
昆明市土地利用变化的强度分析与稳定性研究
[J].
DOI:10.18306/dlkxjz.2016.02.011
[本文引用: 1]
在遥感、地理信息系统和统计定量分析结合的基础上,引进土地利用变化强度分析理论方法。作为一种解释性的数学框架,通过不同时间间隔的土地利用转移矩阵计算了每个时间间隔和每种地类的变化面积和变化强度。强度分析自上而下分为3个层次:间隔层次、地类层次和转变层次,将观察变化强度与平均变化强度比较,揭示不同层次的变化特征,并依次用快速的与缓慢的、活跃的与平稳的、来源与转变三对术语来描述。本文以昆明市的土地利用变化为例,深入阐述了不同层次的面积变化和强度变化,并对不同层次的稳定性进行了深入分析。结果表明:在间隔层次,2000年后昆明市的土地利用变化强度逐渐加大;在地类层次,建设用地的变化强度是最活跃的,林地的变化强度是最平稳的;在转变层次,增加的建设用地主要来源于耕地,减少的林地主要转变为草地。强度分析在土地利用变化过程分析中具有系统性的优势,对深入挖掘土地利用变化信息、理解土地利用变化过程具有重要作用。
Intensity analysis and stationarity of land use change in Kunming City
[J].
Intensity and stationarity analysis of land use change based on CART algorithm
[J].
GEE云平台支持下的西天山森林遥感监测与时空变化分析
[J].
Forest survey and spatio-temporal analysis in West Tianshan mountains supported by Google Earth Engine
[J].
Annual maps of global artificial impervious area (GAIA) between 1985 and 2018
[J].DOI:10.1016/j.rse.2019.111510 URL [本文引用: 1]
Assessing the pasturelands and livestock dynamics in Brazil,from 1985 to 2017:A novel approach based on high spatial resolution imagery and Google Earth Engine cloud computing
[J].
Land cover classification using Google Earth Engine and random forest classifier:The role of image composition
[J].DOI:10.3390/rs12152411 URL [本文引用: 1]
Object-oriented LULC classification in Google Earth Engine combining SNIC,GLCM,and machine learning algorithms
[J].DOI:10.3390/rs12223776 URL [本文引用: 1]
Monitoring land cover change on a rapidly urbanizing island using Google Earth Engine
[J].
Land use/land cover change and land surface temperature of Ibadan and environs,Nigeria
[J].DOI:10.1007/s10661-019-8054-3 URL [本文引用: 1]
基于GEE的土地利用变化对生态系统服务价值的影响研究——以京津冀地区为例
[J].
Impacts study of GEE-based land use changes on ecosystem service value(ESV):Take the Beijing-Tianjin-Hebei Region as an example
[J].
Modeling major rural land-use changes using the GIS-based cellular automata metronamica model:The case of andalusia (Southern Spain)
[J].DOI:10.3390/ijgi9070458 URL [本文引用: 1]
