

0 引言
珊瑚礁生态系统作为古老的海洋生态系统,总面积仅占全球海域面积约0.5%,生物种类却占到了海洋物种总数的约30%[1],生产力水平与生物多样性极高。珊瑚对环境变化极为敏感,当环境发生剧烈变化时,恶劣的生存条件会使得珊瑚体内虫黄藻被排出或(和)失去体内色素,最终会裸露出底层的白色碳酸钙珊瑚骨架,这一过程被称为珊瑚礁白化[2]。据研究,最适宜珊瑚生长的温度为25~29 ℃[3],且大部分热带珊瑚生活在它们能忍受的海温上限边缘约1~2 ℃[2],这使得珊瑚很难适应短时间内剧烈的海温变化。伴随着全球气候变暖,海水温度的异常升高已经成为珊瑚礁白化的主要原因之一。1980—1997 年,全球共报道约 370 次珊瑚白化事件; 而在1998—2010 年期间,全球白化报道达到了3 700多次[4],珊瑚白化发生的频率和严重程度不断增加。2015—2017年连续3 a记录到了19世纪以来的全球最高年平均海温[5],与之相对应的是有史以来最严重、持续时间最长的全球性珊瑚白化事件[6]。
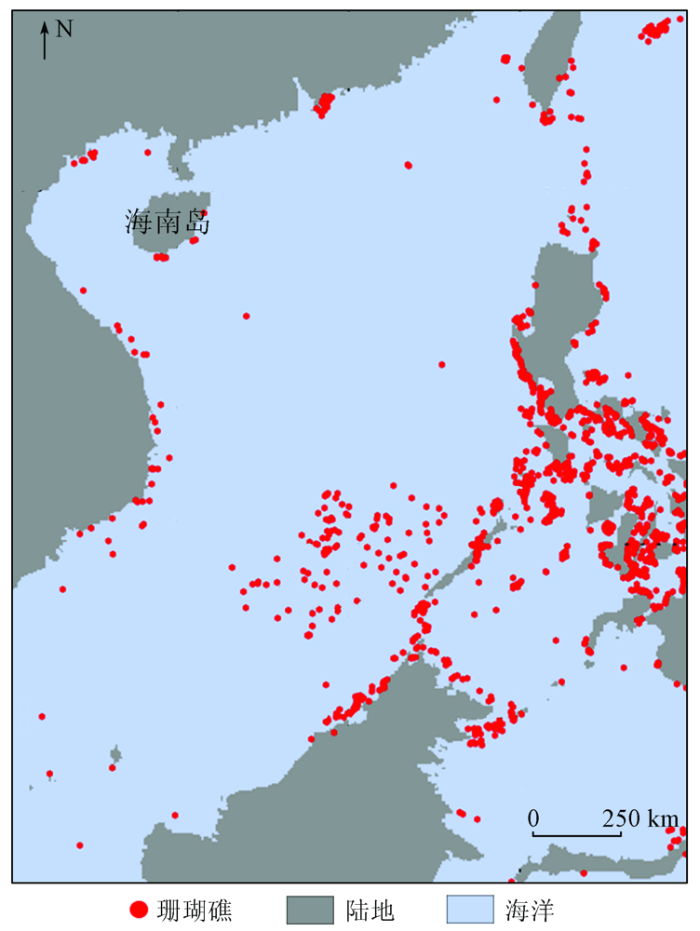
中国南海分布着众多珊瑚礁,主要包括西沙群岛、中沙群岛、南沙群岛、东沙群岛、台湾岛、海南岛以及大陆沿岸共128 个礁区,总面积约为30 000 k
早在1990年,Glynn等[9]就通过在造礁珊瑚上进行耐高温实验,证实当环境温度升高1~2 ℃时,就会发生珊瑚白化现象,活珊瑚表面积显著减少。并且因热异常导致的珊瑚礁白化存在一定的滞后性,在急性热应力消退后,白化程度会随着热应力的累积继续加重[10]。随着卫星遥感技术的发展和对珊瑚礁热白化的进一步研究,美国国家海洋和大气管理局(National Oceanic and Atmospheric Administration,NOAA)从2000年起开始实施珊瑚礁监测计划(Coral Reef Watch,CRW),并证实了基于遥感海表面温度(sea surface temperature,SST)数据集开发的热应力检测产品: 热点(Hotspot)与周热度(degree heating week, DHW),能对大规模珊瑚礁白化的发生与发展进行有效监测[11,12]。
作为业务化的全球珊瑚礁白化监测产品,Hotspot与DHW已经得到了全世界珊瑚礁研究与管理人员的广泛使用,但其白化监测的准确度却一直存在争议。通过对全球1985—2005年的珊瑚礁白化事件进行评估,Donner[13]发现在全球使用DHW平均能检测到的珊瑚白化事件仅占40%,这种低预测性能可能是因为使用了全球固定的高于长期最热月海温1 ℃的热阈值; 而根据Kleypas等[14]的报告,赤道西太平洋的珊瑚礁对小幅度的温度升高更敏感,在月海温异常低至0.4 ℃而不是1 ℃时,珊瑚就有可能会发生白化; Kumagai等[15] 基于668例发生在日本西南部琉球群岛海域的白化事件,对包括DHW在内的指数进行了改进,得到了更适合该区域的临界阈值0.68 ℃与白化警报阈值2.07 ℃-周; 李淑等[16]在2007年6月航次的南沙群岛调查中,发现在热异常指数Hotspot低于1 ℃时,调查区域就已经发生了珊瑚礁白化,因此认为NOAA的白化热应力监测指数在南海的实际应用结果可能会存在低估的现象。
针对南海的白化热应力可能被低估,进而产生白化事件漏检的问题,为了提高南海珊瑚礁白化遥感监测的准确度,本文对珊瑚礁白化遥感热应力检测指数进行了评估与改进。并在2007年6月的南沙群岛珊瑚礁白化事件中,使用改进前后的阈值结果分别进行了DHW与白化警报区域的计算。
1 研究区域概况与数据源
南海位于太平洋西部、亚洲大陆南部,北至华南大陆沿岸,东至菲律宾群岛,西部与南部分别至越南与马来半岛,是中国的三大边缘海之一。本文的研究区域为南海及其周边海域,处在珊瑚三角区(coral triangle)的西北部,是全球珊瑚礁生态系统的重要组成部分。地理位置(E105°~125°,N0°~25°)与主要的珊瑚礁分布情况如图1。本文使用的SST数据集来自NOAA的国家环境卫星信息资料中心(National Environmental Satellite, Data, and Information Service,NESDIS),下载地址: ftp: //ftp.star.nesdis.noaa.gov/pub/sod/mecb/crw/data/coraltemp/v3.1/nc/。为了满足NOAA CRW在检测珊瑚礁白化热应力时对长期稳定的SST数据的需求,NESDIS开发了这套分辨率为5 km的,静止卫星与极轨卫星融合的全球夜间再分析遥感SST数据集[17]。数据集的时间跨度为1985年1月1日至今,本文采用的是3.1版本。
图1
Reefbase[18]是全球珊瑚礁监测网络(Global Coral Reef Monitoring Network,GCRMN)以及国际珊瑚礁行动网络(International Coral Reef Action Network,ICRAN)的官方数据库,记载了大量的珊瑚礁现场调查数据,但其中的观测有主要集中在热点研究海域的特点。Donner等[19]认为ReefBase的白化事件数据库遗漏了部分数据,特别是缺乏太平洋地区的数据,因此他们在ReefBase的基础上,通过有针对性地与国际珊瑚礁监测领域的研究人员进行交流,以及对报道和文献资料的检索补充,开发了一个全新的、高分辨率的全球大型珊瑚礁白化数据库“Coral Bleaching Database V1”,时间范围为1985—2010年,可在
2 评价指标
2.1 气候学与热应力指标
评价一个地区的热异常,首先需要确定当地的气候学基准。检测珊瑚礁白化热应力的气候学基准需要代表当地长期最热月的平均海温,所以通常使用最大月平均(maximum monthly mean, MMM)海温。计算方法是先求出当地12个月的长期月平均海温,然后从中取最大值。
式中: T为气候学基准; t为时间中心; slope为每个单元格内的月平均SST长期变化率; 85-19指1985—2019年,85-93指1985—1990加1993年,代表再中心化前后的两个时间段。
热点(Hotspot)与周热度(DHW)是NOAA CRW开发的珊瑚礁白化遥感热应力监测产品,其中热点Hotspot是基于MMM气候学基准计算的正异常值,用来表征每日海温热异常的大小,单位为℃,计算公式为[27]:
珊瑚礁的热白化是一个长期的过程,除了短期的热应激,研究证明长期的热量累积也是重要的白化指标,并且能更有效地监测大规模珊瑚白化[9]。周热度DHW是最近12周(84 d)热应力强度(Hotspot)的累积量,单位为℃-周。连续一周的2 ℃ Hotspot与连续两周的1 ℃ Hotspot所对应的DHW值是相同的,都是2 ℃-周[27]。在计算DHW时,为了避免长期低热量累积导致指数虚高,并不会将所有的Hotspot进行累加。设置一个临界阈值(critical threshold,CT)来对热量累积进行限制,即把每个单元格的MMM+CT设置为当地热应力积累的高通滤波值。通常CT为1 ℃,在本文研究中会对CT进行改进。DHW计算公式[27]为: 。
根据热应力指数的大小可以判断一个区域是否应该发出珊瑚礁白化警报。NOAA CRW将4 ℃-周DHW作为判断白化发生可能性的重要阈值,当珊瑚礁附近的数值达到DHW≥4 ℃-周时,NOAA会向当地有关部门发出白化警报[29]。本文将这个判断是否达到白化警报级别的DHW值称为警报阈值(alert threshold,AT),AT也将是本文的改进对象。
表1 白化热应力级别划分
Tab.1
| 级别 | 定义 | 对珊瑚礁的影响 |
|---|---|---|
| 无压力 | Hotspot≤0 | — |
| 观察 | 0<Hotspot<CT | — |
| 白化警告 | Hotspot≥CT,DHW<AT | 可能发生白化 |
| 白化警报 | Hotspot≥CT,DHW≥AT | 极易发生白化 |
2.2 白化阈值的评价指标
为了得到适合南海珊瑚礁的CT与AT,本文将不同阈值组合应用到收集的白化调查事件中,将得到的漏检率(false negative rate,FNR)、误检率(false positive rate,FPR)与准确率(accuracy,ACC)作为检验白化阈值的标准。
对于珊瑚礁白化来说,报道中的白化事件可能被热应力指数成功检测(true positive,TP),也可能未被成功检测(false negative,FN)。未被成功检测的事件在所有白化事件中的占比即为漏检率FNR,公式为:
如果情况相反,报道中是未发生白化事件,其热应力指数或者未达到白化警报级别(true negative,TN),或者达到了白化警报级别发生虚警(false positive,FP)。发生虚警的事件在所有未白化事件中的占比即为误检率FPR,公式为:
最佳的白化阈值,需要兼顾FNR与FPR的大小。因为如果FNR太高,会导致白化事件的漏报; 而FPR太高,则会发生白化虚警。所以选择准确率ACC,它表示所有检测结果中正确的事件占全部事件的比率,其公式为:
以上3个评价指标: FNR,FPR和ACC,将是本文对白化热应力检测阈值改进的主要依据。改进后将得到研究区域的最佳阈值组合,进而获得更准确的珊瑚白化检测结果。
3 结果与讨论
3.1 白化阈值的分析
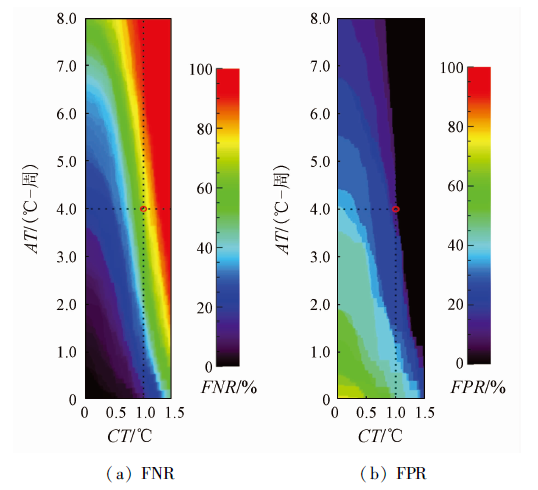
对白化阈值组合进行研究评价,将CT设为0~1.5 ℃,AT设为0~8 ℃-周,取值间隔为0.01个单位,得到151×801的阈值矩阵,其中的每个点对应一种阈值组合。由于白化事件报道的时间精度不一,在每种阈值组合下取对应的157例白化事件发生当年的DHW最大值。未白化事件均为现场调查记录,所以在每种阈值组合下取23例未白化事件调查当月的DHW最大值。依据式(4)和式(5),求得不同阈值组合对应的漏检率与误检率如图2所示。
图2
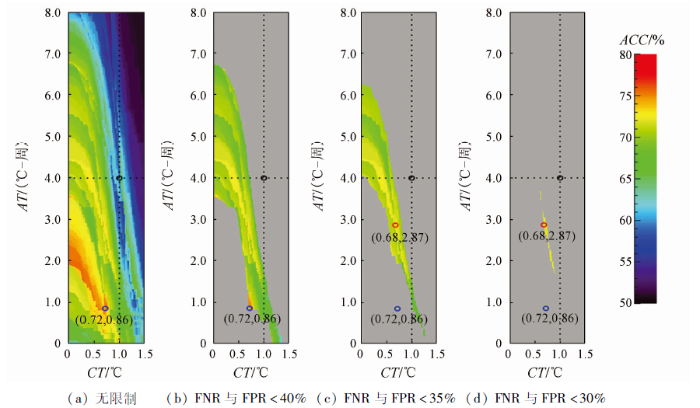
综合考虑检测白化事件与未白化事件的正确率,根据式(6),不加任何限制条件,求得不同阈值组合对应的ACC如图3(a),黑圈(1.0 ℃,4.0 ℃-周)处的ACC为58.13%,而蓝圈(0.72 ℃,0.86 ℃-周)处可取得图3(a)中准确率的最大值75.66%。使用FNR与FPR对阈值的取值范围加以限制,从图3(b)和(c)的变化中可以看出,蓝圈处所对应的FNR与FPR小于40%但大于35%。而根据图3(c)与(d),FNR与FPR小于35%后,ACC最大值73.90%出现在红圈(0.68 ℃,2.87 ℃-周)处,且此处FNR与FPR都小于30%,优于(0.72 ℃,0.86 ℃-周)处的结果。结合图2可以看出,(0.72 ℃,0.86 ℃-周)处的高ACC是FNR与FPR的相对差异大导致的虚高。综合考虑FNR、FPR与ACC,最佳白化阈值组合为临界阈值=0.68 ℃、警报阈值=2.87 ℃-周。
图3
3.2 改进阈值在白化事件检测中的应用
2007年,李淑等[16]在南沙群岛进行了实地生态调查,发现在6 月19日时有部分珊瑚已经或正在发生白化,可能处在热白化事件的初始阶段,然而采样期间的DHW均小于3 ℃-周,并不能达到NOAA CRW认为的足以发生显著性白化事件的警报阈值(至少4 ℃-周),所以认为在南沙群岛的珊瑚白化热应力监测可能存在低估现象。 应用NOAA CRW的临界阈值(1 ℃)与改进后的临界阈值(0.68 ℃),分别在研究区域计算2007年6月19日、22日与25日的DHW值(图4)。两种计算阈值下得到的DHW在6月19—25日这一周都有逐渐增加的趋势,表明调查时正处于升温状态,很可能是热应力导致珊瑚礁白化的初期阶段。通过图4(a)—(c)与(d)—(f)的对比可以看到,临界阈值的改进能在反映区域升温特征的同时,显著提高DHW值。
图4
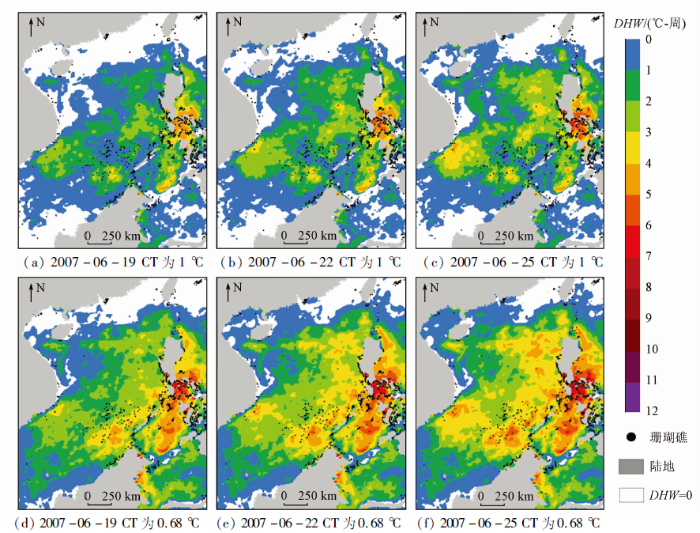
图5

4 结论
本文基于遥感海温数据集与白化指数Hotspot与DHW,依据180例南海及周边海域珊瑚礁白化报道事件,使用漏检率FNR、误检率FPR与准确率ACC等评价指标,对珊瑚礁白化热应力检测中的两个关键阈值进行了评估与确定,从而实现了对白化热应力检测的改进。
1)经改进后的白化指数在热应力检测能力上有大幅提升,白化监测的准确率由58.13%提升至73.90%,且漏检率和误检率都在30%以下,更能准确反映南海海域珊瑚礁白化的实际情况;
2)结合2007年6月在南沙群岛调查得到的珊瑚礁白化事件,对比了阈值改进前后白化指数的应用效果,改进后的检测结果有显著改善;
3)本文提到的热应力检测阈值的评估与改进方法有很高的通用性,可根据情况继续缩小研究范围,提高地区白化热应力检测准确度。此外,海温异常并不是珊瑚发生白化的唯一因素,太阳辐射、海水污染等也是导致珊瑚白化的重要原因,建立热应力指数主导的多参数模型会使珊瑚礁遥感白化监测预警系统更加准确,从而更好地对珊瑚礁进行白化监测与管理保护。
参考文献
The global biodiversity of coral reefs:A comparison with rain forests
[M]
珊瑚礁白化研究进展
[J].
Recent development in coral reef bleaching research
[J].
Scleractinia
[M]
Reefs at risk revisited
[M].
State of the climate in 2017
[J].DOI:10.1175/2018BAMSStateoftheClimate.1 URL [本文引用: 1]
The 2014—2017 global-scale coral bleaching event:Insights and impacts
[J].
DOI:10.1007/s00338-019-01844-2
[本文引用: 1]

2014-2017 was an unprecedented period of successive record-breaking hot years, which coincided with the most severe, widespread, and longest-lasting global-scale coral bleaching event ever recorded. The 2014-2017 global-scale coral bleaching event (GCBE) resulted in very high coral mortality on many reefs, rapid deterioration of reef structures, and far-reaching environmental impacts. Through the papers in this special issue of Coral Reefs entitled The 2014-2017 Global Coral Bleaching Event: Drivers, Impacts, and Lessons Learned, as well as papers published elsewhere, we have a good analysis of the 2014-2017 GCBE and its impacts. These studies have provided key insights into how climate change-driven marine heatwaves are destroying coral reef ecosystems: (a) The 2014-2017 GCBE is unique in the satellite record in its spatial scale, duration, intensity, and repetition of bleaching. (b) The impacts have been the most severe ever seen at many reefs. (c) Timing of observations matters and needs to be considered during the analysis of impacts. (d) On both global and local scales, the intensity of heat stress and impacts varied. (e) We continue to see important differences among and within coral taxa, with key roles played by algal symbionts and the microbiome. (f) Heat stress and bleaching both play a role in subsequent disease, which plays a key role in mortality. (g) Impacts ripple far beyond corals, with significant changes to the fish and invertebrate community that may last decades. (h) The structure of both individual coral's skeletons and entire reefs has been eroded much more quickly than previously realized. (i) The 2014-2017 GCBE provided little support for the proposed "lifeboat" hypothesis, whereby deep or mesophotic reefs serve as a means of coral reef salvation. (j) While marine protected areas (MPAs) provide protection from local stressors, they not only do not protect reefs from global-scale stressors, but also here is also little evidence they provide significant resilience.
中国珊瑚礁分布和资源特点
[C]
Distribution and resource characteristics of coral reefs in China
[C]
南海珊瑚礁及其对全新世环境变化的记录与响应
[J].
Coral reefs in the South China Sea:Their response to and records on past environmental changes
[J].
Experimental evidence for high temperature stress as the cause of El Niño-coincident coral mortality
[J].DOI:10.1007/BF00265009 URL [本文引用: 2]
Seasonal and local spatial patterns in the upper thermal limits of corals on the inshore Central Great Barrier Reef
[J].DOI:10.1007/s003380050186 URL [本文引用: 1]
Detecting and monitoring 2001 coral reef bleaching events in Ryukyu Islands,Japan using satellite bleaching HotSpot remote sensing technique
[C]
Coral bleaching indices and thresholds for the Florida Reef Tract,Bahamas,and St.Croix,US Virgin Islands
[J].It is well established that elevated sea temperatures cause widespread coral bleaching, yet confusion lingers as to what facet of extreme temperatures is most important. Utilizing long-term in situ datasets, we calculated nine thermal stress indices and tested their effectiveness at segregating bleaching years a posteriori for multiple reefs on the Florida Reef Tract. The indices examined represent three aspects of thermal stress: (1) short-term, acute temperature stress; (2) cumulative temperature stress; and (3) temperature variability. Maximum monthly sea surface temperature (SST) and the number of days >30.5 degrees C were the most significant; indicating that cumulative exposure to temperature extremes characterized bleaching years. Bleaching thresholds were warmer for Florida than the Bahamas and St. Croix, US Virgin Islands reflecting differences in seasonal maximum SST. Hind-casts showed that monthly mean SST above a local threshold explained all bleaching years in Florida, the Bahamas, and US Virgin Islands.
An evaluation of the effect of recent temperature variability on the prediction of coral bleaching events
[J].DOI:10.1890/10-0107.1 URL [本文引用: 2]
Potential role of the ocean thermostat in determining regional differences in coral reef bleaching events
[J].
High-resolution modeling of thermal thresholds and environmental influences on coral bleaching for local and regional reef management
[J].DOI:10.7717/peerj.4382 URL [本文引用: 1]
珊瑚共生虫黄藻密度结合卫星遥感分析2007年南沙群岛珊瑚热白化
[J].
Assessment of coral bleaching using symbiotic zooxanthellae density and satellite remote sensing data in the Nansha Islands,South China Sea
[J].
A new high-resolution sea surface temperature blended analysis
[J].DOI:10.1175/BAMS-D-15-00002.1 URL [本文引用: 3]
A new,high-resolution global mass coral bleaching database
[J].DOI:10.1371/journal.pone.0175490 URL [本文引用: 1]
Status of coral reefs of the world:1998
[M].
Status of coral reefs of the world:2002
[M].
Status of coral reefs of the world:2008
[M].
The 2014 thermal stress event on offshore archipelagoes in the South China Sea
[C]
近45年涠洲岛5次珊瑚热白化的海洋站SST指标变化趋势分析
[J].
An analysis on the trend of sea surface temperature indices for coral hot bleaching in Weizhou Island ocean observation station during 1966—2009
[J].
Coral bleaching caused by an abnormal water temperature rise at Luhuitou fringing reef,Sanya Bay,China
[J].DOI:10.1080/14634988.2012.687651 URL [本文引用: 1]
西沙群岛2010年珊瑚热白化卫星遥感监测
[C]
Satellite remote sensing monitoring coral bleaching during the 2010 bleaching event at Parcel Islands,South China Sea
[C]
Reef-scale thermal stress monitoring of coral ecosystems:New 5-km global products from NOAA Coral Reef Watch
[J].
Climatology development for NOAA Coral Reef Watch’s 5-km product suite
[R]
NOAA Coral Reef Watch 50 km satellite sea surface temperature-based decision support system for coral bleaching management
[R]
