

0 引言
全球和局部碳循环研究一直是近年生态环境领域的研究热点[1]。土壤是最大的陆地碳储层,其储存的碳量是大气的两倍以上[2]。土壤有机质(soil organic matter, SOM)包括各种动植物残体、微生物以及分解和合成的各种有机物质,是土壤中碳的主要表现形式,被称作植物的“养分银行”[3,4,5]。因此,测量SOM是判断土壤肥力的重要途径之一[6]。常规实验测定方法费事且成本较高,无法满足大范围应用、快速有效监测的需求,而多波段、信息丰富的遥感技术为解决这一问题提供了一种新途径[7]。但卫星遥感数据也存在空间分辨率较低、对地观测受天气和大气条件影响较多等问题[8]。以往的研究主要集中在提高农业生产、环境污染监测、土地利用变化等方面的SOM预测 [9,10,11],而对开采中的煤矿区的研究却很少见。煤矿开采过程中,土壤理化性质会发生很大程度的改变[12],因此及时有效地监测矿区土壤质量状况、快速全面地得到区域性量化指标、准确估算矿区SOM对于其生态环境监测和修复具有十分重要的意义[13]。
近地高光谱遥感相较于卫星遥感来说,能准确地得到实时地表状态、快速获取土壤连续光谱数据,可获得成百甚至上千个窄波段光谱信息,进而得到完整连续的地物光谱曲线[14]。近几年学者通过高光谱技术对SOM与反射光谱之间的关系、土壤反射光谱特性、光谱数据变换方法、有机质敏感波段和定量反演建模方法等进行了深入研究,取得了很多重要成果[15,16,17,18,19]。同时也发现,土壤有机质的含量变化引起的光谱差异,会受到土壤水分和土壤质地等因素影响 [20,21]。在利用高光谱进行SOM反演过程中要综合考虑土壤水分和质地等影响因素,同时由于近地高光谱监测范围有限,只有利用其获取的精确土壤光谱数据与卫星遥感数据相结合,才能更好的对区域SOM进行准确的估算[22,23]。
因此,本文以位于陕西省榆林市和内蒙古鄂尔多斯市交界处的中煤集团榆林矿区为研究区,通过全区域样点土壤取样,测得土壤有机质含量; 利用成像高光谱仪获得样品光谱数据,采用光谱分析、相关性分析和逐步回归分析等方法,构建基于高光谱和Landsat8 OLI卫星多光谱数据的SOM反演模型。使用所建立的反演模型,对研究区内的大海则、营盘壕、纳林河二号、巴拉素等重点煤矿进行SOM反演,并对矿区开采前后SOM的空间变化状况进行探讨。这些结果将对矿区土壤资源和生态环境定量研究、管理以及可持续发展提供依据。
1 研究区概况与数据源
1.1 研究区概况
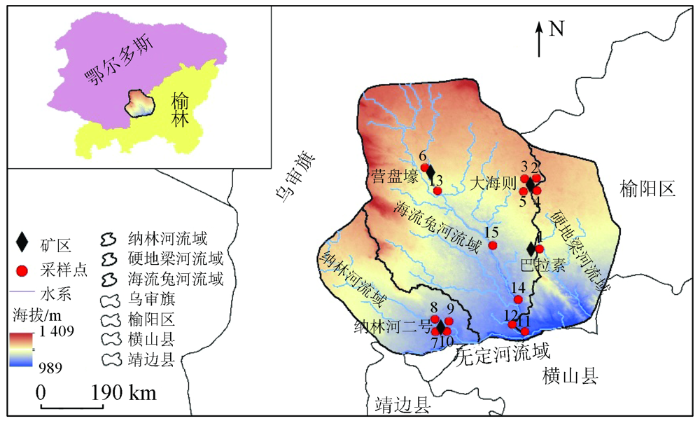
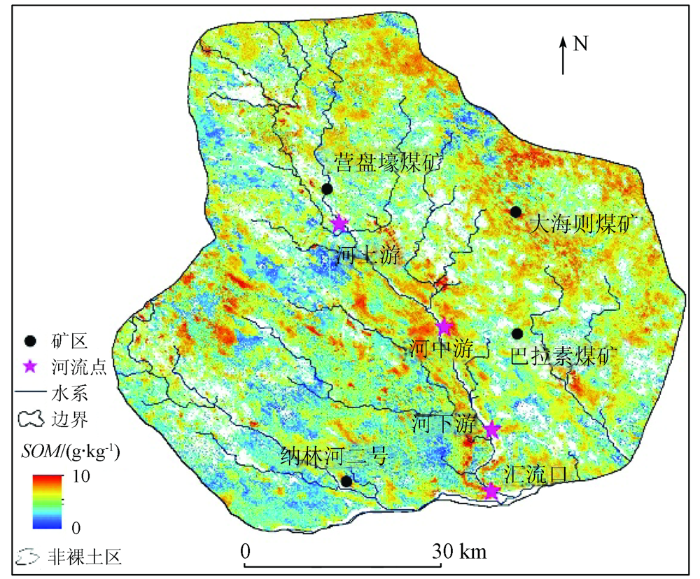
研究区位于陕西省榆林市与内蒙古鄂尔多斯市境内,地理位置在E108°38'~109°26'、N37°59'~38°42'之间,北连鄂尔多斯市市区,南接榆林市横山县,总面积约为3 800 km2; 地势自西北向东南降低,海拔范围在989~1 409 m,横跨乌审旗、榆阳区和横山县; 年降水量200~400 mm,属干旱半干旱地区。研究区内遍布煤矿,以井工煤矿为主,包括: 中煤集团的大海则煤矿、纳林河二号煤矿,兖矿集团营盘壕煤矿,延长石油巴拉素矿等15个采样点; 流域水系主要为纳林河、海流兔河和硬地梁河并全部汇入无定河流域(图1)。
图1
1.2 遥感数据获取
光谱数据包括卫星遥感影像和近地土壤高光谱数据。2019年分别在15个采样点位置,在不同月份,对近地土壤高光谱和土壤样本数据进行3次采样,采集时间分别为: 6月1日、7月4日和9月21日。卫星遥感影像取自美国地质调查局(
近地高光谱数据在10:00—14:00之间,日照充足、无云的条件下完成采样[24]。土样光谱反射率测定通过便携式高光谱成像系统完成,该系统主要由成像高光谱相机Resonon 的Pika L、水平旋转云台(Isuzu Optics Corp,China)、笔记本电脑、数据采集软件(SpectrononPro)、三脚架和电源装置等组成。波长观测范围约为400~1 000 nm。为保证SOM含量与实际情况高度一致,高光谱波段曲线提取直接在野外布点的0.5 m×0. 5 m样方内完成,光谱测量几何条件为: 光源方位角70°,光源照射方向与垂直夹角15°,传感器垂直放置在土壤表层中心上方50 cm处,光源到土壤表层距离100 cm。每次测量前进行一次标准白板标定,每个样点重复测量5次,取5条高光谱曲线反射率的算术平均值作为该土样的实际光谱反射率。在实际测定过程中发现高光谱成像仪获取的波谱范围为380~1 020 nm; 因此,为了降低噪声和水汽吸收产生的影响,需要去除信噪比较低的边缘波段380~399 nm和1 001~1 020 nm[25]。
土壤有机质样本采集方式为十字法,在光谱采集结束后,取同一位置深度为0~10 cm的土壤样本5个,并利用全球定位系统记录采样点位置。土样带回实验室后均匀混合,3次合计得到样本45个,经自然风干、研磨过100目孔筛后,采用重铬酸钾氧化外加热法测定SOM[26],计算公式为:
式中:
1.3 高光谱数据数学变换和拟合评价
1.3.1 数学变换
为了建立SOM含量与高光谱反射率的敏感关系,采用光谱曲线数学变换方程、相关分析等方法对土壤光谱反射率(
式中:
1.3.2 拟合评价
拟合评价包括决定系数(
式中:
此外,本文还通过比较实测值和预测值的偏离程度,得到特征提取波段组中的最优组合,进行区域性SOM反演。
2 结果与分析
2.1 高光谱土壤特征波段提取
SOM是土壤重要的赋色成分,土壤光谱反射率对其含量的高低会产生一定响应。但在获取土壤样本和测量样本理化性质时,检测各条光谱反射率是否存在异常值是必不可少的。本文通过人工逐条检验法,对45个反射率光谱曲线进行异常样本排除。同时利用Savitzky-Golay滤波对全部土壤样本在高光谱400~1 000 nm谱段的光谱反射率数据进行平滑去噪处理[27]。
图2
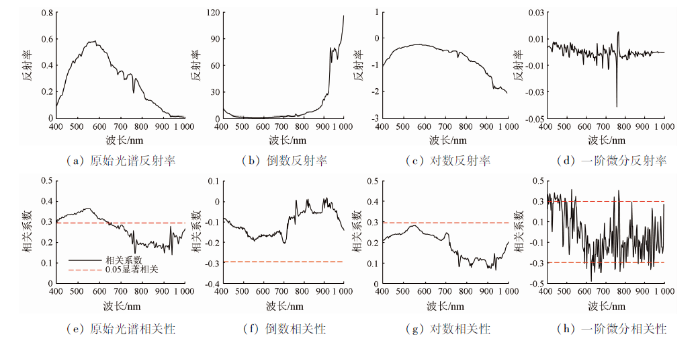
将45个土壤光谱反射率及反射率变换处理(倒数、对数和一阶微分)结果分别与SOM含量进行相关性分析(图2(b)—(h)),并基于0.05水平上做相关系数(r)的显著相关检验。结果表明,SOM与原始高光谱反射率在400~642 nm波段范围内相关性较好; 而反射率的倒数(1/R)和反射率的对数(lgR)与SOM含量相关性绝对值呈弱相关(相关系数最优分别为-0.21和0.28),并未达到显著水平; 但在反射率一阶微分(R')中: 波长范围400~404 nm,410~414 nm,420 nm,432~451 nm,457~459 nm,465~469 nm,490~492 nm,541~544 nm,592 nm,602 nm,623~628 nm,634~636 nm,640~644 nm,666~668 nm,674~679 nm,767~769 nm,773~778 nm,806 nm,868 nm和885 nm处均处于0.05显著相关,相关顺序为R'>R>lgR>1/R,并且一阶微分与SOM含量之间正相关性最高(相关系数为0.453),负相关性最高(相关系数为-0.477)。
结合土壤反射率及其与3种类型数学变换结果的相关系数,不难发现使用一阶微分变换的反射率反演区域SOM效果最佳。为保证冗余度低,凸显有效信息,采用了400 nm,412 nm,420 nm,436 nm,457 nm,467 nm,490 nm,546 nm,592 nm,602 nm,625 nm,636 nm,644 nm,666 nm,676 nm,767 nm,773 nm,806 nm,868 nm和885nm单波段处的变换反射率,其中包括9个正相关波段、11个负相关波段。
2.2 SOM空间分布格局分析
将2019年6月1日、7月4日、9月16日获取的3景Landsat8 OLI多光谱影像的7个可见光波段进行预处理(辐射定标、大气校正、几何纠正、研究区提取等)后,再与每一个高光谱特征波段做相关分析。结果表明,相关性大于0.7的波段分别为546 nm(绿波段)、666 nm(红波段)和868 nm(近红外波段),R2分别为0.70,0.79和0.82。将3次取样的45个样本按照2∶1的比例,随机抽取30个样本用于模型建立(表1)。变异系数(CV)反映特性参数的空间变异程度,揭示区域化变量的离散程度; 变异系数越大,说明数据的差异和离散程度越大。一般认为,CV<0.1为弱变异性,0.1≤CV≤1为中等变异性,CV>1为高等变异性[29]。从变异系数来看,SOM指标空间变异不大,为中等变异。将绿波段、红波段、近红外波段及其波段组合与SOM做线性回归分析,其余15个样本用于精度验证(表2),得到SOM与Landsat8 OLI多波段数据的最优线性回归方程为:
表1 土壤有机质含量基本统计特征
Tab.1
| 样本 类型 | 样本 数/个 | 最小值 (Min)/ (g·kg-1) | 最大值 (Max)/ (g·kg-1) | 均值 (Mean)/ (g·kg-1) | 标准差 (Sd)/ (g·kg-1) | 变异 系数 (CV)/% |
|---|---|---|---|---|---|---|
| 建模样本 | 30 | 0.14 | 4.66 | 1.96 | 1.29 | 0.66 |
| 验证样本 | 15 | 0.72 | 3.99 | 2.12 | 1.05 | 0.50 |
| 总体样本 | 45 | 0.14 | 4.66 | 2.01 | 1.21 | 0.60 |
表2 线性回归比较
Tab.2
| 波段组合 | 回归方程 | R2 | RMSE |
|---|---|---|---|
| 绿 | Y=2.27 X绿+3.14 | 0.32 | 5.31 |
| 红 | Y=1.42 X红+4.72 | 0.46 | 4.39 |
| 近红 | Y=1.38 X近红-4.83 | 0.70 | 4.24 |
| 绿+红+ 近红 | Y=0.08 X绿+0.19 X红+0.18 X近红-1.9 | 0.82 | 2.03 |
根据线性回归得出的结论,对6月1日、7月4日和9月21日获取的3景Landsat8图像反演研究区的SOM。为消除植被对SOM反演的影响,对研究区内NDVI>0.15的区域进行剔除,得到不同月份矿区的SOM(图3)。
图3
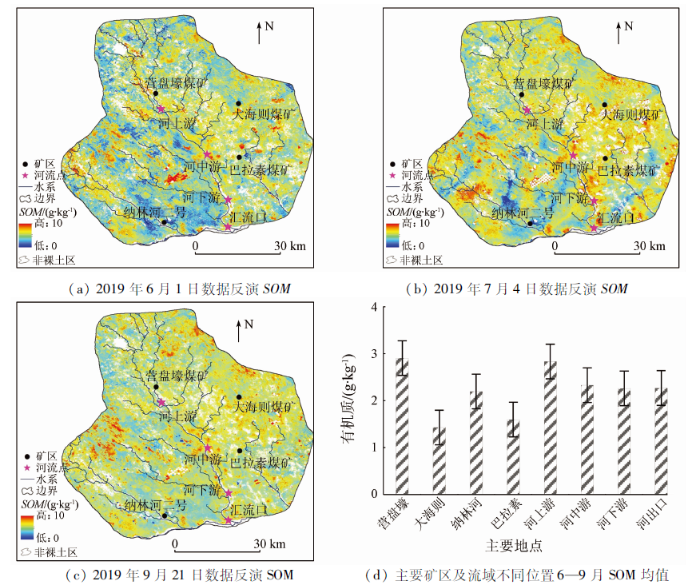
从图3(a)—(c)可以看出,研究区内土壤有机质含量分布不均匀,空间差异较大,水系流域周边的SOM明显高于无水系区域; 东部、南部地区普遍高,SOM平均含量达3.98 g/kg; 西部、西北部地区普遍较低,SOM平均含量仅1.57 g/kg。整个研究区SOM含量处于较低水平,7月SOM总体均值低于6月和9月,这是因为研究区位于毛乌素沙地腹地,土壤表层为栗钙土,加之常年处于煤矿开采作业的影响下,导致地表植被较少,SOM较低。
对2019年6—9月份研究区内的几个主要煤矿周边及纳林河上、中、下游及流域出口位置的SOM进行统计分析(图3(d))。可以看出,营盘壕矿、纳林河二号矿相较于大海则矿、巴拉素矿SOM含量高出32%,这是因为大海则和巴拉素矿目前正在建设中,还没有正式开始开采。此外,对于纳林河流域而言,上、中、下游到流域出口SOM逐渐减少,总体下降0.57 g/kg。
3 问题与讨论
3.1 水分对有机质反演的影响
本研究中同时获取了SWC与SOM数据, 图4为6月1日、7月4日和9月21日实测的SOM和SWC的关系以及反演样点处的SOM含量。
图4
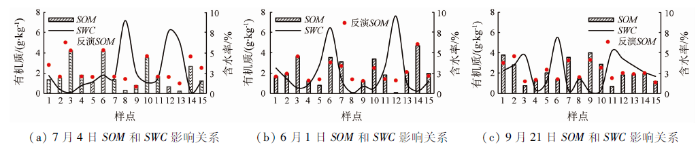
从图4(a)—(c)可以看出,土壤样品SWC值都处于10%以下,其中84%的土样SWC值处于5%以下,除部分样点部分时期SOM与SWC呈相反关系外,其余大部分没有明显关联性,证明此区域SOM并未受到SWC的影响。
3.2 采矿前后有机质含量的变化
图5
3.3 SOM回归反演模型的精度评价
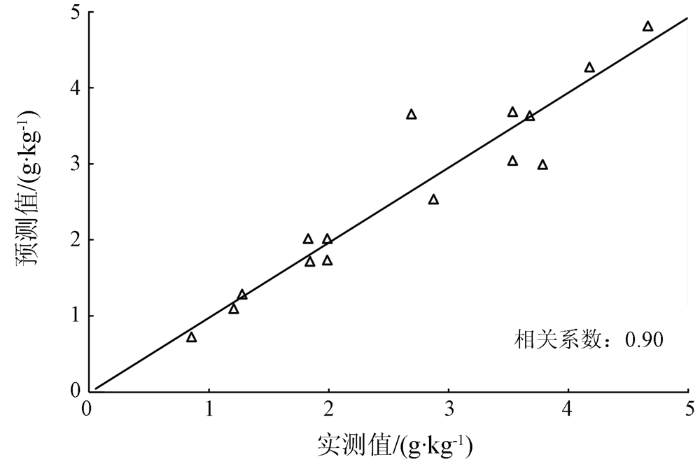
一阶微分光谱的线性回归模型是本研究内的最优估算模型,取得良好的预测结果,其实测SOM和预测SOM量化数据的相关系数达到0.90,如图6所示。采用该方法反演干旱半干旱区的井工矿区域具有很高的可行性,也为更加快速、准确地估测SOM含量提供了一个新思路。
图6
干旱半干旱地区SOM含量被长期忽视,可能有大量的碳循环过程的存在,其碳循环内部以及煤矿开采过程、生态恢复过程中动态含量变换仍无法在我国西北地区完全精准提取SOM含量[39],主要由于干旱半干旱地区地貌广阔,本次研究区的范围对于整个西北干旱半干旱地区仍然面积较小,因此,基于本次SOM空间分布格局研究仍为将来实时监测SOM奠定了理论基础。
4 结论
1)对土壤高光谱反射率及数学变换结果与实测SOM作相关分析分析,得到相关性为R'>R>lgR>1/R; 并通过0.05显著相关性检验,提取关系显著的特征波段为: 400 nm,412 nm,420 nm,436 nm,457 nm,467 nm,490 nm,546 nm,592 nm,602 nm,625 nm,636 nm,644 nm,666 nm,676 nm,767 nm,773 nm,806 nm,868 nm和885 nm。
2)对高光谱、多光谱和SOM进行相关性分析,得到了最优线性回归方程,并反演预测SOM,得到2019年6月1日、7月4日、9月21日的区域SOM量化数值,量化数据的相关性达到0.90。
3)对研究区SOM空间分布格局及流域不同位置处SOM的分析表明: 研究区总体SOM普遍处于较低水平,流域上、中、下游到流域出口的SOM逐渐减少,且采矿前SOM含量明显高于采矿后,说明采矿过程对于SOM影响极大。
参考文献
Degradation of organic pollutants by ferrate/biochar:Enhanced formation of strong intermediate oxidative iron species
[J].DOI:10.1016/j.watres.2020.116054 URL [本文引用: 1]
Historical CO2 emissions from land use and land cover change and their uncertainty
[J].
Direct evidence using a controlled greenhouse study for threshold effects of soil organic matter on crop growth
[J].
Enhancement and improvement of selenium in soil to the resistance of rape stem against Sclerotinia sclerotiorum and the inhibition of dissolved organic matter derived from rape straw on mycelium
[J].
DOI:S0269-7491(20)30775-2
PMID:32454382
[本文引用: 1]

Sclerotinia stem rot (SSR), caused by Sclerotinia sclerotiorum (S. sclerotiorum), one of the most destructive diseases in many crops including Brassica napus L. The extensive use of fungicides to control S. sclerotiorum caused severe damage to the environment in the long term. Increasing study reported that selenium (Se) is a beneficial element for plant by promoting growth and enhancing disease resistance. In this study, it was found that Se in soil shortened lesion length by 19.14% on rape stem infected with S. sclerotiorum. While resistance mechanism of rape stem against S. sclerotiorum remains unknown. Transcriptomic analysis of rape stem was performed and the results indicated that genes related to antifungal pathways were up-regulated. Moreover, metabonomic analysis was carried out to study the inhibitive effect of the dissolved organic matter derived from rape straw with Se pretreatment in soil (RSDOM) on S. sclerotiorum mycelium, results showed that RSDOM caused severe damage to energy metabolism of mycelium. Further study indicated that RSDOM decreased the pathogenicity of mycelium on rape leaves significantly, and enhanced content of chlorophyII, carotenoids, OD phenol and activities of phenylalanine ammonia-lyase (PAL), polyphenol oxidase (PPO) in rape leaves, which suggested that RSDOM plays a positive role in regulating oxidative stress responses of plant when infected with S. sclerotiorum. In addition, when compared with dimcthachlon (DIM) treatment alone, DIM combined with RSDOM resulted in higher inhibition on mycelial growth of S. sclerotiorum (the inhibition ratio of nearly 60%). Results in this study suggested that Se enhanced the resistance of rape stem against S. sclerotiorum because of the up-regulated genes related to antifungal pathways, and RSDOM improved the mycelial growth inhibition and decreased the pathogenicity of mycelium on rape leaves. Overall, Se as well as Se-enrich byproducts, possessed great potential to be developed as ecological fungicides for controlling S. sclerotiorum.Copyright © 2020 Elsevier Ltd. All rights reserved.
土壤有机质高光谱遥感和地统计定量预测
[J].
Quantitative prediction of soil organic matter content using hyper spectral remote senging and geo-statistics
[J].
What is soil organic matter worth?
[J].The conservation and restoration of soil organic matter are often advocated because of the generally beneficial effects on soil attributes for plant growth and crop production. More recently, organic matter has become important as a terrestrial sink and store for C and N. We have attempted to derive a monetary value of soil organic matter for crop production and storage functions in three contrasting New Zealand soil orders (Gley, Melanic, and Granular Soils). Soil chemical and physical characteristics of real-life examples of three pairs of matched soils with low organic matter contents (after long-term continuous cropping for vegetables or maize) or high organic matter content (continuous pasture) were used as input data for a pasture (grass-clover) production model. The differences in pasture dry matter yields (non-irrigated) were calculated for three climate scenarios (wet, dry, and average years) and the yields converted to an equivalent weight and financial value of milk solids. We also estimated the hypothetical value of the C and N sequestered during the recovery phase of the low organic matter content soils assuming trading with C and N credits. For all three soil orders, and for the three climate scenarios, pasture dry matter yields were decreased in the soils with lower organic matter contents. The extra organic matter in the high C soils was estimated to be worth NZ$27 to NZ$150 ha(-1) yr(-1) in terms of increased milk solids production. The decreased yields from the previously cropped soils were predicted to persist for 36 to 125 yr, but with declining effect as organic matter gradually recovered, giving an accumulated loss in pastoral production worth around NZ$518 to NZ$1239 ha(-1). This was 42 to 73 times lower than the hypothetical value of the organic matter as a sequestering agent for C and N, which varied between NZ$22,963 to NZ$90,849 depending on the soil, region, discount rates, and values used for carbon and nitrogen credits.
基于多光谱数据的荒漠矿区土壤有机质估算模型
[J].
Estimation model of soil organic matter in desert mining area based on multispectral image data
[J].
Hyperspectral estimation of soil organic matter based on different spectral preprocessing techniques
[J].DOI:10.1080/00387010.2017.1297958 URL [本文引用: 1]
基于机器学习的稀疏样本下的土壤有机质估算方法
[J].
DOI:10.12082/dqxxkx.2020.190441
[本文引用: 1]
采用GRNN(Generalized Regression Neural Network)和RF(Random Forest)2种机器学习方法构建土壤有机质预测模型,以提高稀疏样本情况下的土壤有机质估算精度。依据北京市大兴区农用地2007年的土壤有机质采样数据,按MMSD准则(Minimization of the Mean of the Shortest Distances)抽稀为8种不同采样密度的样本(分别为2703、1352、676、339、169、85、43、22个样本),分别采用GRNN、RF和Ordinary kriging对各采样密度下的未知采样点进行预测,采用交叉检验的方式验证各采样密度下未知样点的预测精度。随着采样点密度的下降,样点间的空间自相关性逐渐减弱,半变异函数的拟和精度变差,预测点结果误差增大,预测的置信度降低。当抽稀到43个和22个采样点时,样点间的空间自相关性接近歼灭,半变异函数的决定系数较低且残差较大。普通克里格受到采样点数量和采样密度、样点的空间结构的影响比较明显,其预测精度随采样点数量的下降而下降。在85个采样点及以下时,其预测值与观测值之间没有显著的相关性。GRNN和RF的预测精度受采样密度的影响不大,其预测精度在一个较小的范围内波动,其预测值围绕观测值在一定阈值空间内震荡波动,具有较好的相关性,在85个及以下的采样密度时,预测精度相对普通克里格有较大的提升。普通克里格法不适合在稀疏样本条件下空间插值计算,尤其是在空间自相关性比较弱的情况下。机器学习模型能充分学习土壤间环境信息、样点空间邻近效应信息,兼顾属性相似性和空间自相关,具有更好的稳定性和适应性,不容易受到采样点数量、构型和采样密度等因素的影响,即使在采样点空间自相关性很弱的情况下也能做出稳定预测精度。
Estimating soil organic matter based on machine learning under sparse sample
[J].
Influence of environmental variables on the structure and composition of soil bacterial communities in natural and constructed wetlands
[J].DOI:10.1016/j.scitotenv.2014.11.039 URL [本文引用: 1]
Land-use/cover change effects and carbon controls on volcanic soil profiles in highland temperate forests
[J].
基于偏最小二乘的土壤重金属镉间接反演模型
[J].
Research on indirect hyperspectral estimating model of heavy metal Cd based on partial least squares regression
[J].
东北典型黑土区表层土壤有机质含量高光谱反演研究
[J].
Hyperspectral retrieval of surface soil organic matter content in a typical black soil region of northeast china
[J].
The refined spatiotemporal representation of soil organic matter based on remote images fusion of Sentinel-2 and Sentinel-3
[J].
Variability of laboratory measured soil lines of soils from southheastern Brazil
[J].
基于分数阶微分优化光谱指数的土壤电导率高光谱估算
[J].
Hyperspectral estimation of soil electrical conductivity based on fractional order differentially optimised spectral indices
[J].
南二坡光谱反射率特性与有机质含量的相关性
[J].
Correlation between spectral reflectance and organic matter content of the Nanerpo
[J].
基于高光谱数据的土壤有机质含量反演模型比较
[J].
Comparison on inversion model of soil organic matter content based on hyperspectral data
[J].
Effects of moisture and salinity on soil dissolved organic matter and ecological risk of coastal wetland
[J].DOI:10.1016/j.envres.2020.109659 URL [本文引用: 1]
Rapid identification of soil organic matter level via visible and near-infrared spectroscopy:Effects of two-dimensional correlation coefficient and extreme learning machine
[J].DOI:10.1016/j.scitotenv.2018.06.319 URL [本文引用: 1]
Relating organic matter and clay content to the multi-spectral radiance of soils
[J].DOI:10.1097/00010694-197212000-00011 URL [本文引用: 1]
不同土地利用类型下土壤有机碳含量的高光谱反演
[J].
Hyper-spectral inversion of soil organic carbon content under different land use typrs
[J].
毛乌素沙地不同土地利用类型的土壤粒度及有机质特征
[J].
Soil particle size and organic matter content of different land use types in the Mu Us sandland
[J].
Hyperspectral analysis of total nitrogen in soil using a synchronized decoloring fuzzy measured value method
[J].
优化光谱指数的露天煤矿区土壤重金属含量估算
[J].
Estimation of heavy metal contents in soil around open pit coal mine area based on optimized spectral index
[J].
DOI:10.3964/j.issn.1000-0593(2019)08-2486-09
[本文引用: 1]
Spectroscopy is regarded as a quick and nondestructive method to classify and analyze quantitatively many of elements of the soil. Visible and near -infrared re? ectance spectroscopy offers a conductive tool for investigating soil heavymetal pollution. In this work, 51 soil samples with depths of 0-10 cm were collected, which were in the Eastern Junggar coal -field mining area, Xinjiang. The soil organic matter (SOM) content, Arsenic (As) content and indoor hyperspectra were measured in the laboratory. The significant relationship between As content and hyperspectral data was conductive analysis of NPDIs, which were calculated from Vis-NIR region. For calculating the indices, on the basis of the raw spectral reflectance (R), its three mathematical transformations were calculated, i. e., the reciprocal (1/R), logarithm (lgR) and root mean square method ( sqrt-R/IT2), respectively. The two band combination of optimized indices software V1.0 (No: 2018R11S177501, independently developed based on the JAVA) was used during the calculation of the indices. NPDIs were calculated using all possible combinations of available bands (i nm and j nm) in the full spectral region (400-2 400 nm). In the optimal spectral indices (1r 73 and p= 0. 001), an index of VIP_>. -1 was further selected as a model independent variable by the Variable importance in projection (VIP) selection method. The main goal of this work is to obtain optimized spectral index (NPDI) related to soil heavy metal As, to estimate As concentration in soil based on geographically weighted regression (GWR) model, and to investigate the plausibility of using optimized spectral index for hyperspectral detection of heavy metal Arsenic in soil of coal mining areas. To assess the performance of the soil heavy metal contents prediction models, four cross -validation metrics were used; Residual Prediction Deviation (RPD), the Coefficient of Determination (R2) the Root Mean Square Error (RMSE) and Akaike Information Criterion (ACI). The results of this study are as follows: (1) As has the largest dispersion in the study area, SOM contents in all samples are less than 2%, and the As concentration has no significant correlation with the SOM content at a significance level of 0. 01 (1r =0. 113). (2) Single-bandreflectance shows low correlation with As contents, lower than 0. 228. However, the highest correlation coefficient and lowest p -values (1r1...>.-0. 73 and p=0. 001) between As and NPDIs calculated by original and transformed reflectance (R, 1/R, lgR, /1-2) are found in theNear-infrared (NIR, 780-1 100 nm) and Shortwave -infrared (SWIR, 1 100-1 935 nm) long wavelength infrared. The original spectral region formed with long wave length near -infrared (LW-NIR) regions show highest correlation with As contents (17'1=0. 74). (3) VIP value of NPDIR( 417/1 246) NPD11/R(799/953, 825/947), NPDisqrt-R(1023/1 257, 1 008/1 249, 1 021/1 250, 1 020/1 247) and NPDl15R(801/953, 811/953, 817/951, 825/947, 828/945) higher than 1, thus these NPDIs are chosen as independent variables. (4) From the four prediction model (GWR) performances it can be seen, the Model -a (R) showed superior performance to other three models (Model -b (1/R), Model -c (/) and Model -d (1gR)), and it has the highest validation coefficients (R-2 =0. 831, RMSE=4. 912 mu g. g(-1), RPD=2. 321) and lowest AIC value (ATC=179. 96). The hyperspectral optimized index NPDIR(417/1 246) may help to quickly and accurately evaluate Arsenic contents in soil, furthermore, the results provide theoretical and data support to accesse the distribution of heavy metal pollution in surface soil, promoting fast and efficient investigation of mining environment pollution and sustainable development of ecology.
Temperature sensitivity of soil organic matter decomposition varies with biochar application and soil type
[J].DOI:10.1016/S1002-0160(20)60013-3 URL [本文引用: 1]
基于波段选择与学习字典的高光谱图像异常探测
[J].
Hyperspectral imagery anomaly detection based on band selection and learning dictionary
[J].
A comparison of machine learning techniques for modeling river flow time series:The case of upper Cauvery River Basin
[J].DOI:10.1007/s11269-014-0705-0 URL [本文引用: 1]
土壤质量及其评价
[J].
Soil quality and its evaluation
[J].
Stratification of a local VIS-NIR-SWIR spectral library by homogeneity criteria yields more accurate soil organic carbon predictions
[J].
DOI:10.1016/j.geoderma.2018.10.015
[本文引用: 1]
Considering the hypothesis that the predictive capacity of models is tied to soil characteristics, the stratification of a spectral library into groups is a strategy to improve the accuracy of the predictions. Thus, the objective of this study was to i) characterize and identify differences among spectra obtained for subtropical soils samples, ii) evaluate different pre-processing techniques and multivariate methods to propose SOC prediction models from the spectral data and iii) evaluate the performance of SOC prediction models calibrated from the stratification of a local library. A local spectral library of soils (n = 841 samples) was used in the Planalto region of the State of Rio Grande do Sul, Brazil. Soil classes that occur in the area are: Rhodic Ferralsol (FR) and Dystric Gleysol (GL). Land uses are: native forest (NFo), native field (NFi) and crops in no -tillage system (CTS). SOC was determined via wet combustion with sulphochromic solution. Spectral reflectance measurements were performed in the laboratory with a spectroradiometer in the range of 350-2500 nm. Six pre-processing techniques were applied to the spectra (including derivatives, normalization and non-linear transformations) and four multivariate calibration methods, namely, partial least squares regression (PLSR), multiple linear regression (MLR), support vector machines (SVM) and random forest (RF), were used with the objective of identifying the best combination to predict SOC. After determining the best combination, the spectral library was stratified into groups based on soil class, land use, sample layer and spectral characteristics. The models were built with 70% of the samples for calibration and 30% for independent validation. The coefficient of determination (R-v(2)), root mean square error (RMSEV) and ratio of performance to interquartile range (RPIQ(v)) of the independent validation were used to evaluate the performance of the models. The spectral curves presented different absorption characteristics in relation to soil classes and land uses. SGD pre-processing technique had the highest R-V(2) and RMSEV values for all models. Among the multivariate methods, PLSR had the best performance for SOC prediction for the total set of samples (R-v(2) = 0.74, RMSEV, = 0.52% and RPIQ(v) = 2.23), followed by models SVM, MLR, and RF. The FR -CTS (n = 445) group showed the best model performance after stratification, with R-v(2) = 0.82, RMSEv = 0.29% and RPIQ(v) = 2.60. For some stratified groups, the use of a smaller number of samples to build the model reduced the performance of the models, suggesting that one must be careful when working with small datasets. This study highlights the potential for the application of VIS-NIR-SWIR spectroscopy as a reliable and economical tool to quantify SOC concentrations for subtropical soils with high levels of iron oxides and clay on a local scale. Predictive models can be improved when the variation in soil characteristics is considered, underscoring the need for a preliminary study examining the grouping of the sample set to validate the use of local spectral libraries for the prediction of soil properties.
Sensitivity of clay content prediction to spectral configuration of VNIR/SWIR imaging data,from multispectral to hyperspectral scenarios
[J].DOI:10.1016/j.rse.2017.10.047 URL [本文引用: 1]
黄土丘陵缓坡风沙区不同土地利用类型土壤水分变化特征
[J].
Soil moisture variation characteristics of different land use types in the moderate slope sandy area of loess hilly region
[J].
Effects of temperature and moisture on soil organic matter decomposition along elevation gradients on the Changbai Mountains,Northeast China
[J].DOI:10.1016/S1002-0160(15)60052-2 URL [本文引用: 1]
Estimating photosynthetic traits from reflectance spectra:Asynjournal of spectral indices,numerical inversion,and partialleast square regression
[J].
干旱地区煤层开采对地表土壤理化性质的影响
[J].
Effect of coal mining on surface soil physicochemical of sandy land in the arid region
[J].
Impacts of soil moisture level and organic matter content on growth of two Juncus species and Poa pratensis grown under acid soil conditions
[J].
DOI:10.1111/wre.12387
[本文引用: 1]
The abundance of Juncus effusus (soft rush) and Juncus conglomeratus (compact rush) has increased in coastal grasslands in Norway over recent decades, and their spread has coincided with increased precipitation in the region. Especially in water-saturated, peaty soils, it appears from field observations that productive grasses cannot compete effectively with such rapidly growing rush plants. In autumn-winters of 2012-2013 and 2013-2014, a four-factor, randomised block greenhouse experiment was performed to investigate the effect of different soil moisture regimes and organic matter contents on competition between these rush species and smooth meadow-grass (Poa pratensis). The rush species were grown in monoculture and in competition with the meadow-grass, using the equivalent of full and half the recommended seed rate for the latter. After about three months, above- and below-ground dry matter was measured. J. effusus had more vigorous growth, producing on average 23-40% greater biomass in both fractions than J. conglomeratus. The competitive ability of both rush species declined with decreasing soil moisture; at the lowest levels of soil moisture, growth reductions were up to 93% in J. conglomeratus and 74% in J. effusus. Increasing water level in peat-sand mixture decreased competivitiveness of meadow-grass, while pure peat, when moist, completely impeded its below-ground development. These results show that control of rush plants through management may only be achieved if basic soil limitations have been resolved.
煤矿微生物复垦区灌木林下土壤养分的空间异质性
[J].
Spatial heterogeneity of soil nutrients under shrubbery in micro-reclamation demonstration base in coal mine areas of China
[J].
草原区煤矿开采对周边旱作农田土壤养分和重金属的影响
[J].
The impact of coal mining on soil nutrients and heavy metals in rainfed farmland in arid grassland area
[J].
Taklimakan desert carbon-sink decreases under climate change
[J].DOI:10.1016/j.scib.2019.12.022 URL [本文引用: 1]
