浮岛光伏电场对地表温度空间分布特征的影响
伯英杰1,2( ), 曾业隆3, 李国庆1(), 曹兴文4, 姚清秀2
), 曾业隆3, 李国庆1(), 曹兴文4, 姚清秀2
Impacts of floating solar parks on spatial pattern of land surface temperature
BO Yingjie1,2(), ZENG Yelong3, LI Guoqing1(), CAO Xingwen4, YAO Qingxiu2
), ZENG Yelong3, LI Guoqing1(), CAO Xingwen4, YAO Qingxiu2
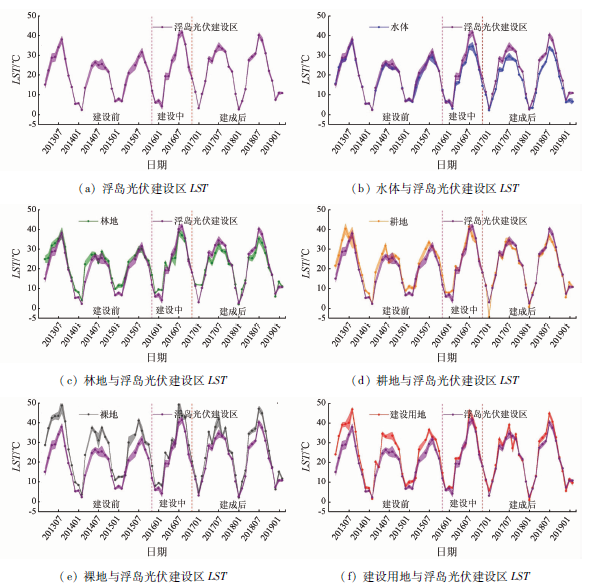
图6. 浮岛光伏电场不同建设阶段的逐月LST变化曲线(阴影部分为LST的标准差)
Fig.6. Monthly LST curve of the floating solar park in different construction stages