

0 引言
目前已有许多国内外学者应用波段光谱组合和地表反照率等特征参量建立特征空间,对土壤盐渍化开展定量研究,直接解译盐渍化土壤光谱与依据植被特征间接反演相结合,将盐渍化信息量反映至最大[6]。研究主要集中于3种盐渍区: 滨海盐渍区、极端干旱漠境盐渍区和半干旱绿洲农田盐渍区。Thiam等[7]在塞内加尔的萨卢姆河三角洲滨海区通过电导率结合高程、离河距离、归一化植被指数(normalized difference vegetation index,NDVI)、盐分指数(salinity index,SI)和土壤调整植被指数,采用多元回归分析建立了盐渍化模型; 潘肖燕等[8]和樊彦国等[9]针对黄骅滨海盐渍区和黄河口滨海三角洲盐渍区构建NDVI-SI特征空间,对滨海盐渍区进行空间分析及生态风险定量评价; 哈学萍等[10]基于地表反照率(Albedo)-SI特征空间对处于极端干旱漠境盐渍区的于田县进行盐渍化的定量研究。针对半干旱绿洲农田盐渍区的研究较多,多集中在新疆各地的绿洲农田。王飞等[11]和陈实等[12]建立基于NDVI-SI特征空间对塔里木南缘于田绿洲和天山北疆绿洲农区土壤盐渍化进行时空变化分析,能够显著区分不同盐渍化程度地类。在此基础上,张添佑等[13]通过增加Albedo和土壤湿度(wetness index,WI)等反演指标,与SI和NDVI构建了生态指数对新疆玛纳斯河流域绿洲土壤盐渍化进行监测与评价,在主成分贡献中,植被和盐分特征参量占85%以上,其他特征参量占比过小,造成信息冗余。在以往半干旱绿洲区域研究中,对于指数的选择多选用NDVI与SI,引入拟合效果更优的指数特征参量将能达到更优拟合效果和地区适宜性。
黄河上游的内蒙古巴彦淖尔市河套灌区作为我国农业生产中重要的商品粮、油基地,是我国三大特大型灌区之一[14]。河套灌区农业生产受限于半干旱区较低的降水量,对灌溉的依赖性强,潜在的土壤次生盐渍化生态环境问题显著。对于河套灌区盐渍化信息提取和定量分析,选取适合盐渍反演指标的研究较少,仅卢晶等[15]利用SI-MSAVI特征空间对巴彦淖尔市磴口县进行定量监测和相关性分析。巴彦淖尔市乌拉特前旗位于河套平原东部,是河套灌区的最下游,灌区内90%以上的高盐高碱农田排水都注入旗内的乌梁素海,次生盐渍化形势严峻。同时由于乌拉特前旗原生盐渍土地发育,盐渍化防治难度大。掌握盐渍土地空间分布和类型程度,综合防治土壤盐渍化已成为其农业发展和土地可持续利用的首要措施[16]。本文以乌拉特前旗为研究区,基于Landsat8 OLI数据和野外实地采样数据,以引入短波红外波段的增强型归一化植被指数(enhanced normalized difference vegetation index,ENDVI)与半干旱区盐分拟合效果最优的盐分指数3(salinity index 3,SI3)为特征参量,组成ENDVI-SI3特征空间并构建改进型盐渍化监测指数(improved salinization monitoring index,ISMI),在此基础上建立土壤特征变量与盐渍化过程的定量关系,为区域尺度的土壤盐渍化遥感监测和风险评估提供科学的参考依据。
1 研究区概况
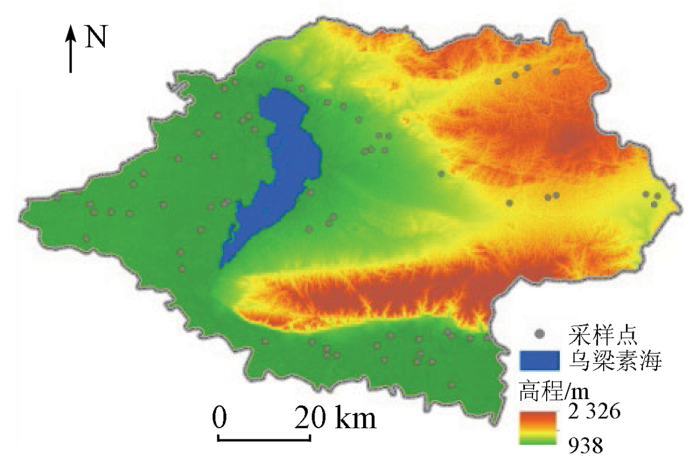
乌拉特前旗位于内蒙古自治区巴彦淖尔市,河套平原东部(图1)。地理坐标: N40°28'~41°16',E108°11'~109°54',总面积为7 476 km2。乌拉特前旗地貌类型多样,旗区内平原、丘陵、山地、沙漠交错,海拔范围为938~2 326 m,自南向北乌拉山、白音查干山和查石太山3座山脉之间分别发育明安—大佘太川和小佘太川2个带状洼地,黄河在前旗境内自西向东贯穿乌拉山南部的山前洪积扇倾斜平原,即三湖河平原。中国八大淡水湖之一的乌梁素海位居旗区中央,乌梁素海西部为河套平原东缘。
图1
乌拉特前旗气候划分上属温带大陆性气候西部季风区,中亚半干旱荒漠区,冬冷夏热,四季分明。年平均气温为5.3 ℃,年日照时数为3 208.1 h,年平均风速为3.4 m/s。年降水量介于200~250 mm之间,多集中于6—9月,年蒸发量为2 217.3 mm,蒸降比大[17]。
在地质构造上,乌拉特前旗所处的河套平原属于湖相沉积的内陆封闭式断陷盆地,盆地基底从东南到西北逐渐降低; 上更新统晚期,黄河形成并多次改道,导致盆内湖相沉积层上盖了黄河冲积层,现代地形雏形基本形成。地面排水受限于南高北低的地形和位于南部的黄河位置,地下径流受限于黄河流向导致含水层由西向东粒径逐渐变细,地面和地下排水条件均不利于天然径流排泄。研究区内主要为通气透水的轻质土壤,埋深较浅的地下水在强烈的蒸发作用下,构成了有利于潜水蒸发排泄的基础,这导致大量盐分富集在浅层土壤中,盐渍化问题显著[18]。
2 数据来源与研究方法
2.1 土壤数据采集与化学分析
根据研究区盐渍地类型差异性与空间均匀性等因素,2019年在野外采集66个土壤样品,土壤样品的采样深度为0~20 cm,为减少单个样品误差,在采样点周围3~5处多点采集组合。野外采回的样品在日光下晒干,干燥后的样品用尼龙筛过筛剔除杂质便于化学分析,具体分析项目包括: 表层土壤含盐量、容重、pH、有机质、全氮、有效磷、钙离子、镁离子、钾离子、钠离子、硫酸根、氯离子、碳酸氢根。
2.2 遥感数据处理
2.2.1 数据源与预处理
由于春季影像能反映植被自然生长趋势,受人为灌溉和耕作影响小,且处于返盐季节,土壤表层含盐量高[19],故遥感数据采用2019年4月30日的2幅Landsat8影像,行列号分别为 128/31 和128/32, 空间分辨率为 30 m,数据均来源于中国科学院计算机网络信息中心地理空间数据云平台(
2.2.2 植被指数
但是多数植被指数都仅含有近红外和可见光中的2个波段信息,信息量较少。故在此基础上引入短波红外波段进行补充,构建含短波红外信息的拓展植被指数,有利于减少波段间的多重共线性,提高土壤盐渍化建模的精确度[23]。其中ENDVI为 NDVI引入短波红外2波段得出,其数值大小随表层含盐量增加而减少,在植被类型复杂和稀疏程度不一的地区都有较好的反演效果,因此本文选择ENDVI作为反演土壤盐渍化的一个指标,其计算公式为:
式中NIR,
2.2.3 盐分指数
盐分指数作为直接反演土壤盐渍化水平的特征指标,在土壤盐渍化监测中能提供较高精度的反演结果。常见的盐分指数包括归一化盐分指数(normalized difference salinity index,NDSI)、盐分指数1(salinity index 1,SI1)、盐分指数2(salinity index 2,SI2)、盐分指数3(salinity index 3,SI3)、盐分指数(salinity index,S2)、盐分指数(salinity index,SI-T)等[24]。
Khan等[25]利用IRS-1B卫星的LISS-II传感器提出了NDSI和SI,用于评估巴基斯坦的盐渍化土地退化; Bannari等[26]从EO-1 ALI光谱波段提出了3种不同的盐分指标SI1,SI2和SI3,用于区分摩洛哥的轻度和中度盐渍土壤,其中SI3具有最高的相关性; Allbed等[24]发现在植被密度较低和裸地较多的地区, NDSI和SI-T与土壤盐分的相关性最高。随后王爽等[27]和张俊华等[28]在此基础上对国内半干旱绿洲地区如宁夏银北、新疆渭干河—库车河三角洲等地的盐分光谱特征进行研究分析,光谱反演模型中SI3为土壤盐分反演的最佳指数,SI3与对各项盐分指标尤其是Cl-和K+均呈极显著相关性。基于相关性最强的原则,选取SI3作为构建特征空间的变量之一,其计算公式为:
式中
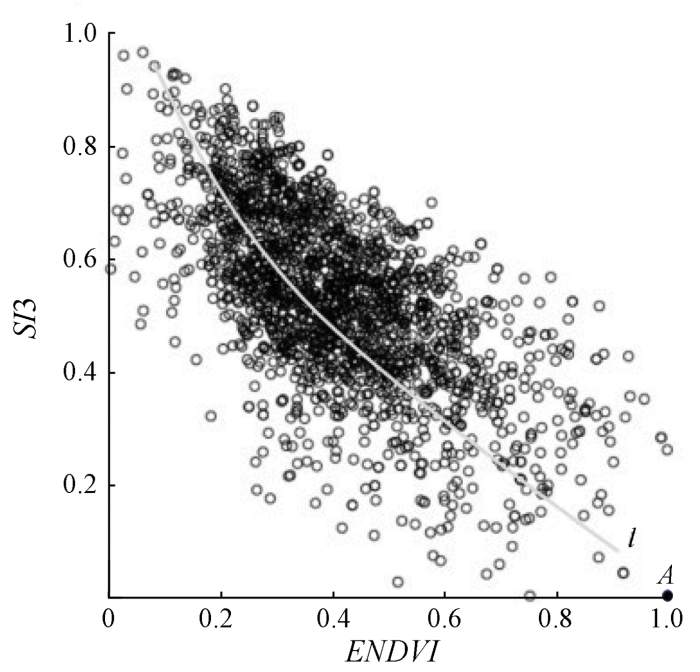
2.3 ENDVI-SI3特征空间构建
在ENVI5.3平台下通过Band Math工具运算获得ENDVI与SI3数据,为消除变量数据的量级差异,需对研究区内ENDVI与SI3进行统计分析得出最值,然后进行标准化处理,公式为:
式中:
图2
2.4 盐渍化监测模型的构建
3 模型应用及验证
3.1 ISMI精度验证
利用ArcGIS软件的Extract Values to Points功能,计算66个采样点对应的ISMI,与实测表层土壤含盐量作相关性分析。结果显示,ISMI与实测含盐量相关系数达到了0.82,并且通过0.01(双侧)水平的显著性检验。与此同时将各项指数分别提取并与含盐量做相关性分析(表1),发现ISMI与含盐量的相关系数不仅高于ENDVI和SI3与含盐量的相关系数,也高于任意一项单独指数与含盐量的相关系数,即ISMI在反演盐分的精确度上明显优越于单项指数。在单项指数的比较中,ENDVI显著优于其他植被指数和增强型植被指数,相较于未引入短波红外的NDVI反演精度也有明显提升; 在各项盐分指数中,SI和SI3等指数与含盐量的相关系数均超过了0.7,反演结果较优,SI3反演结果在盐分指数中最优。从相关分析结果可以看出,ENDVI与SI3这2个特征参量的优越性高于其他指数,同时ISMI对于土壤盐渍化的反演精度相较于单独的NDVI,ENDVI和SI3大幅提升,说明ISMI能够较好地反映研究区土壤盐渍化现状,能够利用ISMI对研究区的盐渍土壤进行快速定量监测。
表1 指数相关性分析结果
Tab.1
| 指数 | 全称 | 公式① | 相关系数 |
|---|---|---|---|
| NDVI | 归一化植被指数 | -0.66 | |
| ENDVI | 增强型归一化植被指数 | -0.70 | |
| EVI | 增强植被指数 | -0.54 | |
| EEVI | 扩展型增强植被指数 | -0.46 | |
| MSAVI | 修正土壤调节植被指数 | -0.67 | |
| SI | 盐分指数 | 0.72 | |
| ESI | 增强型盐分指数 | 0.73 | |
| SI3 | 盐分指数3 | 0.75 | |
| ESI3 | 增强型盐分指数3 | 0.64 | |
| S2 | 盐分指数 | 0.62 | |
| ES2 | 增强型盐分指数 | -0.61 | |
| SI-T | 盐分指数 | 0.68 | |
| ESI-T | 增强型盐分指数 | 0.73 | |
| NDSI | 归一化盐分指数 | 0.43 | |
| ENDSI | 增强型归一化盐分指数 | 0.61 |
①式中B和SWIR1分别为遥感影像中蓝光和短波红外1波段的反射率值。
表2 基于ISMI的盐渍土壤分级
Tab.2
| 盐渍化程度 | 土壤含盐量/ (g·kg-1) | ISMI | 植被生 长状况 | 面积/km2 | 占比/% |
|---|---|---|---|---|---|
| 非盐渍土 | <1 | <0.20 | 正常 | 907.44 | 18.89 |
| 弱度盐渍土 | [1,2) | [0.20,0.27) | 轻微 | 2 591.16 | 53.93 |
| 中度盐渍土 | [2,4) | [0.27,0.41) | 受限 | 968.72 | 20.16 |
| 强度盐渍土 | [4,6) | [0.41,0.56) | 不良 | 174.42 | 3.63 |
| 盐土 | ≥6 | ≥0.56 | 困难 | 163.20 | 3.40 |
根据不同程度盐渍土对应的ISMI进行重分类,得到乌拉特前旗土壤盐渍化空间分布情况(图3),研究区内盐渍土分布以乌梁素海为界,呈西高东低,不同程度的盐渍土分布广泛,各个乡镇的盐渍化程度有较大差异。
图3
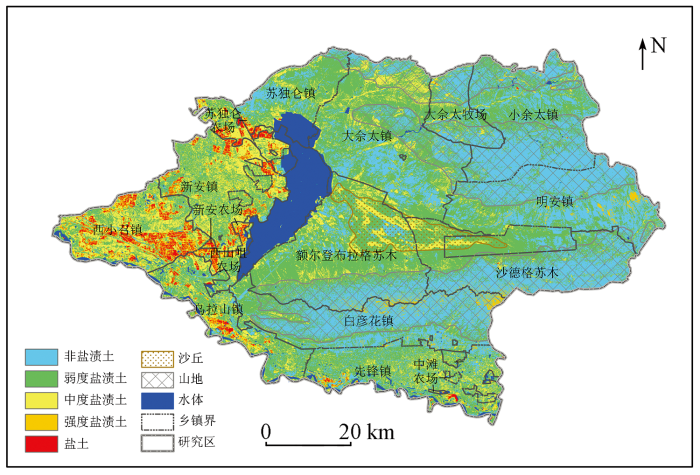
图3
基于ISMI的乌拉特前旗盐渍土壤空间分布
Fig.3
Spatial distribution of saline soil in Urad Front Banner based on ISMI
除含有大面积水体的乌梁素海渔场外,弱中度盐渍土在各乡镇均有大面积分布,两者占比在40%~65%左右。综合分析表明,研究区内土壤盐渍化程度高,ISMI均值为0.25。将水体和山体掩模后的平原地区ISMI均值为0.26,逼近中度盐渍化的水平,需要重视盐渍化现状问题的乡镇为西小召镇、新安农场、西山咀农场和苏独仑农场。
3.2 盐渍化风险评估模型
3.2.1 盐渍化风险评估因子处理
利用SPSS软件对土壤分析项目做相关性分析,计算Pearson相关系数并进行显著性检验。筛选出与ISMI存在显著相关(P<0.05)的含盐量、有机质、有效磷、钙离子、镁离子、钠离子、硫酸根和氯离子8个变量指标,作为盐渍化风险评估因子。
灰色关联分析法为通过比较关联度大小得出待识别对象对研究对象影响程度的数据分析方法,能够衡量数据间的同步变化程度[32]。将ISMI作为灰色关联分析法的母序列,将8个变量指标作为子序列,利用MATLAB程序分别计算出子序列的各项与母序列参数的灰色关联系数最后得出灰色关联度,将其标准化后得到评价因子对应的权重(表3)。利用ArcGIS软件的Interpolation功能对8个评估因子选择Kriging插值法进行空间插值,Kriging插值法广泛应用于土壤科学中不规则分布样点的空间插值[33]。同时将8个因子插值得到的评估中间层栅格,运用自然断点法将其重分类为10级,通过ArcGIS软件的Raster Calculator功能将8个评估中间层的重分类栅格计算加权得到研究区土壤盐渍化风险评估值(salinization risk assessment value,SRAV),公式为:
式中:
表3 盐渍化风险评估因子相关性筛选及赋权
Tab.3
| 变量 | 相关系 数r | 显著水 平P | 样本 数 | 灰色关 联度 | 权重 |
|---|---|---|---|---|---|
| 镁离子/(g·kg-1) | 0.836 | <0.001 | 66 | 0.909 | 0.126 |
| 含盐量/(g·kg-1) | 0.820 | <0.001 | 66 | 0.917 | 0.127 |
| 氯离子/(g·kg-1) | 0.772 | <0.001 | 66 | 0.897 | 0.124 |
| 钠离子/(g·kg-1) | 0.752 | <0.001 | 66 | 0.884 | 0.123 |
| 硫酸根/(g·kg-1) | 0.635 | <0.001 | 66 | 0.833 | 0.115 |
| 钙离子/(g·kg-1) | 0.524 | <0.001 | 66 | 0.949 | 0.132 |
| 有机质/(g·kg-1) | -0.327 | 0.007 | 66 | 0.924 | 0.128 |
| 有效磷/(mg·kg-1) | 0.289 | 0.019 | 66 | 0.900 | 0.125 |
| 钾离子/(g·kg-1) | 0.228 | 0.065 | 66 | 0.949 | — |
| pH | 0.212 | 0.087 | 66 | 0.958 | — |
| 全氮/(g·kg-1) | -0.203 | 0.103 | 66 | 0.927 | — |
| 容重/(g·cm-3) | -0.196 | 0.115 | 66 | 0.952 | — |
| 碳酸氢根/(g·kg-1) | 0.061 | 0.629 | 66 | 0.939 | — |
3.2.2 盐渍化风险评估模型精度评价
将土壤盐渍化风险值SRAV与ISMI通过MATLAB软件进行函数拟合,得出拟合程度最高的模型为Polynomial多项式逼近的quadratic polynomial二次多项式,Robust选择最小绝对残差(least absolute residua,LAR)模型,x为SRAV,y为ISMI,得其函数关系如图4所示。
图4
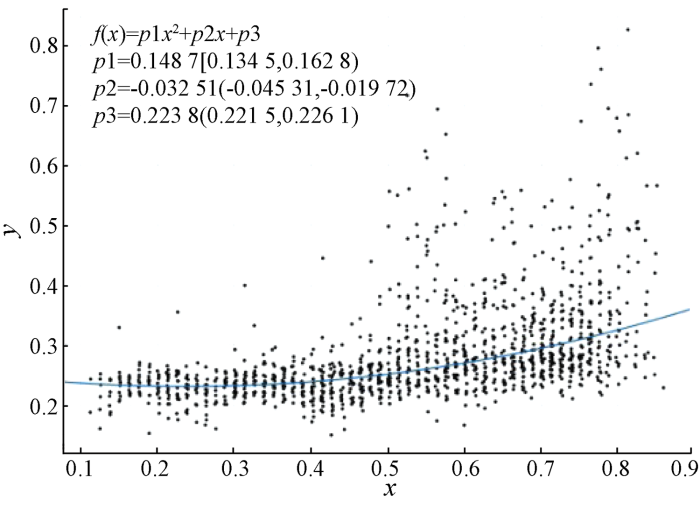
函数关系式为:
结果显示,确定系数R2达到了0.62,均方根误差为0.06,误差平方和为301.80,从拟合结果来看,基于二者存在较强相关性,拟合效果总体较好,表明基于ISMI构建后续盐渍化风险模型有较高精度,但在SRAV高值区拟合效果较差,因为SRAV高值时,高值影响因子较多,高盐渍化风险成因复杂,后续研究可以继续通过引入更多元类型的盐渍化风险评估因子来校正SRAV,达到较好的高值拟合效果。
3.2.3 盐渍化风险空间分布与评估分级
盐渍化风险评估值空间分布具有明显的空间差异性(图5)。对SRAV进行统计分析可得,SRAV范围为0.11~0.86,平均值为0.35,总体盐渍化风险较大,以乌梁素海为界呈西高东低的状态。
图5
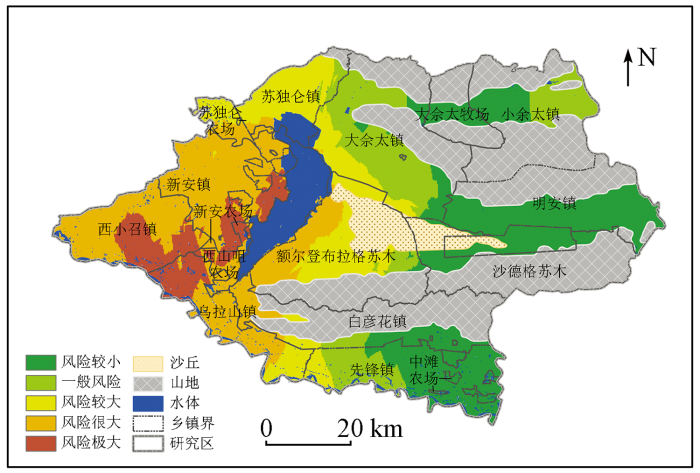
图5
乌拉特前旗土壤盐渍化风险评估空间分布
Fig.5
Spatial distribution of soil salinization risk assessment in Urad Front Banner
表4 乌拉特前旗土壤盐渍化风险评估分级
Tab.4
| 风险等级 | 风险程度 | 风险值 | 面积/km2 | 面积比例/% |
|---|---|---|---|---|
| 1 | 风险极大 | ≥0.75 | 401.17 | 8.31 |
| 2 | 风险很大 | [0.5,0.75) | 1 420.06 | 29.43 |
| 3 | 风险较大 | [0.3,0.5) | 803.66 | 16.66 |
| 4 | 一般风险 | [0.2,0.3) | 796.60 | 16.51 |
| 5 | 风险较小 | <0.2 | 1 403.39 | 29.09 |
4 结论与讨论
1)由乌拉特前旗改进型盐渍化监测模型可得,ISMI与实测含盐量呈显著相关,相关系数达0.82,在0.01(双侧)水平上通过显著性检验,高于ENDVI与SI3的相关系数(-0.70和0.75),同时也高于其他指数的相关系数。与之前研究中ENDVI与含盐量的相关系数也高于NDVI的相关系数(-0.66),半干旱区中SI3在盐度指数里反演效果最好的结论吻合。相较于NDVI,ENDVI和SI3等单项指数,ISMI的反演精度显著提升。
2)ISMI显示研究区盐渍化程度较高,平均值为0.25。平原地区的ISMI平均值达到0.26,接近中度盐渍化水平。盐土与强度盐渍土ISMI在[0.41,0.56)和≥0.56的范围的总面积达到了337.62 km2,占平原总面积的7.03%,严重影响农业生产,需积极采取排水、冲洗、改良等脱盐农业措施,控制用水,实行保墒,井、渠双排,井、沟双排,防止土壤次生盐渍化引发的一系列生态退化及农业减产等问题。
3)盐渍化风险评估因子权重大小排序为: 钙离子>有机质>含盐量>镁离子>有效磷>氯离子>钠离子>硫酸根,盐渍化风险评估因子插值赋权计算得到盐渍化风险评估值,其值处于0.11~0.86之间,平均值为0.35,分级后研究区内风险较大及以上的区域占比总和已达54.40%,总体盐渍化风险较大,以乌梁素海为界呈西高东低的状态,原因是乌梁素海西部土地主要利用类型只有水浇地,且位于河套灌区,灌溉采用矿化度较高的黄河水淹灌且土壤粉粒含量高,水分入渗速度慢,盐分常年滞留。
参考文献
中国盐渍土研究的发展历程与展望
[J].
Development and prospect of the research on salt-affected soils in China
[J].
Soil salinity mapping and monitoring in arid and semi-arid regions using remote sensing technology:A review
[J].DOI:10.4236/ars.2013.24040 URL [本文引用: 1]
Remote sensing of soil salinity:Potentials and constraints
[J].DOI:10.1016/S0034-4257(02)00188-8 URL [本文引用: 1]
土壤盐渍化的遥感监测方法及应用
[J].
Remote sensing monitoring method of soil salinization and its application
[J].
Monitoring land use and soil salinity changes in coastal landscape:A case study from Senegal
[J].DOI:10.1007/s10661-021-08958-7 URL [本文引用: 1]
基于SDI校正指数的滨海平原盐渍化生态风险评价
[J].
Ecological risk assessment of salinization in coastal plain based on SDI correction index
[J].
基于植被指数-盐分指数特征空间的黄河三角洲盐渍化遥感监测研究
[J].
Remote sensing monitoring model of soil salinization in the Yellow River delta zone based on vegetation index-salt index feature space
[J].
基于SI-Albedo特征空间的土壤盐渍化遥感监测指数研究
[J].
SI-Albedo space-based remote sensing synthesis index models for monitoring of soil salinization
[J].
基于NDVI-SI特征空间的土壤盐渍化遥感模型
[J].
Remote sensing monitoring models of soil salinization based in NDVI-SI feature space
[J].
北疆农区土壤盐渍化遥感监测及其时空特征分析
[J].
DOI:10.13249/j.cnki.sgs.2015.012.1607
[本文引用: 1]

基于MODIS数据,利用归一化植被指数和盐分指数的二维特征空间关系建立土壤盐渍化遥感监测模型,对北疆农区2000年以来的土壤盐渍化状况及其空间动态变化进行了监测分析,并探讨了典型区土壤盐渍化的主要驱动因素。结果表明:① 土壤盐渍化遥感监测指数可以从宏观上定量刻画北疆农区的土壤含盐量;② 北疆农区土壤盐渍化空间特征呈现出总体上逆转、局部严重发展的态势;③ 土壤盐渍化等级在不同时间段的发展或逆转的方向主要由中度向重度及重度向盐土间的相互转化,其中重度盐渍化农用地的转化幅度最大;④ 不同土壤盐渍化等级中盐土的形成与农区降水量和干燥程度具有较好的相关性,未盐渍化(正常)和中度盐渍化与农区有效灌溉面积和农作物播种面积分别呈相关系数较高的正相关和负相关。
Remote sensing monitoring and spatial-temporal characteristics analysis of soil salinization in agricultural area of northern Xinjiang
[J].
DOI:10.13249/j.cnki.sgs.2015.012.1607
[本文引用: 1]
The soil secondary salinization caused by brackish water irrigation and so on in agricultural area of northern Xinjiang aggravated the degree of soil salinization, severely reduced agricultural productivity level.To explore the impact of soil salinization in agricultural area of northern Xinjiang on sustainable development of agriculture, the article used the two-dimensional spatial relationship of normalized difference vegetation index and salinity index to build remote sensing monitoring model of soil salinization based on MODIS Data, and analyzed soil salinization status and the spatial dynamic changes of this area since 2000, then discussed the main driving factors of soil salinization in the typical area. The results showed: 1) Remote sensing monitoring indicators of soil salinization can quantitatively characterize soil salinity in agricultural area of northern Xinjiang from the macro. 2) The spatial characteristics of soil salinization in agricultural area of northern Xinjiang showed a reversal of the overall and local serious development situation. 3) The development or reverse direction of soil salinization levels in different periods was mainly mutual transformation of moderate to severe and severe to the saline soil, and the conversion amplitude of severe salinization agricultural land was maximum. 4)There was a good correlation between formation of saline soil with precipitation and degree of dryness and it turned on high positive and negative correlations between not salinization (normal) and moderate salinization with rural effective irrigation area and crop planting area. The research results can provide scientific basis for the prevention of soil salinization.Research conclusion provided scientific guidance basis for the prevention and treatment of soil salinization in the agricultural area of northern Xinjiang and agricultural sustainable development, and offered certain research foundation in quantitative analysis and monitoring work of large scale salinization in arid areas.
玛纳斯河流域盐渍化灌区生态环境遥感监测研究
[J].
Assessment of soil salinization ecological environment change in the Manas River basin using remote sensing technology
[J].
内蒙古河套灌区水盐运动与盐渍化防治研究展望
[J].
Soil water and salt movement and soilsalinization control in Hetao irrigation district:Current state and future prospect
[J].
基于SI-MSAVI特征空间的河套灌区盐碱化遥感监测研究
[J].
Remote sensing monitoring of salinization in Hetao irrigation district based on SI-MSAVI feature space
[J].
乌拉特前旗现代绿洲农业发展对策研究
[J].
Study on modern oasis agricultural influencing factors and its countermeasures in Wulate County
[J].
内蒙古河套灌区水资源高效利用与盐渍化调控
[J].
Effective use of water resources and salinity and waterlogging control in the Hetao irrigation area of Inner Mongolia
[J].
半干旱沙区土类/亚类的遥感调查制图方法
[J].
Method for remote sensing survey and mapping of soil types and subtypes in semi-arid sand region
[J].
Application of NOAA-AVHRR NDVI time-series data to assess changes in Saudi Arabia’s rangelands
[J].DOI:10.1080/014311601300074540 URL [本文引用: 1]
Hyperspectral reflectance response of freshwater macrophytes to salinity in a brackish subtropical marsh
[J].Coastal freshwater wetlands are threatened by increased salinity due to relative sea level rise and reduced freshwater inputs. Remote radiometric measurement of freshwater marsh canopies to detect small shifts in water column salinity would be useful for assessing salinity encroachment. We measured leaf hyperspectral (300-1100 nm) reflectance of freshwater macrophytes (cattail, Typha latifolia and sea oxeye, Borrichia frutescens) in a field study in a subtropical brackish (2.5-4.5 parts per thousand salinity, per thousand) marsh to determine salinity effects on visible and near-infrared spectral band reflectance and to identify reflectance indices sensitive to small (1 per thousand) changes in wetland salinity. For sea oxeye, floating-position water band index [fWBI = R(900)/minimum(R(930) - R(980)), where R(lambda) = reflectance at band lambda], normalized difference vegetation index [NDVI = (R(774) - R(681))/(R(774) + R(681))], and a proposed wetland salinity reflectance ratio (WSRR = R(990)/R(933)) were sensitive to salinity with R2 of 40, 35, and 65%, respectively (p < 0.01). For cattail, NDVI and photochemical reflectance index [PRI = (R(531) - R(570))/(R(570) + R(531))] were sensitive to salinity with R2 of 29 and 33%, respectively (p <or= 0.01). Higher salinity significantly reduced mean reflectance of sea oxeye in 328- to 527-nm and 600- to 700-nm wavebands (p < 0.05), which corresponded to chlorophyll bands. Reflectance of cattail was not significantly affected by the highest salinity, although the spectral band most affected was 670 nm (p < 0.10), which is a chlorophyll a band. Our findings indicate that hyperspectral radiometry can detect the response of emergent freshwater plants to changes in wetland salinity, which would help with monitoring salinity effects on coastal wetlands.
基于改进植被指数的黄河口区盐渍土盐分遥感反演
[J].
Remote sensing inversion of saline soil salinity based on modified vegetation index in estuary area of Yellow River
[J].
Assessing soil salinity using soil salinity and vegetation indices derived from IKONOS high-spatial resolution imageries: Applications in a date palm dominated region
[J].
Assessment of hydrosaline land degradation by using a simple approach of remote sensing indicators
[J].DOI:10.1016/j.agwat.2004.09.038 URL [本文引用: 1]
Characterization of slightly and moderately saline and sodic soils in irrigated agricultural land using simulated data of advanced land imaging (EO-1) sensor
[J].DOI:10.1080/00103620802432717 URL [本文引用: 1]
基于地表光谱建模的区域土壤盐渍化遥感监测研究
[J].
Remote sensing monitoring of soil salinization based on surface spectral modeling
[J].
不同盐结皮光谱特征及其盐渍化信息预测研究
[J].
Spectral characteristics and salinization information prediction of different soil salt crusts
[J].
An assessment of soil salinity and vegetation cover changes for a part of An-Najaf governorate using remote sensing data
[J].DOI:10.1088/1742-6596/1234/1/012023 URL [本文引用: 1]
Designing optimal spectral indexes for remote sensing applications
[J].
生态风险灰色评价模型及其在绿洲盐渍化农田生态系统中的应用
[J].
Gray model for ecological risk assessment and its application in salinization oasis agroecosystem
[J].
基于指示Kriging的土壤盐渍化风险与地下水环境分析
[J].
Analysis of soil salinization risk and groundwater environment based on indicator Kriging
[J].
