

0 引言
水色是人眼对悬浮颗粒物、叶绿素和可溶性有机物等多种物质组成的水体颜色最直观的感知。海洋水色是表征海洋环境的重要要素,也是鉴别水质的重要参量,它与海水的化学成分、物理性质、海洋动力状态,尤其与海水中的悬浮物和有色可溶性物质都具有极密切的关系。1890年,Forel把湖水从蓝到黄绿分成了11个等级,2 a之后德国人Willi Ule把刻度扩展了10个,颜色从绿到棕色[1]。自从这2种刻度结合以后,就成为了目前熟知的FU(Forel-Ule)色度标比色皿。1889年11月澳大利亚洪堡浮游生物探险队利用FU进行了观测记录。自此,FU色度标尺已成为测定海洋、湖泊和河流颜色的最常用、最简单的色度标尺。整个20世纪,甚至在出现了现代光谱辐射计之后,在全球范围内的观测依旧使用FU方法。它被海洋学家和湖泊专家广泛用于分类各种类型的水域。归档的FU记录是除了盐度、温度和透明度之外最古老的有关于海洋信息的记录,它包含全球各地和很久以前关于水质变化的信息,因此也包括关于叶绿素浓度的间接信息。这些记录为我们提供了对海洋和湖泊更长远的理解[1]。因此对于水色的研究及海洋生态环境有着重要的意义。
海水颜色的定量研究最早由印度物理学家Raman提出[2],经过研究发现海水的蓝色不是由于反射天空颜色所引起的,而是海水本身的一种性质。海水对长波的吸收最大,而对短波的吸收较弱,因此短波容易发生散射和折射。故对于可见光波段来说,海水对红色光的吸收率最大,对橙色光的吸收率次之,对蓝色和紫色光吸收率最小。人眼对紫光不敏感,对蓝光比较敏感,因此海水绝大多数呈现出蓝色。影响海水颜色的主要物质有3种: 叶绿素、有色可溶性有机物(colored dissolved organic matter,CDOM)和黄色物质等。由于其存在与相互作用改变了海水对光的散射与吸收,因此海水会呈现出不同的颜色。Raman的发现为水色研究从现象到机理提供了充分的理论依据[2]。
随着光谱技术和卫星遥感技术的发展,目前大多采用光谱与遥感方法进行水色观测,主要通过反演,而不是真彩色的方法得到水色组分,因此FU色度标尺在近十几年中较少使用。但该尺度具有稳定和观察结果可重复的优点[3]。过去主要的障碍在于没有建立起FU色度标尺与高光谱或遥感仪器之间的关系。Wernand等[1⇓⇓⇓-5]通过一系列的研究发展出基于色度学的水色定量表达的技术,使历史悠久的FU观测重新焕发生机,这项技术将成为水色研究的重要分支,是对水色组分研究的扩展和补充。本研究从表观光学量(apparent optical properties,AOP)和固有光学量(inherent optical properties,IOP)2个维度开展色度学研究。
1 基于AOP的色度学表达
1.1 水体颜色表达的理论基础
随着人们对于颜色的认识逐渐形成了色彩理论。为了能够定量表征颜色而发展出了色度学,色度学是一种颜色的科学测量方法或者颜色测量系统,最先由国际照明委员会(International Commission on illumination,CIE)在1931年提出,色度学被认为是科学的一个分支,涉及到用电磁光谱上辐射功率所表示的数字化的颜色,即用标准颜色来评价未知颜色的一种技术[2]。目前应用于水色研究的色彩空间包括LAB,RGB,CIE-XYZ和HSB等。
1.1.1 RGB颜色系统
RGB是目前最常见的颜色系统。RGB颜色空间基于颜色的加法混色原理,从黑色不断叠加红、绿、蓝的颜色,最终可以得到白色光。大多数扫描仪和CRT显示器的呈色空间均为RGB模式。RGB模式给彩色图像中每个像素的RGB分量分配一个从0(黑色)到255(白色)范围的强度值,虽然只是自然界中可见光的一部分,但足以在计算机上呈现千变万化的数字图像。然而,由于这种颜色模型在使用过程中受显示设备限制,造成使用不方便。为了克服这种问题,从而引入了CIE-XYZ颜色系统。
1.1.2 CIE-XYZ颜色系统
CIE根据人眼视觉特性进行了大量的颜色混合匹配实验,建立了全部光谱三刺激值即“标准色度观察者”[6],1931年CIE给出了光谱三刺激值,后根据此光谱三刺激值绘制出CIE1931标准色度系统色品图。CIE-XYZ 系统中选择了3个理想的原色X,Y和Z代替了RGB系统中的3个原色R,G和B,使得色度系统中光谱的三刺激值X,Y和Z全为正值。RGB与CIE-XYZ之间的转换关系为:
式中: X,Y和Z分别为色度坐标; R,G和B分别为红、绿、蓝原色。X,Y和Z所形成的范围将整个光谱色轨迹包含在内,经过一系列的色度坐标变换得到二维CIE-XYZ系统的色度图(图1)。
图1
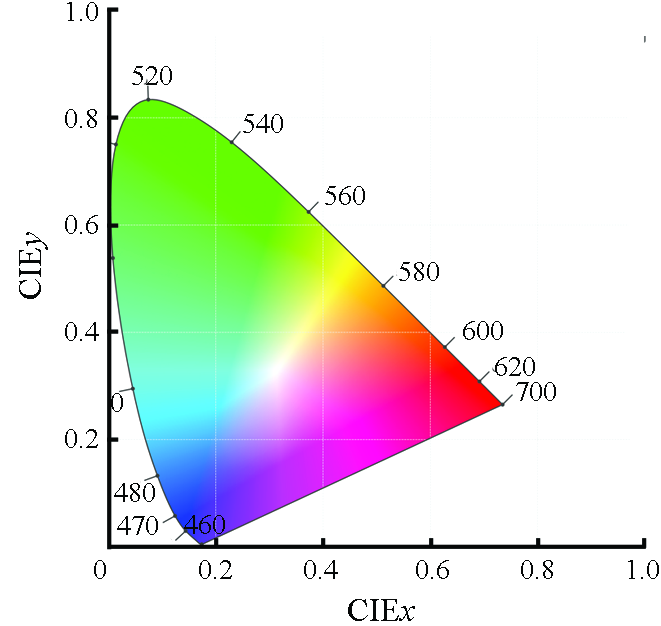
X,Y,Z是对RGB做了一层线性变换,变换后的颜色空间,使用其为三基色,且3个值都用正数去匹配所有颜色。同样,每种颜色都可以表示成X,Y,Z的混合,但不用于描述颜色,而用于说明光波如何组合会产生什么样的颜色,因此X,Y,Z是独立于设备的。X,Y,Z归一化得到色度坐标(x,y)为:
CIE1931推荐了色度标准,形成了现代的色度学基础。此后CIE不断对1931的体系进行回顾和修正,并形成一些新的色度学推荐以扩充色度学的领域和范畴,并且在我国形成了国家标准[7]。
1.1.3 HSB颜色系统
CIE色度坐标虽消除了RGB系统颜色匹配时所产生的负值,且在应用时不受任何设备限制,但无法展现颜色的亮度。而HSB模型对亮度做了定量化描述,HSB模型描述颜色的3个基本特征为: 色相H是从物体反射或透过物体传播的颜色,在0°~360°的标准色轮上,按位置度量的,通常由颜色名称标识的; 饱和度S是指颜色的强度或纯度,表示色相中灰成分所占的比例,用从0%(灰色)~100%(完全饱和)的百分比来度量; 亮度B是颜色的相对明暗程度,通常用从0%(黑)~100%(白)的百分比来度量。RGB与HSB之间的转换见文献[8]。
3种色度系统中RGB可以作为桥梁,连接起HSB和CIE这2种颜色系统,实现相互之间的转换。具体转换关系为HSB⇔RGB⇔CIE-XYZ。
1.2 基于AOP的色度学表达方法
水体颜色由水的2大光学特性AOP和IOP所决定。AOP是指随光照条件变化而变化的量,包括离水亮度Lw、归一化离水辐亮度LwN、遥感反射率Rrs以及刚好处于水面以下深度的辐照度比R(0-)等[9-10]。自然界中水体的每个波长光谱都可以通过X,Y和Z三基色刺激值组合产生,因此水体颜色由水体光谱决定。水体光谱由AOP和IOP决定,因此研究水体颜色需从AOP和IOP切入,进而深入了解水体光谱及其产生的水体颜色。Wernand等[3]通过一系列的研究证明: 光谱信息,例如物体的颜色或海洋的颜色,最终可以通过色度学计算转换和简化为2个数值,即色度坐标(x,y),从色度学坐标(x,y)再转化为色度角实现定量表达。这种转换过程通过遥感反射率Rrs实现。Woerd等[11]通过推导,得到了从Rrs到三刺激值从而得到色品值和色度角的方法。
式中:
在此基础上Wernand等[3]使用色度学方法对FU比色管进行了研究,通过分析光谱透过率曲线和相应的色度坐标值,对FU色度标尺进行了重新的评价,认为FU色度标尺及其实际应用使其成为评价天然水体颜色的一个很好的颜色比较器; Novoa等[13]在Rosen和Wernand的基础上重新配置了FU的21个色度的颜色,并重新测量了其色度坐标使之更加准确,同时还测量了FU21个色度标尺每一个色度的三刺激值。三刺激值的测定建立起了FU与人眼观察定量化的物理联系; Woerd等[11]在先前的研究基础上进一步提出了色度角的概念,色度角α是一个连续的数值变量,它用一个数字表示光谱的颜色。在自然水域,色度角范围从40°的棕色水体到235°的深蓝色大洋水体[14],即
式中: (xW,yW) 为白点坐标; modulus为取模运算。
图2
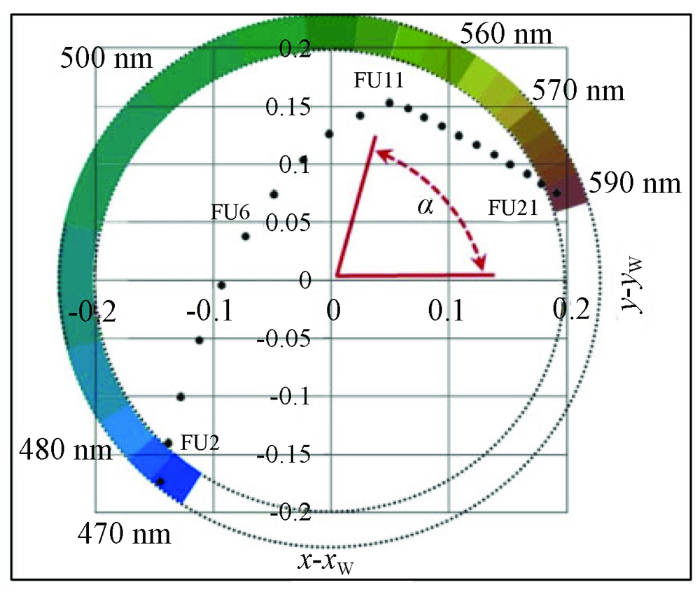
图2
色品坐标平面与色度角及FU匹配图[12]
Fig.2
A chromaticity diagram showing the hue colour angle of the FU scale colours
2 基于IOP的颜色位表达
2.1 颜色位的研究历史
19世纪末,Engelmann率先证明了光养生物可以利用光谱的特定部分。随后人们发现了许多光合色素,每种色素都有其自身的特征吸收光谱[17]。光谱的利用可以根据经典生态理论来解释,早期人们将光视作一种资源,根据生态学理论,沿光谱范围的生态位分化减少了物种之间的竞争,从而促进了物种之间的共存[18]。物种的吸收光谱差异导致沿光谱的生态位分化。Stomp等[15]研究表明红色和绿色的微蓝细菌可以通过吸收光谱的不同部分共存,还通过实地调查证实,湖泊和海洋中红色和绿色微蓝细菌的相对丰度与水下光色有关。哪些颜色可用于光养微生物?针对这个问题,Stomp等[15]从微观角度对水下光色和光养微生物的关系进行了研究,认为水分子的振动会在水下光谱中形成间隙,这为光养微生物产生了一系列独特的颜色。
2.2 颜色位的理论基础——分子振动
水分子在特定波长下能更有效地吸收光子,这些光子的能量使H2O中共价O-H键产生分子振动。表现出3种基本的振动模式: 对称拉伸、不对称拉伸和弯曲。基本的振动模式及其组合(称为谐波)在水的吸收光谱的可见光和红外部分产生了一系列的肩峰。拉伸振动的第4—8谐波分别在742 nm,605 nm,514 nm,449 nm和401 nm处被识别。
Stomp等[15]发现水及其光学成分的吸收特性在水生生态系统中产生了一系列不同的颜色。这一发现的核心是水分子本身的行为。水分子在特定的波段吸收光,这些波段与它们的拉伸和弯曲振动所需的能量相匹配。尽管在这些特定波长处的光吸收仅在纯水的吸收光谱中显示为细微的肩部,但由于光衰减的指数性质,这些细微的肩部在水下光谱中会产生较大的间隙,这些间隙之间的波段在水下光谱中定义了一系列不同的颜色位,这些独特的光谱空间与地球上主要光合色素的光吸收光谱相匹配。
2.3 颜色位的计算
式中: rn为第n个颜色位的相对可用率;
3 颜色定量表达的应用
3.1 水体卫星真彩色的实现与识别
在Landsat MSS传感器时代,就已经开始了水体颜色的监测研究。前期的一些研究主要集中在选择适当的颜色参量,并试图建立颜色与水体水质参数的关系。Alfoldi等[20]利用Landsat MSS假彩色数据,将其绿光、红光和近红外波段分别作为CIE标准色度系统中的X,Y,Z三刺激值,将图像色度坐标与水质参数联系起来,分析了Landsat MSS 假彩色数据的色调和饱和度与水体状况的关系。
Jaquet等 [21]将TM影像的红光、绿光、蓝光波段作为CIE色度系统中三刺激值,对瑞士西部和法国东部50多个湖库水体进行了色度计算,分析水体营养状态和色度坐标的关系; Sovdat等[22]利用Sentinel-2的DN值研究了CIE色彩空间与RGB空间的关系,首先通过对DN值预处理得到大气校正后反射率数据,在反射率基础上进行CIE,LAB和RGB色彩间的转换,并结合Gamma拉伸和色彩调整等方法得到真彩色图像实现了色度角与真彩色的关联; Jolliff等[23]以OLCI作为经验值对GOES-ABI数据进行了CIE到RGB的转换,得到增强的JPEG格式图像。GOESABI图像序列忠实地再现了在OLCI真彩色重建中检测到的主要颜色图案。在佛罗里达大湾地区附近的色彩重建中明显的明亮的绿松石色可表明沉积物的重新悬浮过程。
尽管上述学者对水体真彩色的实现做了诸多研究,但由于其通用性问题,一直无法在更多的探测装置上应用。直到Wernand等[4]率先研究了Forel-Ule MERIS(FUME)算法,开启了利用卫星遥感对水色定量识别的先河,通过与实地观测的FU值拟合分析,高光谱和FUME算法所反演的FU值与实测相比结果良好(R2分别为0.81和0.71)。而其后色度角方法的提出[11-12]与随之进行的多卫星遥感仪器之间比对及与IOCCG数据集和实地验证的一系列工作表明,色度角在不同仪器之间有良好的一致性,且与实测数据相比,也有着相当高的准确率,所列出的仪器与高光谱相比R2均大于0.9,这说明色度角可以统一地用于几乎所有的水色仪器。这为水色的定量识别打下了良好基础。
3.2 水体真彩色的逆转化
Novoa等[24]开发了一种算法WACODI(water color from digital images)。这种算法能将廉价相机拍摄到的数码图像用于水体的科研与监测中。具体的方法为利用相机拍摄的sRGB色彩空间通过Gamma拉伸和光源校正(如水体镜面反射等)转换成为CIE-XYZ色彩空间。不论光源与天气条件如何,利用获得的高光谱与相机图像,通过转化成CIE-XYZ坐标后对比发现,两者具有很好的一致性。在欧洲的Citclops计划中,通过WACODI算法,利用数字化的FU色度标尺和色度角,让公民只用手机和所开发的APP软件,就可以进行水色观测,这将极大地丰富了数据的来源。该计划致力于利用廉价的数码相机和手机APP,让公民参与到水环境数据资料的收集中,扩展数据的来源,用低廉的方法对水环境进行有效监测[12]。基于这项计划,实地的验证工作也有序开展[25⇓⇓-28],通过一系列的采样、对比与验证证明,在大多数天气与光照条件下,无论是内陆水体还是近岸或者是开阔大洋水体,Citclops所开发的APP都能准确获取水色信息,提供相当准确的真彩色定量表达。
尽管Citclops计划鼓励了更多公民的参与,扩展了数据来源的渠道。但由于其时空的局限性,更多对水色定量的识别还是基于卫星来实现。Wernand等[4]开启了利用卫星遥感对水色定量识别的先河; 段洪涛等[29-30]系统总结了水色遥感的历史和发展方向,从最初的水色三要素遥感为基础的水色遥感,发展到水质遥感,而后再补充和发展到水环境遥感。随着更多基于卫星的水色定量识别算法被开发,应用领域也沿着水色遥感的发展趋势和方向一起,从开阔大洋水体到近岸二类水体[31⇓⇓⇓⇓⇓⇓⇓-39],从流域水体到内陆湖泊水体及水库水体[40⇓⇓⇓⇓⇓⇓⇓⇓⇓⇓⇓-52],从一般城市水体到城市黑臭水体[53⇓-55]。总的来说从Citclops研究结果和卫星数据在不同水体的研究表明,从公民和卫星获取的数据既有优势也有局限性,而且两者间高度互补。因而水色定量识别的领域和应用范围得到了很大扩展。
3.3 气候变化定量表达因子
近年来,水体颜色被世界气象组织(World Meteorological Organization, WMO)和全球气候观测系统(Global Climate Observing System, GCOS)计划列为基本气候变量之一。欧洲航天局所提出的气候变化倡议,致力于利用卫星组成全球气候观测系统,利用卫星数据生成基本气候变量数据集。而其中的一个子项目: 海洋颜色气候变化倡议(European Space Agency Ocean Colour Climate Change Initiative, ESA-OC-CCI)旨在建立一个长期的、连续的、并带有误差评价的长时序海洋颜色数据产品[56]。随着水色定量遥感研究的深入及数据的不断累积,基于多源卫星融合的数据集ESA-OC-CCI发布问世。该数据集反映了过去20 a全球大洋的水色信息,包含了FU、色度角和塞盘深度等定量描述水色的参数。数据集中月数据的空间分辨率为4 km,目前该版本是最新发布的,采用了最新的反演技术且应用不局限于任何特定的水体类型[14,57]。
中国科学院空天信息创新研究院科研团队发布全球首套湖库遥感水色指数科学数据集,该数据集反映了全球范围千余个大型湖库在过去近20 a的水色长时间序列时空变化趋势,在这套数据集中,通过实地测量的从清澈贫营养到浑浊富营养的多种湖泊水体,将离水反射率重采样到MODIS相应的波段后计算FUI(FU index)值,一般来说卫星遥感水色产品能允许的误差范围在30%以内,而此数据集的误差率小于10%。由于该数据集采用一致的反演算法,保证了数据集在监测水体颜色变化时的稳定性[58-59]。这2套定量描述水色的数据集的发布,为全球大洋和水库水色的变化和监测提供了重要的科学数据支撑。随着人工智能的发展,利用上述数据集进行降尺度从而匹配更高分辨率数据用以衍生其用途[37],相关的研究还在不断进行中。除了标准化的数据产品之外,在Citclops计划中采用EyeOnWater APP所采集的接近5 000条全球观测的水色、透明度和荧光数据,用户可以通过门户网站European Marine Observation and Data Network (
3.4 水体成分的识别
不管是大洋一类清洁水体,还是海洋近岸、湖泊、河流二类浑浊水体,除了纯水本身外,对于自然光有吸收和散射作用的主要有浮游植物色素、非色素颗粒物和CDOM等3 种物质,一般统称为光学活性物质[29]。由于其存在与相互作用改变了水体对光的散射与吸收,因此水体会呈现出不同的颜色。水色定量识别的目的在于探究水色与水色组分的关系,从而从水色反演出水色组分的含量,进而对水体生态进行定量监测。与传统水色方法反演不同,以往利用多光谱数据获取水体中三要素浓度,难以实现精确的组分反演,因而有必要确定复杂的局部散射和吸收特性。相比之下,在色度空间内定义的FU不依赖于单个波段的信号响应,大大降低了水色计算的不确定性[43]。
3.4.1 叶绿素
但对于近岸和内陆水体而言,悬浮泥沙和黄色物质的增多,悬浮泥沙的后向散射和黄色物质的强烈吸收直接影响了海水的光学性质[62],导致反演叶绿素的工作十分复杂。尽管Boyce等[60]论证了FU数值小于等于10的范围内FU与叶绿素有着非常好的相关关系。但是这种相关关系在二类水体的研究中却存在高度不确定性。利用水色对叶绿素进行定量识别的主要思路是采用实测的FU值与叶绿素含量,通过大量样本建立统计关系,建立起FU与叶绿素含量的数学模型。Woerd等[12]为了说明色度角的意义,利用了IOCCG[63]不同叶绿素浓度下海水样本与实测样本,讨论了从低CDOM到高CDOM色度角与叶绿素浓度的对应关系。类似利用水色定量识别方法对叶绿素浓度进行反演的研究也大量开展,并取得丰硕成果。Wernand等[4]利用从1889年以来航海所记录的FU,由EcoLight辐射传输数值模型表明,在最清澈的海水(FU=1~4)中,藻类色素是光吸收的主导因素,FU指数与叶绿素浓度之间存在极显著的指数关系(R2=0.99),通过卫星遥感方式可以把这种关系拓展到全球开阔大洋使得在全球范围监测叶绿素成为可能; Busch等[26-27]在地中海西北部使用了高光谱仪、Citclops计划中的所使用的APP和 MERIS 卫星图像对比后得出,三者所反演出的色度角均在一个FU的角度范围内,即使是最大的误差也只有一个FU的差异。基于普通数码相机镜头的用于测量叶绿素-a荧光的原型装置SmartFluo被设计出来[64],用荧光方法计算叶绿素含量。通过实验室的对照试验,SmartFluo的结果与专业仪器所测得的结果高度一致(R2=0.97)。证明了手机拍摄的数码照片通过在欧洲Citclops 计划下能成为高质量海洋数据的来源。
3.4.2 其他水色组分
二类水体因其特殊性及在日常经济活动中的特殊性总受到极大的关注。除了叶绿素以外,利用水色对其他水色组分的监测也显得十分重要。叶绿素测量往往与其他水色组分的测量同时进行。利用数学模型建立起水色组分与水色的定量表达关系,实现对水色组分的识别。Pozdnyakov等[65]利用色度学方法讨论了水色组分与水色的大致关系,即在高叶绿素和悬浮有机物及低浓度CDOM水色从绿色到棕色。高浑浊或者高浓度CDOM是以棕色水色为标志。Wo
式中S为光谱颜色在色度平面上相对于白点(xW,yW)的距离。这种扩展和补充在利用高分辨率卫星监测城市小范围黑臭水体中有着重要的意义; 温爽等[53]利用GF-2卫星监测南京黑臭水体时发现,有些河段受排放污染物的影响水色差异大,出现墨绿、灰黑色等与玄武湖、莫愁湖等正常水体颜色相似,这使得利用色度学方法对黑臭水体的识别率很低,识别准确率仅有37.5%。尽管Zhao等[55]已经证明了在黑臭水体监测中色度角有良好的稳定性,但也指出其局限性。基于这些问题,杨子谦等[54]使用CIE-XYZ 颜色系统并结合GF-2影像的3个可见光波段用来定量的表征颜色,利用色度学方法同构建了适用于城市水体遥感分级的U-FUI(urban FU index)水色指数,根据水体水色信息完成城市水体的遥感分级,这极大提升了识别准确率,识别准确率达到了72%。由于黑臭水体的成分更加复杂,其水色组分的定量识别方法还在继续研究中。
3.5 水体光合作用的光适应
水的颜色变化可以改变色素组成不同的浮游植物之间的竞争性相互作用,从而利用光谱的不同部分。在CDOM浓度极低的最清澈海水中,总吸收光谱类似于纯水,在吸收光谱中可以看到PAR(photosynthetically active radiation)范围内的所有(次)谐波。在低营养化海洋典型的低CDOM浓度下,水下光谱主要由紫光和蓝光(400~500 nm)控制; 在非常高的CDOM浓度下,水下光谱主要由橙色和红光(600~700 nm)控制,水下光谱的变化进而导致光谱位的变化。CDOM和NAP(non-algal particles)都在短波波段下强烈吸收,二者浓度的变化均会引起水下光谱的变化从而改变颜色。
Holtrop等[16]以原球绿藻等蓝藻为主体研究了藻类体内色素对光谱的吸收作用,结果表明PEB/PUB/PCB/chla/chlb等藻类体内主要色素对光的吸收与5个颜色十分吻合,同时与不同纬度蓝藻的分布情况达成较好一致性。在此基础上还利用卫星数据进行了全球范围的研究,结果表明紫色谱位主导亚热带少营养海洋环流,蓝色谱位主导温带开阔海域、赤道上升流区域、黑海、地中海以及缺乏营养的湖泊; 绿色谱位主导富饶的浅海、海岸线上升流区域、波罗的海以及中富营养湖泊; 橙色和红色谱位控制富营养化和肥厚的内陆水体以及含有高浓度溶解物和碎屑物质的河口。
在温带和北方地区,由于富营养化的增加和有机质的增加,例如,湖泊的“绿化”和“褐变”[68],许多清澈的蓝色湖泊已变成浑浊的水域。浮游植物群落很可能会受到水下光谱中这些变化的影响,因为它们由不同种类的物种组成,这些物种部署了不同的光合色素和采光策略[69]。近年来,北半球许多湖泊和沿海水域的颜色发生了变化,这是由于土地利用、酸沉降和气候变化[70⇓-72]导致CDOM浓度增加所致。随着CDOM浓度的增加,水下光的颜色向更长的波长转移。约1 000个北美湖泊的研究表明[68],蓝色湖泊的数量大大减少,而黑色湖泊的数量增加,这是由于湖水的“绿化”和“褐变”。根据颜色,湖泊“褐变”意味着CDOM浓度的增加使浮游植物的光合作用从蓝色和绿色位,向橙色和红色位转变。湖泊“褐变”导致浮游植物群落结构发生重大变化,包括绿藻和硅藻的总体下降[73-74],淡水蓝藻细菌和隐藻植物的增加[75⇓-77]。这些发现得到实验[78]的进一步支持,富含PCB的蓝细菌以橙红光获胜。绿藻和硅藻的叶绿素和类胡萝卜素在紫色和蓝色生态位中有效吸收,而淡水蓝藻和隐生植物的藻蓝蛋白PEB和PCB利用绿色和橙色生态位。
Luimstra等[79]以颜色位为基础开发了一种新的资源竞争模型,使用以淡水蓝藻和绿藻为代表的浮游植物,通过单培养实验对模型进行参数化。随后进行了一系列竞争实验,结果与模型预测一致,绿藻在蓝光下更具生存竞争力,而蓝藻在红光下较易存活,而这些与该物种的初始相对丰度无关。这些结果与观察到的浮游植物群落结构响应湖泊“褐变”的变化一致。同样,在海水中,模型预测蓝光下以叶绿素为基础的采光复合物的前绿球菌占优势,而绿光则预测聚球菌与藻胆体的优势,两者之间存在广泛的共存关系。
3.6 应用于卫星遥感数据处理
式中: y(λ)为波长λ处的三刺激值; w(λ)为波长λ处CMF的权重系数。为了方便表示波长λ处的三刺激值X,Y和Z引入变量T。
由于卫星数据光谱覆盖范围有限,因此光谱首先必须通过线性插值方法进行重构。重构方法基于遥感光谱波段的遥感反射。频谱区间b1和b2之间三刺激值为T,波长L1和L2之间的三刺激值ΔT以用四边形法则近似表示(图3)。
图3
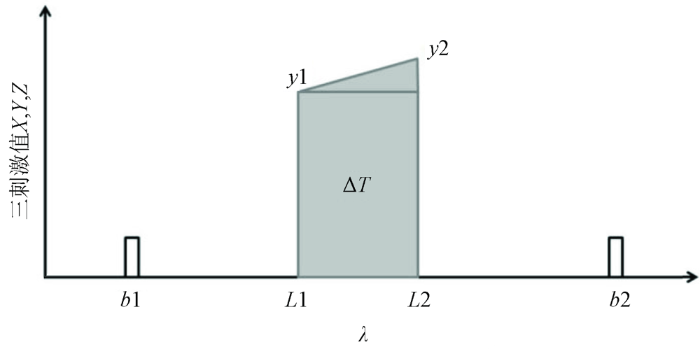
图3
位于b1和b2波段之间的频谱对三刺激值的贡献[11]
Fig.3
Contribution of a small part of the spectrum, lying between bands b1 and b2, to the tristimulus values
ΔT最终的表达式为:
式中: tL1和tL2分别为L1和L2波长处三刺激值; Rb1和Rb2分别为b1和b2处反射率。将公式(11)改写为:
公式(15)表示根据波段b1和b2可得到其反射率数值R,公式(11)改写得到公式(15)可很方便地通过测量参数计算出ΔT,这个重要的参数对于色度角精度有着不可或缺的作用。由于利用卫星反演色度角存在着系统性偏差Δ,把参数Δ定义为高光谱色度角与多光谱色度角之差,在数学上利用五次多项式进行拟合。
综上所述,利用卫星得到色度角的步骤为: ①从遥感反射率Rrs和系数计算三刺激值(X,Y,Z); ②计算色度角; ③系统偏差修正。
4 结论与展望
自利用光谱测量FU比色皿的三刺激值开始,水体颜色的色度学表达成为水色遥感领域的一个新的发展方向,因其具有抗干扰能力强、精度高、各种仪器之间可相互比较等特点,发展出广阔的应用前景[43],尤其是在与人类关系密切的二类水体监测中,不仅能够提高参数估算精度,而且能一定程度上避免因反演模型的区域性、时相性特征从而难以推广的问题[80]。在水色(FU)和卫星遥感的真彩色再现、水体成分的间接表达等方面已取得了一定的研究成果,但水色作为表观光学量,其与固有光学量、水色组分、水质参数的关系的研究还有待于继续深化,水色作为基本气候变量之一与气候变化的关系及其机制的研究也尚不清楚。对我国而言,已有学者开展这方面的工作,但广度和深度有待加大,同时在国产卫星的应用上仅有高分系列卫星的少量研究,更多如风云系列卫星等的研究尚处于空白状态。
首先,应加强水体生物-光学数据集的建设,除了传统的光谱测量和卫星遥感数据外,还应加强已有数据集诸如ESA-OC-CCI的验证和使用。新技术的出现,如利用人工智能方法对数据降尺度、升尺度使用、高光谱卫星影像和高光谱无人机的出现将为数据获取和应用提供新的途径。
其次,开展我国水体的色度学方法研究,应从固有和表观光学量2个维度开展,了解和掌握我国内陆和近岸水体的色度学特征。目前的色度学研究还比较分散,并未形成全面、业务化的体系。此外多数研究也仅基于表观光学量与水色组分、水质参数的关系,而水色与固有光学量的研究几乎没有。
第三,加强色度学方法在国产卫星数据上的应用,拓展卫星产品类型。目前国内仅使用高分系列卫星,利用色度学方法对内陆水体进行了初步的研究。但是更多国产卫星在色度学的应用方面还属空白。此外色度学产品目前也仅有FU、色度角和塞盘深度3种,且时空分辨率较低。还不能满足日益多样化和精细化的产品需求。因此,需要从深度和广度方面下手,利用更多国产卫星数据,拓展更多水色产品。
参考文献
A centuries-long history of participatory science in optical oceanography:From observation to interpretation of natural water colouring
[J].
Spectral analysis of the Forel-Ule ocean colour comparator scale
[J].
MERIS-based ocean colour classification with the discrete Forel-Ule scale
[J].
DOI:10.5194/os-9-477-2013
URL
[本文引用: 5]

. Multispectral information from satellite borne ocean colour sensors is at present used to characterize natural waters via the retrieval of concentrations of the three dominant optical constituents; pigments of phytoplankton, non-algal particles and coloured dissolved organic matter. A limitation of this approach is that accurate retrieval of these constituents requires detailed local knowledge of the specific absorption and scattering properties. In addition, the retrieval algorithms generally use only a limited part of the collected spectral information. In this paper we present an additional new algorithm that has the merit of using the full spectral information in the visible domain to characterize natural waters in a simple and globally valid way. This Forel–Ule MERIS (FUME) algorithm converts the normalized multiband reflectance information into a discrete set of numbers using uniform colourimetric functions. The Forel–Ule (FU) scale is a sea colour comparator scale that has been developed to cover all possible natural sea colours, ranging from indigo blue (the open ocean) to brownish-green (coastal water) and even brown (humic-acid dominated) waters. Data using this scale have been collected since the late nineteenth century, and therefore, this algorithm creates the possibility to compare historic ocean colour data with present-day satellite ocean colour observations. The FUME algorithm was tested by transforming a number of MERIS satellite images into Forel–Ule colour index images and comparing in situ observed FU numbers with FU numbers modelled from in situ radiometer measurements. Similar patterns and FU numbers were observed when comparing MERIS ocean colour distribution maps with ground truth Forel–Ule observations. The FU numbers modelled from in situ radiometer measurements showed a good correlation with observed FU numbers (R2 = 0.81 when full spectra are used and R2 = 0.71 when MERIS bands are used).\n
Trends in ocean colour and chlorophyll concentration from 1889 to present
[J].
A critical review of the development of the CIE1931 RGB color-matching functions
[J].DOI:10.1002/(ISSN)1520-6378 URL [本文引用: 1]
海洋光谱测量与数据分析处理方法
[J].
Method of oceanic spectral data measurement and analysis
[J].
水体光谱测量与分析Ⅰ:水面以上测量法
[J].
The methods of water spectra measurement and analysis Ⅰ:Above-water method
[J].
True colour classification of natural waters with medium-spectral resolution satellites:SeaWiFS,MODIS,MERIS and OLCI
[J].DOI:10.3390/s151025663 URL [本文引用: 7]
Hue-angle product for low to medium spatial resolution optical satellite sensors
[J].DOI:10.3390/rs10020180 URL [本文引用: 7]
The Forel-Ule scale revisited spectrally:Preparation protocol,transmission measurements and chromaticity
[J].
Global maps of Forel-Ule index,hue angle and Secchi disk depth derived from twenty-one years of monthly ESA-OC-CCI data
[J].
Colorful niches of phototrophic microorganisms shaped by vibrations of the water molecule
[J].DOI:10.1038/ismej.2007.59 [本文引用: 5]
Vibrational modes of water predict spectral niches for photosynthesis in lakes and oceans
[J].
DOI:10.1038/s41559-020-01330-x
PMID:33168993
[本文引用: 3]
Stretching and bending vibrations of water molecules absorb photons of specific wavelengths, a phenomenon that constrains light energy available for aquatic photosynthesis. Previous work suggested that these absorption properties of water create a series of spectral niches but the theory was still too simplified to enable prediction of the spectral niches in real aquatic ecosystems. Here, we show with a state-of-the-art radiative transfer model that the vibrational modes of the water molecule delineate five spectral niches, in the violet, blue, green, orange and red parts of the spectrum. These five niches are effectively captured by chlorophylls and phycobilin pigments of cyanobacteria and their eukaryotic descendants. Global distributions of the spectral niches are predicted by satellite remote sensing and validated with observed large-scale distribution patterns of cyanobacterial pigment types. Our findings provide an elegant explanation for the biogeographical distributions of photosynthetic pigments across the lakes and oceans of our planet.
Disruptive selection and then what?
[J].Disruptive selection occurs when extreme phenotypes have a fitness advantage over more intermediate phenotypes. The phenomenon is particularly interesting when selection keeps a population in a disruptive regime. This can lead to increased phenotypic variation while disruptive selection itself is diminished or eliminated. Here, we review processes that increase phenotypic variation in response to disruptive selection and discuss some of the possible outcomes, such as sympatric species pairs, sexual dimorphisms, phenotypic plasticity and altered community assemblages. We also identify factors influencing the likelihoods of these different outcomes.
Optical properties and color of Lake Tahoe and crater lake
[J].DOI:10.4319/lo.1973.18.2.0189 URL [本文引用: 1]
Water quality analysis by digital chromaticity mapping of Landsat data
[J].DOI:10.1080/07038992.1978.10854974 URL [本文引用: 1]
Colour analysis of inland waters using Landsat TM data
[J].
Natural color representation of Sentinel-2 data
[J].
Observing the ocean submesoscale with enhanced-color GOES-ABI visible band data
[J].
DOI:10.3390/s19010001
URL
[本文引用: 1]
The new Internet of Things/Everything (IoT/IoE) paradigm and architecture allows one to rethink the way Smart City infrastructures are designed and managed, but on the other hand, a number of problems have to be solved. In terms of mobility the cities that embrace the sensoring era can take advantage of this disruptive technology to improve the quality of life of their citizens, also thanks to the rationalization in the use of their resources. In Sii-Mobility, a national smart city project on mobility and transportation, a flexible platform has been designed and here, in this paper, is presented. It permits one to set up heterogeneous and complex scenarios that integrate sensors/actuators as IoT/IoE in an overall Big Data, Machine Learning and Data Analytics scenario. A detailed and complex case-study has been presented to validate the solution in the context of a system that dynamically reverse the traveling direction of a road segment, with all the safety conditions in place. This case study composes several building blocks of the IoT platform, which demonstrate that a flexible and dynamic set-up is possible, supporting security, safety, local, cloud and mixed solutions.
WACODI:A generic algorithm to derive the intrinsic color of natural waters from digital images
[J].DOI:10.1002/lom3.v13.12 URL [本文引用: 1]
The modern Forel-Ule scale:A “Do-it-yourself” colour comparator for water monitoring
[J].
Citizens and satellites:Assessment of phytoplankton dynamics in a NW Mediterranean aquaculture zone
[J].
Citizen bio-optical observations from coast-and ocean and their compatibility with ocean colour satellite measurements
[J].DOI:10.3390/rs8110879 URL [本文引用: 2]
An evaluation of citizen science smartphone APPs for inland water quality assessment
[J].
DOI:10.3390/rs12010001
URL
[本文引用: 2]
In remote sensing for archaeology, an unequivocal method capable of automatic detection of archaeological features still does not exists. Applications of Synthetic Aperture Radar (SAR) remote sensing for archaeology mainly focus on high spatial resolution SAR sensors, which allow the recognition of structures of small dimension and give information of the surface topography of sites. In this study we investigated the potential of combined dual and fully polarized SAR data and performed polarimetric multi-frequency and multi-incidence angle analysis of C-band Sentinel-1, L-band Advanced Land Observing Satellite Phased Array type L-band Synthetic Aperture Radar (ALOS PALSAR) and of C-band Radar Satellite-2 (RADARSAT-2) datasets for the detection of surface and subsurface archaeological structures over the United Nations Educational, Scientific and Cultural Organization (UNESCO) site of Gebel Barkal (Sudan). While PALSAR offers a good historical reference, Sentinel-1 time series provide recent and systematic monitoring opportunities. RADARSAT-2 polarimetric data have been specifically acquired in 2012/2013, and have been scheduled to achieve a multi-temporal observation of the archaeological area under study. This work demonstrated how to exploit a complex but significant dataset composed of SAR full polarimetric and dual polarimetric acquisitions, with the purpose of identifying the most suitable earth observation technique for the preservation and identification of archaeological features. The scientific potential of the illustrated analysis fits perfectly with the current delicate needs of cultural heritage; such analysis demonstrates how multi-temporal and multi-data cultural heritage monitoring can be applied not only for documentation purposes, but can be addressed especially to those areas exposed to threats of different nature that require a constant and prompt intervention plans.
流域水环境遥感研究进展与思考
[J].
DOI:10.18306/dlkxjz.2019.08.007
[本文引用: 2]
卫星遥感作为一种先进的水环境监测技术手段,可以监测现状,掌握现有情况;也可以追溯过去,揭示变化规律;同时还可以结合动力模型,模拟未来。这为人类了解、掌握和管理流域水环境变化发挥不可替代的作用。特别是近10 a已经进入“高分卫星时代”,卫星传感器的空间分辨率越来越高,可观测的参数越来越多,反演和估算精度越来越高。但是,目前还缺乏从流域角度阐述水环境遥感的相关综述文章。论文围绕“流域水环境遥感”研究主题,明确了研究的对象和范围,厘清了基本理论框架,并结合大家关注的问题,包括卫星数据源、水环境模型、富营养化湖泊藻类富集、水生植被退化、水面积变化等方面的研究进展和存在的问题进行了回顾和梳理;并指出在全球变暖和人类活动加剧背景下,未来需要研发专门面向流域水环境的天-空-地立体观测体系和系统框架,开展全流域统筹的水环境遥感监测和模拟,同时加强流域水体碳循环遥感研究。
Progress in remote sensing of aquatic environments at the watershed scale
[J].
DOI:10.18306/dlkxjz.2019.08.007
[本文引用: 2]
Since ancient times, humans have lived near water, depending on water for survival and progress. There is a close link between the environmental quality of a lake or river basin and human activity, with the role of their ecological services being of vital importance to local communities. As an advanced technology, satellite remote sensing can monitor the spatial dynamics of the current situation, as well as look back to determine the temporal dynamics of aquatic environments. This allows, when combined with modeling, the possibility to project the future situation in order to improve planning and environmental management. Remote sensing can play an irreplaceable role for humans to understand, monitor, and manage basin environments for the present and future generations. This article focuses on the remote sensing of lake and river basins, exploring different research objectives, addressing the basic theoretical framework, analyzing the state-of-the-art in Chinese and international research programs, and pointing to priorities for future development.
湖泊遥感研究进展与展望
[J].
Review of lake remote sensing research
[J].
Classifying natural waters with the Forel-Ule colour index system:Results,applications,correlations and crowdsourcing
[J].DOI:10.3390/ijerph121215044 URL [本文引用: 1]
Physical,bio-optical state and correlations in North-Western European Shelf Seas
[J].DOI:10.3390/rs6065042 URL [本文引用: 2]
True color analysis of natural waters with SeaWiFS,MODIS,MERIS and OLCI by SNAP
[C]//
Optical properties of Forel-Ule water types deduced from 15 years of global satellite ocean color observations
[J].
A flood of information:Using Sentinel-3 water colour products to assure continuity in the monitoring of water quality trends in the Great Barrier Reef (Australia)
[J].
An evaluation of apparent color of seawater based on the in-situ and satellite-derived Forel-Ule color scale
[J].
Spatial downscaling of ocean colour-climate change initiative (OC-CCI) Forel-Ule index using GOCI satellite image and machine learning technique
[J].
MODIS-based research on Secchi disk depth using an improved Semianalytical algorithm in the Yellow Sea
[J].
An improved eutrophication assessment algorithm of estuaries and coastal waters in Liaodong Bay
[J].
DOI:10.3390/rs13193866
URL
[本文引用: 1]
The Geostationary Lightning Mapper (GLM) on the Geostationary Operational Environmental Satellite 16 (GOES-16) detects total lightning continuously, with a high spatial resolution and detection efficiency. Coincident data from the GLM and the Advanced Baseline Imager (ABI) are used to explore the correlation between the cloud top properties and flash activity across the continental United States (CONUS) sector from May to September 2020. A large number of collocated infrared (IR) brightness temperature (TBB), cloud top height (CTH) and lightning data provides robust statistics. Overall, the likelihood of lightning occurrence and high flash density is higher if the TBB is colder than 225 K. The higher CTH is observed to be correlated with a larger flash rate, a smaller flash size, stronger updraft, and larger optical energy. Furthermore, the cloud top updraft velocity (w) is estimated based on the decreasing rate of TBB, but it is smaller than the updraft velocity of the convective core. As a result, the relationship between CTH and lightning flash rate is investigated independently of w over the continental, oceanic and coastal regimes in the tropics and mid-latitudes. When the CTH is higher than 12 km, the flash rates of oceanic lightning are 38% smaller than those of both coastal and continental lightning. In addition, it should be noted that more studies are necessary to examine why the oceanic lightning with low clouds (CTH < 8 km) has higher flash rates than lightning over land and coast. Finally, the exponents of derived power relationship between CTH and lightning flash rate are smaller than four, which is underestimated due to the GLM detection efficiency and the difference between IR CTH and 20 dBZ CTH. The results from combining the ABI and GLM products suggest that merging multiple satellite datasets could benefit both lightning activity and parameterization studies, although the parallax corrections should be considered.
MODIS-based radiometric color extraction and classification of inland water with the Forel-Ule scale:A case study of Lake Taihu
[J].DOI:10.1109/JSTARS.4609443 URL [本文引用: 2]
MODIS observations of water color of the largest 10 lakes in China between 2000 and 2012
[J].DOI:10.1080/17538947.2016.1139637 URL [本文引用: 2]
Trophic state assessment of global inland waters using a MODIS-derived Forel-Ule index
[J].
Colour classification of 1 486 lakes across a wide range of optical water types
[J].
DOI:10.3390/rs10081273
URL
[本文引用: 2]
Remote sensing by satellite-borne sensors presents a significant opportunity to enhance the spatio-temporal coverage of environmental monitoring programmes for lakes, but the estimation of classic water quality attributes from inland water bodies has not reached operational status due to the difficulty of discerning the spectral signatures of optically active water constituents. Determination of water colour, as perceived by the human eye, does not require knowledge of inherent optical properties and therefore represents a generally applicable remotely-sensed water quality attribute. In this paper, we implemented a recent algorithm for the retrieval of colour parameters (hue angle, dominant wavelength) and derived a new correction for colour purity to account for the spectral bandpass of the Landsat 8 Operational Land Imager (OLI). We used this algorithm to calculate water colour on almost 45,000 observations over four years from 1486 lakes from a diverse range of optical water types in New Zealand. We show that the most prevalent lake colours are yellow-orange and blue, respectively, while green observations are comparatively rare. About 40% of the study lakes show transitions between colours at a range of time scales, including seasonal. A preliminary exploratory analysis suggests that both geo-physical and anthropogenic factors, such as catchment land use, provide environmental control of lake colour and are promising avenues for future analysis.
Remote sensing observations of ocean colour using the traditional Forel-Ule scale
[J].
Changes of water clarity in large lakes and reservoirs across China observed from long-term MODIS
[J].
Eutrophication assessment of seasonal urban lakes in China Yangtze River basin using Landsat8-derived Forel-Ule index:A six-year (2013—2018) observation
[J].
基于FUI模型的柬埔寨洞里萨湖水体颜色研究
[J].
Study on water color of Tonle Sap Lake in Cambodia based on FUI model
[J].
基于MODIS数据的全国144个重点湖库营养状态监测:以2018年夏季为例
[J].
MODIS-based monitoring of spatial distribution of trophic status in 144 key lakes and reservoirs of China in summer of 2018
[J].DOI:10.18307/2021.0203 URL [本文引用: 1]
基于高分影像的城市黑臭水体遥感识别:以南京为例
[J].
Remote sensing identification of urban black-odor water bodies based on high-resolution images:A case study in Nanjing
[J].DOI:10.1021/es048902d URL [本文引用: 2]
基于高分影像的城市水体遥感综合分级方法
[J].
A comprehensive classification method of urban water by remote sensing based on high-resolution images
[J].
Recognition of water colour anomaly by using hue angle and Sentinel 2 image
[J].
DOI:10.3390/rs12040716
URL
[本文引用: 2]
As polluted water bodies are often small in area and widely distributed, performing artificial field screening is difficult; however, remote-sensing-based screening has the advantages of being rapid, large-scale, and dynamic. Polluted water bodies often show anomalous water colours, such as black, grey, and red. Therefore, the large-scale recognition of suspected polluted water bodies through high-resolution remote-sensing images and water colour can improve the screening efficiency and narrow the screening scope. However, few studies have been conducted on such kinds of water bodies. The hue angle of a water body is a parameter used to describe colour in the International Commission on Illumination (CIE) colour space. Based on the measured data, the water body with a hue angle greater than 230.958° is defined as a water colour anomaly, which is recognised based on the Sentinel-2 image through the threshold set in this study. The results showed that the hue angle of the water body was extracted from the Sentinel-2 image, and the accuracy of the hue angle calculated by the in situ remote-sensing reflectance Rrs (λ) was evaluated, where the root mean square error (RMSE) and mean relative error (MRE) were 4.397° and 1.744%, respectively, proving that this method is feasible. The hue angle was calculated for a water colour anomaly and a general water body in Qiqihar. The water body was regarded as a water colour anomaly when the hue angle was >230.958° and as a general water body when the hue angle was ≤230.958°. High-quality Sentinel-2 images of Qiqihar taken from May 2016 to August 2019 were chosen, and the position of the water body remained unchanged; there was no error or omission, and the hue angle of the water colour anomaly changed obviously, indicating that this method had good stability. Additionally, the method proposed is only suitable for optical deep water, not for optical shallow water. When this method was applied to Xiong’an New Area, the results showed good recognition accuracy, demonstrating good universality of this method. In this study, taking Qiqihar as an example, a surface survey experiment was conducted from October 14 to 15, 2018, and the measured data of six general and four anomalous water sample points were obtained, including water quality terms such as Rrs (λ), transparency, water colour, water temperature, and turbidity.
Ocean colour climate change initiative:Approach and initial results
[C]//
Ocean colour climate change initiative (OC_CCI)-interim phase
[R].
长时序大范围内陆水体光学遥感研究进展
[J].
Recent research progress on long time series and large scale optical remote sensing of inland water
[J].
A dataset of remote-sensed Forel-Ule index for global inland waters during 2000—2018
[J].
DOI:10.1038/s41597-020-00786-7
[本文引用: 1]
Satellite altimetry missions provide a quasi-global synoptic view of sea level variations over more than 25 years and provide regional sea level (SL) indicators such as trends and accelerations. Estimating realistic uncertainties on these quantities is crucial to address current climate science questions. While uncertainty estimates are available for the global mean sea level (GMSL), information is not available at local scales so far. We estimate a local satellite altimetry error budget and use it to derive local error variance-covariance matrices, and estimate confidence intervals on trends and accelerations at the 90% confidence level. Over 1993–2019, we find that the average local sea level trend uncertainty is 0.83 mm.yr−1 with values ranging from 0.78 to 1.22 mm.yr−1. For accelerations, uncertainties range from 0.057 to 0.12 mm.yr−1, with a mean value of 0.062. We also perform a sensitivity study to investigate a range of plausible error budgets. Local error levels, error variance-covariance matrices, SL trends and accelerations, along with corresponding uncertainties are provided.
Integrating global chlorophyll data from 1890 to 2010
[J].
Ocean colour signature of climate change
[J].
DOI:10.1038/s41467-018-07882-8
[本文引用: 1]
Wave-particle duality is an inherent peculiarity of the quantum world. The double-slit experiment has been frequently used for understanding different aspects of this fundamental concept. The occurrence of interference rests on the lack of which-way information and on the absence of decoherence mechanisms, which could scramble the wave fronts. Here, we report on the observation of two-center interference in the molecular-frame photoelectron momentum distribution upon ionization of the neon dimer by a strong laser field. Postselection of ions, which are measured in coincidence with electrons, allows choosing the symmetry of the residual ion, leading to observation of both, gerade and ungerade, types of interference.
叶绿素a荧光遥感研究进展
[J].
Process in fluorescence remote sensing of chlorophy-a
[J].
Remote sensing of inherent optical properties:Fundamentals,tests of algorithms,and applications
[R].
SmartFluo:A method and affordable adapter to measure chlorophyll a fluorescence with smartphones
[J].DOI:10.3390/s17040678 URL [本文引用: 1]
Numerical modelling of natural water colour:Implications for remote sensing and limnological studies
[J].DOI:10.1080/014311698215063 URL [本文引用: 1]
Modelling water colour characteristics in an optically complex nearshore environment in the Baltic Sea:Quantitative interpretation of the Forel-Ule scale and algorithms for the remote estimation of seawater composition
[J].
IEEE Conference on Computer Vision and Pattern Recognition.
[J].DOI:10.1016/S0380-1330(97)70910-9 URL [本文引用: 1]
Fewer blue lakes and more murky lakes across the continental US:Implications for planktonic food webs
[J].
DOI:10.1002/lno.10967
PMID:31942083
[本文引用: 2]
Elevated allochthonous inputs of organic matter are increasingly recognized as a driver of ecosystem change in lakes, particularly when concurrent with eutrophication. Evaluation of lakes in a nutrient-color paradigm (i.e., based on total phosphorus and true color) enables a more robust approach to research and management. To assess temporal and spatial patterns in nutrient-color status for U.S. lakes and associated food web attributes, we analyzed the U.S. Environmental Protection Agency's National Lakes Assessment (NLA) data. With 1000+ lakes sampled in 2007 and 2012 in a stratified random sampling design, the NLA enables rigorous assessment of lake condition across the continental U.S. We demonstrate that many U.S. lakes are simultaneously experiencing eutrophication and brownification to produce an abundance of "murky" lakes. Overall, "blue" lakes decreased by ~ 18% (46% of lakes in 2007 to 28% in 2012) while "murky" lakes increased by almost 12% (24% of lakes in 2007 to 35.4% in 2012). No statistical differences were observed in the proportions of "green" or "brown" lakes. Regionally, murky lakes significantly increased in the Northern Appalachian, Southern Plains, and Xeric ecoregions. Murky lakes exhibited the highest epilimnetic chlorophyll concentrations, cyanobacterial densities, and microcystin concentrations. Total zooplankton biomass was also highest in murky lakes, primarily due to increased rotifer and copepod biomass. However, zooplankton : phytoplankton biomass ratios were low, suggesting reduced energy transfer to higher trophic levels. These results emphasize that many lakes in the U.S. are simultaneously "greening" and "browning", with potentially negative consequences for water quality and food web structure.
Cyanobacterial photosynthesis in the oceans:The origins and significance of divergent light-harvesting strategies
[J].DOI:10.1016/S0966-842X(02)02319-3 URL [本文引用: 1]
Natural strategies for photosynthetic light harvesting
[J].
DOI:10.1038/nchembio.1555
PMID:24937067
[本文引用: 1]
Photosynthetic organisms are crucial for life on Earth as they provide food and oxygen and are at the basis of most energy resources. They have a large variety of light-harvesting strategies that allow them to live nearly everywhere where sunlight can penetrate. They have adapted their pigmentation to the spectral composition of light in their habitat, they acclimate to slowly varying light intensities and they rapidly respond to fast changes in light quality and quantity. This is particularly important for oxygen-producing organisms because an overdose of light in combination with oxygen can be lethal. Rapid progress is being made in understanding how different organisms maximize light harvesting and minimize deleterious effects. Here we summarize the latest findings and explain the main design principles used in nature. The available knowledge can be used for optimizing light harvesting in both natural and artificial photosynthesis to improve light-driven production processes.
Dissolved organic carbon trends resulting from changes in atmospheric deposition chemistry
[J].DOI:10.1038/nature06316 [本文引用: 1]
Sensitivity of freshwaters to browning in response to future climate change
[J].DOI:10.1007/s10584-015-1514-z URL [本文引用: 1]
Centennial-long trends of lake browning show major effect of afforestation
[J].DOI:10.1002/lol2.v2.4 URL [本文引用: 1]
Phytoplankton diversity loss along a gradient of future warming and brownification in freshwater mesocosms
[J].
Primary producers or consumers? Increasing phytoplankton bacterivory along a gradient of lake warming and browning
[J].
Effects of brownification and warming on algal blooms,metabolism and higher trophic levels in productive shallow lake mesocosms
[J].
DOI:10.1016/j.scitotenv.2019.04.105
[本文引用: 1]
An increase of dissolved organic carbon (DOC) in inland waters has been reported across the northern temperate region but the effects of this on whole lake ecosystems, often combined with other anthropogenic stressors like nutrient inputs and warming, are poorly known. The effects of these changes on different component of the ecosystem were assessed in an experiment using twenty-four large (30001) outdoor mesocosms simulating shallow lakes. Two different temperature regimes (ambient and ambient +4 degrees C) combined with three levels of organic matter (OM, added as filtered peaty water), simulating the DOC increase that is predicted to take place over the next 4 to 21 years were used. Neither temperature nor OM had significant effects on net ecosystem production, respiration or gross primary production. Phytoplankton chlorophyll a concentration was not significantly affected by warming, however in summer, autumn and winter it was significantly higher in mesocosms receiving intermediate OM levels (July-Feb DOC concentrations 2-6 mg L-1). Summer cyanobacterial blooms were highest in intermediate, and lowest in the highest OM treatments. OM concentration also influenced total macroinvertebrate abundance which was greater in spring and summer in mesocosms with intermediate and high OM. Fish abundance was not significantly affected by OM concentration, but abundance was greater in ambient (55 fish subsample(-1)) compared to heated mesocosms (17 fish subsample(-1)) and maximum abundance occurred two weeks later compared to heated mesocosms. The results suggest that changes in OM may have a greater effect on shallow lakes than temperature and that phytoplankton, especially cyanobacteria. benefit from intermediate OM concentrations, therefore, nuisance algal blooms might increase in relatively clear shallow eutrophic lakes where DOC concentrations increase. (C) 2019 Elsevier B.V.
Phytoplankton response to whole lake inorganic N fertilization along a gradient in dissolved organic carbon
[J].
DOI:10.1002/ecy.1758
PMID:28144934
[本文引用: 1]
Global change has increased inorganic nitrogen (N) and dissolved organic carbon (DOC; i.e., "browning") inputs to northern hemisphere boreal lakes. However, we do not know how phytoplankton in nutrient poor lake ecosystems of different DOC concentration respond to increased N availability. Here, we monitored changes in phytoplankton production, biomass and community composition in response to whole lake inorganic N fertilization in six boreal unproductive Swedish lakes divided into three lake pairs (control, N enriched) at three DOC levels (low, medium, high), with one reference year (2011) and 2 impact yr (2012, 2013). We found that phytoplankton biomass and production decreased with DOC concentration before N fertilization. Further, phytoplankton community composition also differed with respect to DOC, with a dominance of non-flagellated autotrophs at low DOC towards an increasing dominance of flagellated autotrophs with increased lake DOC concentration. The N fertilization increased phytoplankton biomass and production in all lakes, but did not affect phytoplankton community composition. However, the net response in biomass and production to N fertilization declined with increasing DOC, implying that the lake DOC concentration is critical in order to infer phytoplankton responses to N fertilization, and that the system switches from being primarily nutrient limited to becoming increasingly light limited with increased DOC concentration. In conclusion, our results show that browning will reduce phytoplankton production and biomass and influence phytoplankton community composition, whereas increased inorganic N loadings from deposition, forestry or other land use will primarily enhance phytoplankton biomass and production. Together, any change in the landscape that enhances inorganic N availability will increase phytoplankton production and biomass, but the positive effects of N will be much weaker or even neutralized in browner lakes as caused by light limitation.© 2017 by the Ecological Society of America.
Effects of light color on interspecific competition between microcystis aeruginosa and chlorella pyrenoidosa in batch experiment
[J].DOI:10.1007/s11356-019-06650-5 [本文引用: 1]
Changes in water color shift competition between phytoplankton species with contrasting light-harvesting strategies
[J].
基于水体光学分类的二类水体水环境参数遥感监测进展
[J].
Research progress of remote sensing monitoring of case II water environmental parameters based on water optical classification
[J].
