

0 引言
乌兰布和沙漠东北缘区域紧挨着乌兰布和灌区,是内蒙古河套灌区的主要组成之一[7],属于干旱半干旱地区,是我国荒漠化治理的重要领域,同时对国家粮食安全有着重要保障作用[8]。本研究拟对乌兰布和沙漠东北缘近30 a的生态承载力进行评价分析,以往对于该区域生态承载力的研究多是采用生态足迹法,杨超[9]通过生态足迹法对该区域生态承载力进行分析,进而评价当地的荒漠化产业状况; 张景波等[10]采用生态足迹法对该区域的生态承载力进行动态研究,确定土地结构的最优化配置; 刘明虎等[11]采用生态足迹法通过对该地区水资源生态承载力进行研究,但该方法具有一定局限性,反映的土地功能是单一性的,参数因子的选取不具有真实性。本文拟基于优化后的综合评价模型进行生态承载力评价,并针对其干旱半干旱和灌区特性进行驱动机制研究。
1 研究区概况
研究区位于乌兰布和沙漠东北缘,包括河套灌区和黄河两岸的荒漠化区域,涉及阿拉善左旗、磴口县、乌拉特后旗、杭锦后旗、临河区、乌拉特中旗、五原县、乌拉特前旗、杭锦旗、鄂托克旗和海勃湾区共11个行政区域,如图1所示,地理位置在N39°40'~41°00',E106°00'~107°20'之间[12],北靠狼山,西邻乌兰布和沙漠,东接河套平原[13],总体处于半干旱区向干旱区过渡地带,面积约3.68 km2,平均海拔在1 041 m左右,全年盛行西北风,瞬时风速最高可达3.7 m/s[14],昼夜温差较大,年平均气温在7.8 ℃左右,降雨量较少,年均降雨量为140 mm左右,年均蒸发量为2 096.4 mm[15]。研究区的植被主要是以灌木、半灌木为主,包括梭梭、白刺和盐爪爪等旱生植物,地区水源供给以黄河为主[16],黄河以西耕地较多,黄河以东则为大面积荒漠化区域,是荒漠化治理的重点区域之一。
图1
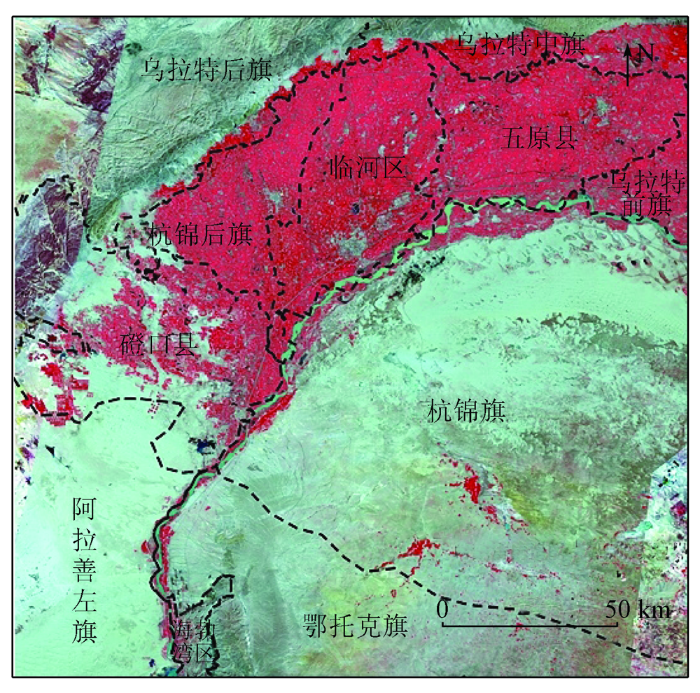
图1
研究区2020年影像以及地理位置分布
(B3(R), B2(G), B1(B)波段合成影像)
Fig.1
Image in 2020 and geographical location distribution of the study area
2 数据源及预处理
2.1 数据源
覆盖研究区1990年、2000年、2010年和2020年4个时期的Landsat遥感影像数据是通过欧空局官网下载,均为7—9月份时期的影像。净初级生产力与潜在蒸散发一部分来自于MODIS数据,一部分来自于国家地球系统科学数据中心,降雨和温度数据均来自于国家地球系统科学数据中心,土地利用数据基于Landsat影像采用监督分类方法获得(表1)。
表1 各数据类型的获取来源以及信息
Tab.1
| 数据类型 | 单位 | 数据来源 |
|---|---|---|
| 净初级生产力 | g·C/m2 | 1990年的数据来自于“国家地球系统科学数据中心”提供的全球5 km 8 d总、净初级生产力产品; 2000年、2010年和2020年的数据来自于MOD17A3数据,空间分辨率为500 m,时间分辨率为1 a |
| 潜在蒸散发 | 0.1 mm | 1990年、2000年和2010年的数据来自于“国家地球系统科学数据中心”提供的中国1 km逐月潜在蒸散发数据集; 2020年的数据来自于MOD16A2数据,空间分辨率为500 m,时间分辨率为8 d |
| 温度 | 0.1 ℃ | 1990年、2000年、2010年和2020年的数据均来自于“国家地球系统科学数据中心”提供的中国1 km 逐月平均气温数据集 |
| 降雨 | 0.1 mm | 1990年、2000年、2010年和2020年的数据均来自于“国家地球系统科学数据中心”提供的中国1 km 逐月降水量数据集 |
| 土地利用数据 | — | 1990年、2000年、2010年和2020年的土地利用数据均基于Landsat遥感影像数据采用监督分类的方法获取 |
2.2 数据处理
研究区遥感影像都是通过多幅影像镶嵌和裁剪获得,其中部分影像有云雾遮挡,用同时期间隔不超过一个月的影像做替换,最终获得质量较好的4期影像,图1底图即为2020年的研究区影像。净初级生产力、潜在蒸散发、温度和降雨在4个时期的时间分辨率和空间分辨率不一致,先通过镶嵌、投影、重采样和裁剪获得覆盖研究区的30 m空间分辨率数据,然后再通过加权求和获得时间分辨率为1 a的数据,而改进型土壤调整植被指数(modified soil adjusted vegetation index,MSAVI)、归一化水体指数(normalized difference water index,NDWI)、地表反照率(Albedo)、表土粒度指数(topsoil grain size index,TGSI)均基于Landsat遥感影像数据提取获得,具体计算公式分别为[17⇓-19]:
式中ρNIR,ρRed,ρGreen,ρBlue,ρSWIR1和ρSWIR2分别为近红外、红光、绿光、蓝光、短波红外1和短波红外2波段的地表反射率。最终4个时期所有的指标均以30 m×30 m空间分辨率的网格呈现,空间参考坐标格式为WGS_84_UTM_Zone_48N。
3 研究方法
3.1 生态承载力计算
生态承载力是通过定量的数值来直观反映,这整个评价过程既离不开数据的支撑,也需要评价者的参与[20],关键步骤在于指标选取和权重确定。
3.1.1 指标选取与处理
式中: x'ij为第i个指标的第j个数据; xij为第i个指标的第j个数据标准化后的值; maxi{x'ij}为第i个指标中的最大值; mini{x'ij}为第i个指标中的最小值。
3.1.2 指标权重确定
式中: Ci为一致性指标的值; λmax为判断矩阵的最大特征值; n为指标个数; Ri为平均随机一致性指标,通过查询一致性指标表得到。当CR<0.1时,判断矩阵满足一致性检验[29],否则应该对判断矩阵进行适当调整之后再次进行分析。
主、客观赋权的方法各有其优势,将2类方法得到的权重系数进行组合得到的联合系数更科学全面,假设层次分析法和主成分分析法计算的权重分别为w=w1,w2,…,wn; w'=w'1,w'2,…,w'n[33],则联合权重W可表示为:
式中а为方程的系数,表示单个权重对组合权重的贡献。其中w,w'和
根据层次分析法和主成分分析法得到的各指标权重,带入公式(8)得到最终的生态承载力计算公式,即
式中: X1,X2,X3,X4,X5,X6分别为MSAVI、净初级生产力、潜在蒸散发、NDWI、TGSI和Albedo这6个归一化处理之后的指标; ECC为生态承载力。
3.1.3 生态承载力等级划分
为更好地呈现出各个时期生态承载力在空间上的差异,将原生态承载力值进行归一化处理,使其值域范围在[0,1]之间,并按照表2进行等级划分。
表2 生态承载力等级划分标准
Tab.2
| 等级编号 | 等级名称 | 生态承载力取值范围 |
|---|---|---|
| 1 | 低生态承载力 | [0,0.2) |
| 2 | 较低生态承载力 | [0.2,0.4) |
| 3 | 中生态承载力 | [0.4,0.6) |
| 4 | 较高生态承载力 | [0.6,0.8) |
| 5 | 高生态承载力 | [0.8,1.0] |
3.2 生态承载力变化趋势分析
3.2.1 Theil-Sen Median趋势分析
式中: M为各年份数据组合个数; m为时间序列数据的数量; Xi和Xj分别为在第i年和第j年(j>i)的观测数据; Ssen为趋势度,当Ssen >0时,反映数据呈现增长趋势,反之则呈现减小的趋势。
3.2.2 Mann-Kendall检验
在给定置信区间水平α的情况下,如果|S|>S1-α/2,则研究序列在α水平上存在显著变化; 相反则变化不显著。检验值为正数时,表示呈现上升趋势; 为负数时表示呈现下降趋势。本研究中α取0.05,即S1-α/2为1.96[40]。
3.2.3 驱动因素分析
研究区生态承载力变化趋势分别与降雨、温度2个气候因素进行相关性分析,2个变量的样本集分别为X={x1,x2,…,xn},Y={y1,y2,…,yn}[41],再结合回归残差分析对其他可能驱动力因素进行承载力分析。相关性计算公式为:
图2
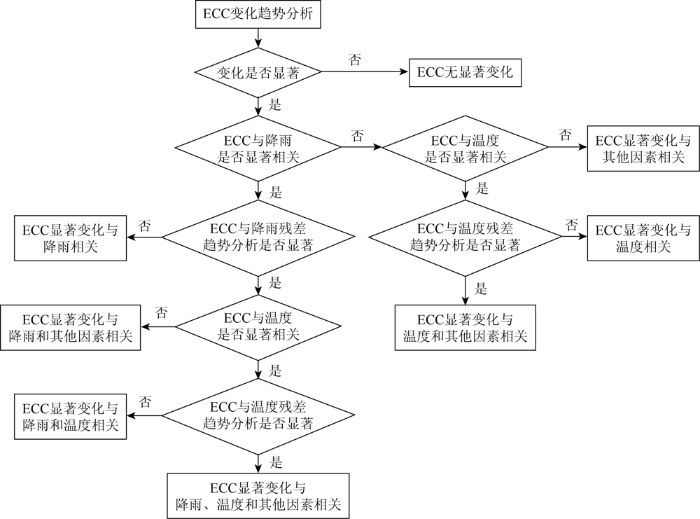
图2
长时间序列生态承载力驱动因素分析框架
Fig.2
Analysis framework of driving factors of long-term ecological carrying capacity
4 结果分析与讨论
4.1 生态承载力评价
将4个时期标准化的6个指标数据带入公式(9)得到4个时期生态承载力空间分布,并按照表2进行划分,得到各生态承载力等级分布及统计结果,如图3—4所示。可以看出,灌区内部的生态承载力最高,其中在1990年高生态承载力面积最多,占总面积的4.28%,之后开始逐渐减少至不足1%,而较高生态承载力的面积逐渐增加,由1990年的9.72%上升到2020年的20.02%。周围的荒漠化区域大部分处于中生态承载力状态,1990年面积占比为60.92%,到2000年和2010年降低到45%左右,2020年又恢复到61.89%,少部分区域处于较低生态承载力,其中在1990年面积占比为24.59%,到了2000年和2010年上升到37%左右,2020年又下降到16.78%。低生态承载力在4个时期内面积占比均很小,不足1%,所以总的来说,生态承载力总体处于先下降又上升的趋势,2000—2010年变化不大,灌区面积不断扩张,进一步导致较高生态承载力面积占比不断增加,而周围的荒漠化区域中生态承载力面积在2000年之后逐渐增多,较低生态承载力不断减少。
图3
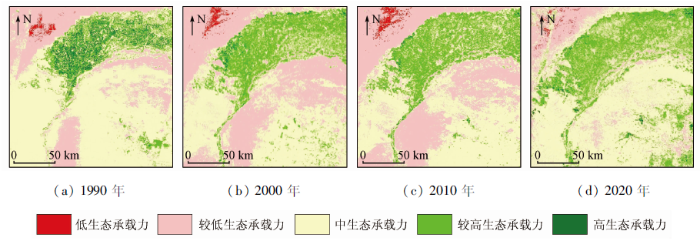
图3
研究区4个时期生态承载力各等级空间分布
Fig.3
Spatial distribution of ecological carrying capacity in four periods in the study area
图4
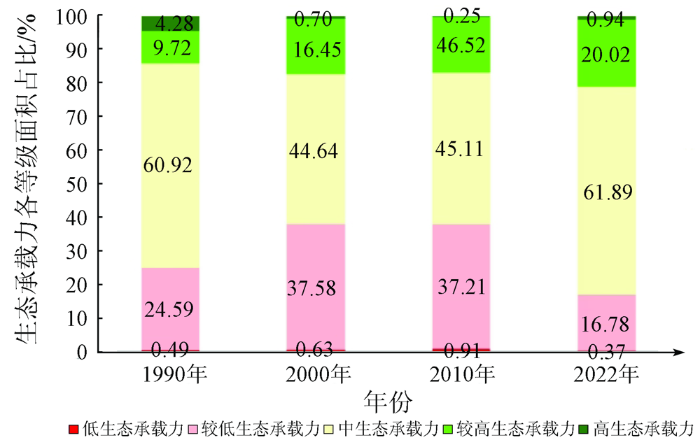
图4
4个时期具有不同级别生态承载力的区域百分比
Fig.4
Percentage of regions with different levels of ecological carrying capacity in four periods
4.2 生态承载力变化趋势分析
图5
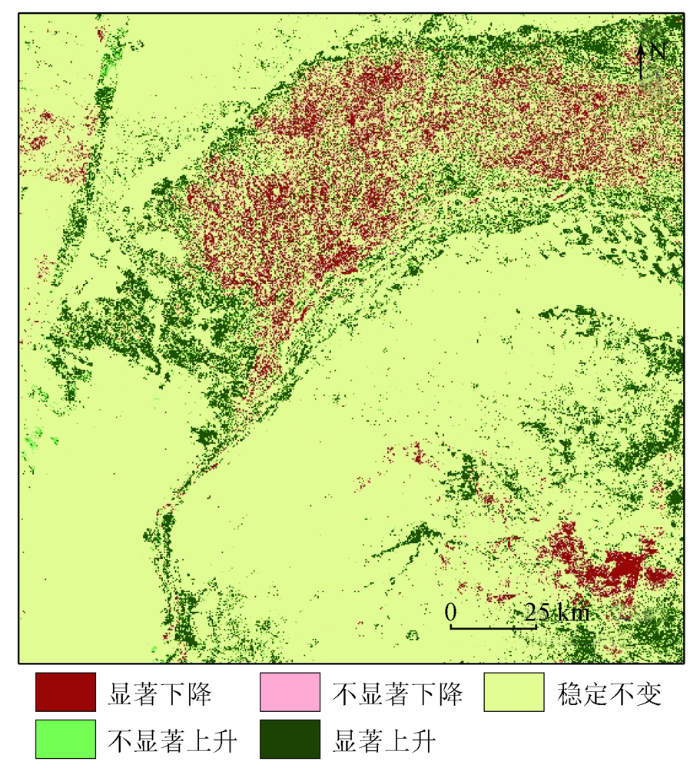
图5
研究区生态承载力变化趋势
Fig.5
Change trend of ecological carrying capacity in the study area
表3 研究区不同变化趋势的面积占比
Tab.3
| 变化趋 势类型 | 显著 下降 | 不显著 下降 | 稳定 不变 | 不显著 上升 | 显著 上升 |
|---|---|---|---|---|---|
| 面积占比 | 7.09 | 0.02 | 81.89 | 0.19 | 10.81 |
研究区在1990—2020年近30 a期间,研究区总体生态承载力81.89%的面积处于稳定不变的状态,上升的面积大于下降的面积,其中显著上升的面积较多,占10.81%,主要分布在黄河两岸、灌区边缘及乌兰布和沙漠东北缘与灌区接壤区域,这部分土地的灌草木面积逐渐增加,有一部分的耕地被用于种植牧草,来驱动地区畜牧业的发展,在2个沙漠区域,特别是接近黄河两岸的区域大面积种植灌草木,用以改进地区的荒漠化程度。研究区显著下降的区域占7.09%,主要分布在灌区中部,该区域是耕地开发的主要区域,以及工厂的建设也聚集于此,总体受人为干扰较大。
4.3 生态承载力驱动因素分析
图6
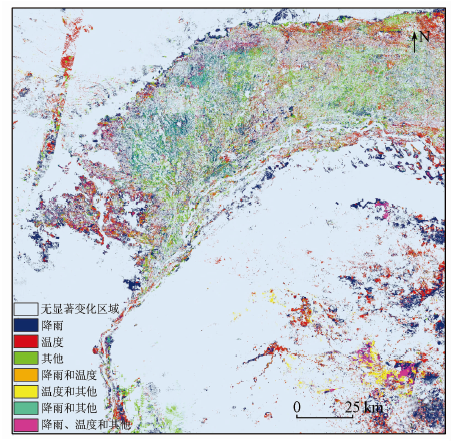
图6
生态承载力驱动因素空间分布
Fig.6
Spatial distribution of driving factors of ecological carrying capacity
表4 各种驱动因素面积统计
Tab.4
| 驱动因 素组合 | 无显著 变化区 域 | 降雨 | 温度 | 其他 | 降雨 和温 度 | 降雨 和其 他 | 温度 和其 他 | 降雨、 温度和 其他 |
|---|---|---|---|---|---|---|---|---|
| 面积 占比 | 81.89 | 7.61 | 4.61 | 2.77 | 0.31 | 0.99 | 1.07 | 0.75 |
由表4可以看出,在生态承载力变化显著的区域内,降雨单方面因素的影响面积是最大的,占研究区总面积的7.61%,主要作用于研究区库布齐沙漠的东南区域、与黄河的接壤区域、乌兰布和沙漠东北缘和灌区接壤的区域,这些区域受黄河水资源的影响明显,而黄河受降雨的影响较大。其次是温度单方面因素的影响,占研究区总面积的4.61%,主要作用于研究区东南方向的库布齐沙漠东北方向部分、乌兰布和沙漠东北缘与灌区的接壤区域,这些区域的特点是灌草木较多。土地利用类型变化的单方面影响主要作用于灌区中部偏东方向,结合土地利用类型变化可以发现,该区域的耕地面积前期大面积增加,灌草木分布不稳定。降雨和温度双重影响的面积极少,仅占总面积的0.31%,分布也较为离散。降雨和其他因素的双重作用占总面积的0.99%,主要分布在灌区的中部偏西方向,该区域耕地面积先增加又减少,转为种植牧草,灌草木也缓慢增加。温度和其他因素的双重作用占总面积的1.07%,主要分布在库布齐沙漠的东南角,该区域主要是植被,但极不稳定。降雨、温度和其他因素的综合影响的面积占总面积的0.75%,在灌区周围的分布离散,还有部分在库布齐沙漠的东南角,这些区域的地物类型不稳定,变化较大。
5 结论
本研究构建适合乌兰布和沙漠东北缘的生态承载力综合评价模型,获得研究区各个时期的生态承载力分布和时空差异分析,并从气候因素和土地利用类型变化2个方面进行驱动因素分析,最终得到以下几点结论:
1)研究区近30 a生态承载力在1990—2000年有明显的下降,2000—2010年的变化不大,而到2020年又有明显的上升,处于一个改善的状态。黄河以北的灌区中部及偏东部地区的生态承载力明显减少,受土地利用类型变化的影响为主,其次是降雨和温度; 乌兰布和沙漠东北缘与灌区的接壤区域以及灌区周围的生态承载力明显增加,受温度、降雨的影响为主; 而在黄河以南的荒漠区域中,偏东南方向的生态承载力明显增加,受温度和降雨影响为主,其次是土地利用类型的变化。
2)研究区应减少耕地开发对生态环境造成的负载,而当地遵循适地适树原则,有规划地种植耐旱耐高温的灌草木,大力发展畜牧业,并利用其光能优势,促进光伏产业的发展,间歇种植灌草木,实现生态效益最大化,这一系列相关政策的执行对于干旱半干旱地区荒漠化治理是十分有效的,应继续实施以保障地区可持续发展。
但是,仅利用一些生态指标作为生态承载力的评价指标有些单一,今后可以添加一些社会经济类指标,尝试空间化信息和非空间化信息的结合,进一步提高其评价精度; 另外,关于如何验证生态承载力的评价结果也是未来需要深入探究的方向。
参考文献
生态承载力评估方法研究进展
[J].
Research progress in ecological carrying capacity assessment methods
[J].
Evaluation methods and research trends for ecological carrying capacity
[J].
DOI:10.5814/j.issn.1674-764x.2018.02.001
[本文引用: 1]

With the intensive research into global coupling relationships, ecological carrying capacity (ECC), seen as the crucial link between natural ecosystems and human systems, has gradually become an important tool for interdisciplinary research in ecology, resources science and environmental science, as well as for research on regional sustainable development. However, ECC research remains immature and lacks a complete theoretical system, as a result of many limiting factors and different space-time conditions. At present, Chinese and foreign studies focus on methods to evaluate ECC while neglecting to identify the internal driving mechanisms of ECC. In this article, based on the development and conceptualization of ECC, we introduce three evaluation methods for ECC: ecological footprint (EF), human appropriation of net primary production (HANPP) and ecosystem services consumption (ESC). Furthermore, we illuminate research focuses and developmental directions for ECC with respect to driving mechanisms, threshold, comprehensive evaluation systems and coupling dynamic model of multi ecological factors, in order to provide a reference for future ECC research.
Exploring the spatiotemporal changes of ecological carrying capacity for regional sustainable development based on GIS:A case study of Nanchang City
[J].
Evaluation of spatio-temporal patterns of remotely sensed evapotranspiration to infer information about hydrological behaviour in a data-scarce region
[J].DOI:10.3390/w9050333 URL [本文引用: 1]
Remotely monitoring ecosystem water use efficiency of grassland and cropland in China’s arid and semi-arid regions with MODIS data
[J].DOI:10.3390/rs9060616 URL [本文引用: 1]
基于生态系统服务的生态承载力:概念、内涵与评估模型及应用
[J].
Ecological carrying capacity based on ecosystem services:Concept,connotation,evaluation model and application
[J].
内蒙古河套灌区盐碱化耕地改良措施及建议
[J].
Measures and suggestions for improving salinized cultivated land in Hetao Irrigation District of Inner Mongolia
[J].
河套灌区国管水利工程保护与管理问题分析及对策建议
[J].
Problems of protection and management of state-managed water conservancy projects in Hetao Irrigation District and countermeasures
[J].
干旱农牧区内蒙古磴口县生态足迹及生态承载力动态变化
[J].
Dynamic changes of ecological footprint and ecological carrying capacity in Dengkou County,Inner Mongolia
[J].
磴口县2007年水资源生态承载力分析
[J].
Ecological carrying capacity of water resources in Dengkou County in 2007
[J].
Effects of ecological restoration projects on land use and land cover change and its influences on territorial NPP in Xinjiang,China
[J].DOI:10.1016/j.catena.2013.11.020 URL [本文引用: 1]
乌兰布和沙漠东北缘绿洲防护林体系防风阻沙能力研究
[J].
Research on wind and sand resistance ability of oasis shelterbelt system in the northeastern edge of Ulan Buh Desert
[J].
乌兰布和沙漠东北缘防护林内外沙尘暴低空结构特征
[J].
Low-altitude structure characteristics of sandstorms inside and outside the shelterbelt in the northeastern edge of Ulan Buh Desert
[J].
乌兰布和沙漠东北缘白刺群落与油蒿群落土壤养分特征分析
[J].
Analysis of soil nutrient characteristics of Nitraria community and Artemisia ordosica community in the northeastern edge of Ulan Buh Desert
[J].
Using the negative soil adjustment factor of soil adjusted vegetation index (SAVI) to resist saturation effects and estimate leaf area index (LAI) in dense vegetation areas
[J].
DOI:10.3390/s21062115
URL
[本文引用: 1]
Saturation effects limit the application of vegetation indices (VIs) in dense vegetation areas. The possibility to mitigate them by adopting a negative soil adjustment factor X is addressed. Two leaf area index (LAI) data sets are analyzed using the Google Earth Engine (GEE) for validation. The first one is derived from observations of MODerate resolution Imaging Spectroradiometer (MODIS) from 16 April 2013, to 21 October 2020, in the Apiacás area. Its corresponding VIs are calculated from a combination of Sentinel-2 and Landsat-8 surface reflectance products. The second one is a global LAI dataset with VIs calculated from Landsat-5 surface reflectance products. A linear regression model is applied to both datasets to evaluate four VIs that are commonly used to estimate LAI: normalized difference vegetation index (NDVI), soil adjusted vegetation index (SAVI), transformed SAVI (TSAVI), and enhanced vegetation index (EVI). The optimal soil adjustment factor of SAVI for LAI estimation is determined using an exhaustive search. The Dickey-Fuller test indicates that the time series of LAI data are stable with a confidence level of 99%. The linear regression results stress significant saturation effects in all VIs. Finally, the exhaustive searching results show that a negative soil adjustment factor of SAVI can mitigate the SAVIs’ saturation in the Apiacás area (i.e., X = −0.148 for mean LAI = 5.35), and more generally in areas with large LAI values (e.g., X = −0.183 for mean LAI = 6.72). Our study further confirms that the lower boundary of the soil adjustment factor can be negative and that using a negative soil adjustment factor improves the computation of time series of LAI.
Study of the desertification index based on the albedo-MSAVI feature space for semi-arid steppe region
[J].DOI:10.1007/s12665-019-8111-9 [本文引用: 1]
Monitoring desertification processes in Mongolian Plateau using MODIS tasseled cap transformation and TGSI time series
[J].
DOI:10.1007/s40333-017-0109-0
[本文引用: 1]
Most remote sensing studies assess the desertification using vegetation monitoring method. But it has the insufficient precision of vegetation monitoring for the limited vegetation cover of the desertification region. Therefore, it offers an alternative approach for the desertification research to assess sand dune and sandy land change using remote sensing in the desertification region. In this study, the indices derived from the well-known tasseled cap transformation (TCT), tasseled cap angle (TCA), disturbance index (DI), process indicator (PI), and topsoil grain size index (TGSI) were integrated to monitor and assess the desertification at the thirteen study sites including sand dunes and sandy lands distributed in the Mongolian Plateau (MP) from 2000 to 2015. A decision tree was used to classify the desertification on a regional scale. The average overall accuracy of 2000, 2005, 2010 and 2015 desertification classification was higher than 90%. Results from this study indicated that integration of the advantages of TCA, DI and TGSI could better assess the desertification. During the last 16 years, Badain Jaran Desert, Tengger Desert, and Ulan Buh Desert showed a relative stabilization. Otindag Sandy Land and the deserts of Khar Nuur, Ereen Nuur, Tsagan Nuur, Khongoryn Els, Hobq, and Mu Us showed a slow increasing of desertification, whereas Bayan Gobi, Horqin and Hulun Buir sandy lands showed a slow decreasing of desertification. Compared with the other 11 sites, the fine sand dunes occupied the majority of the Tengger Desert, and the coarse sandy land occupied the majority of the Horqin Sandy Land. Our findings on a three or four years’ periodical fluctuated changes in the desertification may possibly reflect changing precipitation and soil moisture in the MP. Further work to link the TCA, DI, TGSI, and PI values with the desertification characteristics is recommended to set the thresholds and improve the assessment accuracy with field investigation.
四川省城市人力资源产业的综合评价研究——基于主成分分析和聚类分析
[J].
Study on the comprehensive evaluation of urban human resources industry in Sichuan Province:Based on principal component analysis and cluster analysis
[J].
评价型指标标准化与评价方法对学术评价影响研究——以TOPSIS评价方法为例
[J].
Research on the impact of evaluation index standardization and evaluation methods on academic evaluation:Taking TOPSIS evaluation method as an example
[J].
指标标准化方法对科技评价的影响机制研究——以学术期刊评价为例
[J].
Study on the impact mechanism of index standardization method on science and technology evaluation:Taking the evaluation of academic journals as an example
[J].
城市生态安全的多种评价模型及应用
[J].
Several assessment models and application analysis of urban ecological security
[J].
DOI:10.11821/yj2009020003
[本文引用: 1]
This paper aims at exploring the urban ecological security level and assessment methods, and providing the scientific basis for the policy of the assessment and management on the urban ecological security. Shenzhen and four municipalities are taken as case studies to contrive an evaluating index system of urban ecological security depending on the Pressure-Status-Response (PSR) model. Firstly, the authors use four kinds of assessment models to simulate urban ecological security levels for those cities in 2006. A comparison is made between these models, based on the optimal method in combination of the subjective preference (Analytic Hierarchy Process) and the objective information (the modified Entropy), so as to identify the weights of all assessment indexes comprehensively. Then the ecological systems of Shenzhen and four municipalities are evaluated by applying the modified Grey Relational Analysis, the Matter-Element extension, the Fuzzy Comprehensive method and Main Constituents Projection method. The results are shown as follows: (1) Shenzhen's ecological security level is the highest, followed by Beijing, Tianjin and Shanghai, and Chongqing. Shenzhen, Beijing and Tianjin are labeled as relative safety at ecological security level, Shanghai is critically secure, and Chongqing is unsafe; Shanghai possesses the most developmental potentiality, while less in Shenzhen, Beijing and Tianjin, and still the lowest in Chongqing. From the conclusions above, the differences can be found in terms of ecological environmental pressures, the states of ecological systems and the responses of human beings for different cities. (2) In the studying method of urban ecological security evaluation, every model can obtain a similar result and can reflect the applicability on ecological security assessment. The results of Fuzzy Comprehensive method and Matter-Element Extension method are more comprehensive, and more differentiations can be revealed in Fuzzy Comprehensive method which can analyze the problems and offer the targeted measures than in the Matter-Element Extension. The conclusion of level judgment drawn by the Grey Associative Analysis is not possessed of comparability and cannot reflect the gaps among the cities. The Main Constituents Projection method cannot directly demonstrate the ecological security levels, although it can simplify the data structure, reduce the information loss of the original data and avoid the subjective arbitrariness as well as only showing the high or low level of ecological security. Thus there are some limitations in this method on ecological security assessment.
The application of combination weighting approach in multiple attribute decision making
[J].
The analytic hierarchy process:Planning,priority setting,resource allocation
[J].
基于层次分析法的高校图书馆学科服务评价模式
[J].
The subject service evaluation model of academic libraries based on the analytic hierarchy process
[J].
莆田市近海海域生态环境承载力评价
[J].
Evaluation of the carrying capacity of the ecological environment in the coastal waters of Putian City
[J].
Analysis of ecological carrying capacity using a fuzzy comprehensive evaluation method
[J].DOI:10.1016/j.ecolind.2020.106243 URL [本文引用: 1]
Evaluation of geological and eco-logical bearing capacity and spatial pattern along Du-wen road based on the analytic hierarchy process (AHP) and the technique for order of preference by similarity to an ideal solution (TOPSIS) method
[J].
DOI:10.3390/ijgi9040237
URL
[本文引用: 1]
As China is a mountainous country, a large quantity of the population has to live in mountainous areas due to limited living space. Most of them cluster along roads in areas with relatively poor traffic conditions. In view of the spatial-temporal change of complex geological and ecological environment along the roads in the mountains, this paper takes the Dujiangyan- Wenchuan (Du-Wen) Road as the research object, and puts forward a method to evaluate the bearing capacity of regional geological and ecological environment based on the evaluation of quality and spatial coupling of bearing capacity. For the needs of the current research, a total number of 20 indicators from three aspects of geological, ecological, and social attributes were selected to carry out the assessment. Based on the GIS platform and evaluation index system, the weight of each evaluation index factor is determined by Analytic Hierarchy Process (AHP). The comprehensive quality of bearing capacity is calculated by the Technique for Order of Preference by Similarity to an Ideal Solution (TOPSIS) algorithm through weighted superposition, which comes to result in the evaluation of geological, ecological, and social environment. Afterward, the bearing capacity of the study area is classified, combining the results of hot spot analysis. The study shows that the spatial distribution of geological, ecological, and socio-economic bearing capacity in this area is highly aggregated, with 31.12% of the area to be classified as suitable construction area, 31.98% as backup reserve area, and 36.79% as unsuitable construction area. The studied triangle area, composed of Yingxiu Town, Xuankou Town, and Dujiangyan City, presents a large area of a high-valued aggregation area, with comprehensive high quality bearing capacity and spatial aggregation, which is better for planning and construction.
基于主成分分析的山西省各城市经济综合实力评价
[J].
Evaluation of comprehensive economic strength of cities in Shanxi Province based on principal component analysis
[J].
多指标综合评价中赋权方法评析
[J].
Review and analysis of weighting methods in multi-index comprehensive evaluation
[J].
Analysis of ecological carrying capacity using a fuzzy comprehensive evaluation method
[J].DOI:10.1016/j.ecolind.2020.106243 URL [本文引用: 1]
1960—2016年黄土高原多尺度干旱特征及影响因素
[J].
DOI:10.11821/dlyj020190088
[本文引用: 1]
明晰黄土高原干旱特征对于生态工程建设和社会经济可持续发展具有至关重要的作用。基于1960—2016年黄土高原59个气象台站数据和标准化降水蒸散指标(SPEI),本文分析了黄土高原多尺度干旱时空变化特征,并探讨了遥相关指数对黄土高原干旱变化的影响。结果表明:① 黄土高原SPEI指数呈下降趋势,其中70年代初和90年代末为显著干旱时期,80—90年代初为较湿润时期;② 年尺度SPEI呈下降趋势的区域遍布整个黄土高原,以山西西部、宁夏北部和甘肃中东部最为显著,而黄土高原西北和西南部则表现为变湿趋势;③ 春、夏和秋三季SPEI均呈下降趋势,且夏、秋季下降趋势较大,趋势系数均为-0.03/10a。春季干旱趋势与年际变化较为一致,秋季干旱趋势范围较大,占总面积的64.53%,冬季干旱范围较小且不显著;④ 多尺度干旱同时受IOD、NAO、PDO、AMO和ENSO3.4等遥相关指数的共同影响,且该影响存在明显的年际和年代际相位转换特征。多元回归分析显示,IOD和NAO对黄土高原干旱解释率较高,分别为22.98%和12.23%,而ENSO3.4解释率较低,表明黄土高原降水变化与西南季风具有较好的关联性。
Multi-scale drought characteristics and influencing factors of the Loess Plateau from 1960 to 2016
[J].
Sen’s斜率估计与Mann-Kendall法在设备运行趋势分析中的应用
[J].
Sen’s slope estimation and Mann-Kendall method in equipment operation trend analysis application
[J].
Trends in extreme precipitation events in the indus river basin and flooding in Pakistan
[J].DOI:10.1080/07055900.2013.859124 URL [本文引用: 1]
Seasonal spatio-temporal variability in temperature over North Kashmir Himalayas using Sen Slope and Mann-Kendall test
[J].
1952—2008年延河流域降水与径流的变化趋势分析
[J].
Analysis of the change trend of precipitation and runoff in the Yanhe River Basin from 1952 to 2008
[J].
基于Pearson相关性分析的高校学生恋爱模型
[J].
College student love model based on pearson correlation analysis
[J].
