

0 引言
目前,国内外众多学者采用多种方法进行遥感影像蓝藻信息提取。其中光谱指数法应用较为广泛,该方法通过蓝藻光谱特性构建能够表征蓝藻特征的光谱指数,主要包括: 归一化植被指数(normalized difference vegetation index, NDVI)[4]、增强型植被指数(enhanced vegetation index, EVI)[2-3,5]、漂浮藻类指数(floating algae index, FAI)[5]、替代型漂浮藻类指数(alternative floating algae index,AFAI)[6]等; 同时也有学者进一步结合多个光谱指数构建利用机器学习分类方法,如: 决策树、支持向量机、神经网络、随机森林等蓝藻提取方法[7⇓⇓⇓⇓-12]。此外还有学者提出了蓝藻提取的非监督分类方法[13]。综合对比以上几种分类方法,光谱指数法通过专家经验设定固定阈值对蓝藻信息信息提取,缺乏可拓展性,难以针对长时间序列的遥感影像数据集确定唯一有效阈值进行蓝藻识别; 监督分类方法识别精度相比于其他方法精度较高,但在训练过程中需要设定模型超参数,然而对于模型超参数的选择上往往靠过去的经验和大量的人工调试,很难得到最优的网络结构和参数,另一方面训练蓝藻分类模型需要标记大量样本,人工成本较高; 非监督分类方法的分类精度则无法保证,需要大量的长时间序列数据进行分析。
XGBoost(eXtreme Gradient Boost)于2016年SIGKDD大会提出,是一种结合梯度提升和决策树的集成学习方法[14],能够自动利用CPU的多线程进行并行,在算法运行效率和精度上有明显提升,近年来广泛应用于遥感监测领域,如总磷、总氮、叶绿素a等水质指标反演[15],以及遥感地物分类[16],目前XGBoost分类算法在遥感蓝藻监测研究中鲜有报道。机器学习分类模型训练精度受超参数影响较大,较差的超参数组合策略易导致模型过拟合或者欠拟合,贝叶斯优化算法(Bayesian optimization)利用先验知识逼近未知函数的后验分布从而调节最优超参数组合,相较于传统的专家经验设定、网格检索等方法,贝叶斯优化算法更能反映实际问题的本质,并在众多领域中获得应用,如: 经济预测、舆情分析等领域[17]。在以往遥感监测分类算法研究中,机器学习超参数选取一般基于专家经验进行选择,利用贝叶斯优化寻找最优解的方法涉及较少。
光学遥感影像包含光谱特征、指数特征、纹理特征,结合多遥感特征进行蓝藻分类提取可以避免光谱混淆,提升模型精度[18]。本文以遥感影像包含的光谱、指数、灰度共生矩阵等多特征信息作为输入,利用贝叶斯优化算法寻找XGBoost模型全局最优解对蓝藻识别模型进行训练,生成BO-XGBoost蓝藻识别模型,将该模型应用于2021年阳澄湖蓝藻信息提取,与人工标注结果进行对比验证,并针对BO-XGBoost模型的适用性和优缺点进行评价。本研究的成果可为遥感领域机器学习算法优化问题提供参考,以及分析阳澄湖蓝藻发生规律和进一步湖泊生态环境治理提供技术指导。
1 研究区概况与数据源
1.1 研究区概况
图1
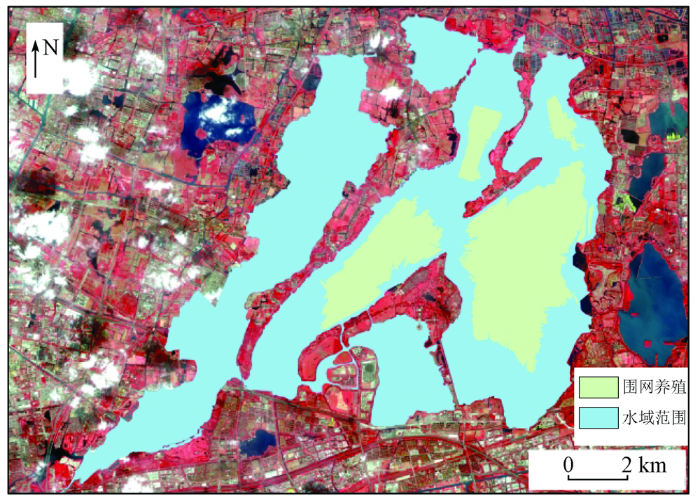
图1
阳澄湖水域范围
(底图为Sentinel-2 B8(R),B4(G),B3(B)波段合成影像)
Fig.1
Yangcheng Lake water area
1.2 数据获取及处理
阳澄湖湖泊面积较小,及时掌握阳澄湖蓝藻暴发的空间分布形态对卫星遥感影像空间、时间分辨率要求较高。本文使用欧洲航空安全局(European Aviation Safety Agency,ESA)提供的免费数据源Sentinel-2,其空间分辨率为10 m,S2A和S2B星联合观测时间分辨率可达5 d[20],能够满足阳澄湖蓝藻暴发监测的需求。Sentinel-2数据可从ESA官方网站(
表1 阳澄湖影像过境时间
Tab.1
| 序号 | 日期 | 云层覆盖率/% | 载荷类型 |
|---|---|---|---|
| 1 | 6月22日 | 0 | S2B星 |
| 2 | 7月7日 | 0.85 | S2A星 |
| 3 | 7月12日 | 0 | S2B星 |
| 4 | 8月26日 | 0 | S2A星 |
| 5 | 8月31日 | 0 | S2B星 |
| 6 | 9月30日 | 2.48 | S2B星 |
| 7 | 10月5日 | 0 | S2A星 |
| 8 | 10月30日 | 1.26 | S2B星 |
2 研究方法
2.1 特征提取
光谱特征是表征地物类型的重要手段之一,本文中选取的光谱特征为Sentinel-2影像数据的4个波段。同时选取能够表征蓝藻、水体的光谱指数NDVI、归一化差异水体指数(normalized difference water index, NDWI),计算公式分别为:
式中NIR,Red和Green分别为近红外、红光和绿光波段,对应Sentinel-2影像B8,B4和B3波段。
通过光谱特征和光谱指数只能表征单一像元的地物类型,忽略了遥感影像携带的空间纹理特征,本文使用常用的纹理特征提取方法——灰度共生矩阵,通过计算相对位置固定像素对的灰度频率来提取纹理信息[21]。本文利用NDVI作为灰度矩阵,灰度量化级选择值为32,统计像元窗口大小为9像元×9像元,提取了8个纹理特征,包括: 对比度、相异性、同质性、角二阶矩、方差、均值、最大概率和相关性。
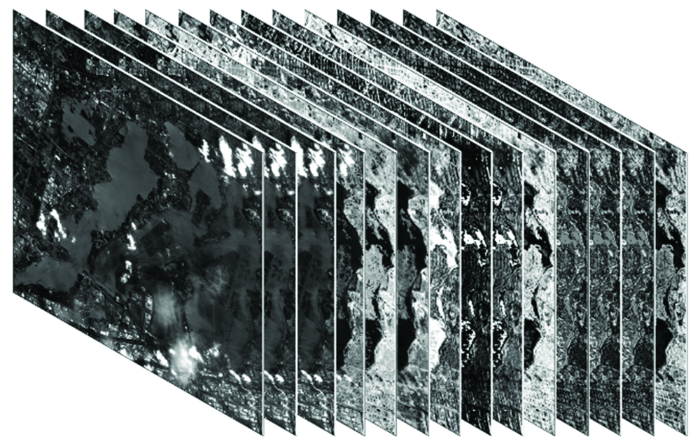
将光谱特征、指数特征、纹理特征共14个特征进行融合,多特征图如图2所示,并用于Sentinel-2的蓝藻分类提取特征集。
图2
2.2 样本选取
2021年6—10月期间,选择天气晴朗且有Sentinel-2影像数据过境日期对阳澄湖进行实地踏勘。图3为2021年8月26日阳澄湖实地踏勘成果和对应日期的Sentinel-2影像数据,图3(a)可以看出点位2,3,5,20有藻类聚集,点位11,12,17,18有水生植被聚集。观察图3(a)和图3(b)蓝藻与其他水生植被在影像呈现的状态,发现蓝藻多以大面积,絮状分布为主,其他水生植被一般有明显的分类边界,以小范围、零散、近陆地分布为主。通过计算NDVI,并结合实地调研结果,对蓝藻在遥感影像上进行标注,标注结果如图3(c)。选取表1中4景遥感影像数据进行样本提取,分别为7月7日、8月26日、9月30日、10月30日,根据人工标注结果,针对蓝藻、其他植被、水体、云4类目标物各随机选取250个点位共计1 000个样本数据,其中蓝藻为目标,其他植被、水体、云为背景。剩余4期影像数据不参与模型训练过程,以便验证分类模型的泛化能力。
图3

2.3 基于贝叶斯优化的XGBoost分类方法
贝叶斯优化是根据目标函数
式中: M为模型目标函数值; E为观察点表示已观测集合;
式中:
XGBoost是基于决策树的监督模型,属于集成学习Boosting算法的一种,思想是使用多个CART分类树作为弱学习器,增加的决策树学习上一轮预测结果的残差,通过不断地增加新树使得损失值最低,最终基于加法模型将多个弱学习器集成为一个强学习器,进而获得一个高精度的机器学习模型。XGBoost算法需要在训练前设定子模型数量、学习率、树最大深度、惩罚系数等超参数,使用人工检索或网格搜索方法确定最优超参数组合达到最小误差和避免过拟合,会消耗大量计算时间。本文使用贝叶斯优化自动调整XGBoost超参数,在有限的检索次数内达到最优值,从而保证得到最优超参数组合进行蓝藻识别和提取。
图4
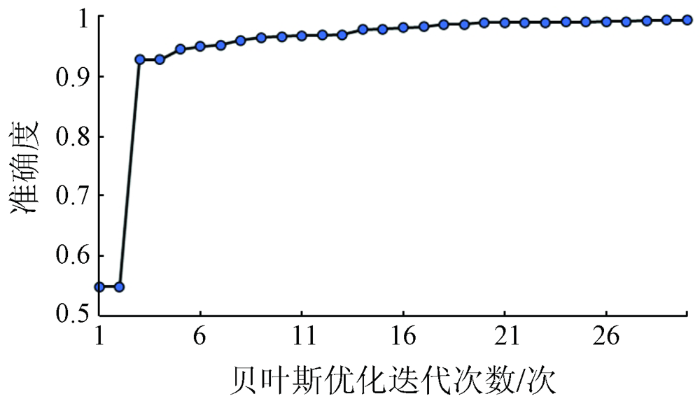
表2 XGBoost最优超参数组合
Tab.2
| 变量 | 含义 | 取值范围 | 步长 | 最优值 |
|---|---|---|---|---|
| max_depth | 子模型最大深度 | [5, 15] | 1 | 4 |
| learning_rate | 学习率 | 0.001, 0.01, 0.1, 1, 10 | — | 0.1 |
| n_estimators | 子模型数量 | [10, 300] | 10 | 35 |
| subsample | 随机采样的比例 | (0, 1) | 0.1 | 0.5 |
| colsample_bytree | 特征占比 | (0, 1] | 0.1 | 0.4 |
| min_child_weight | 最小叶节点样本权重和 | [1, 10] | 1 | 4 |
2.4 精度评价
通过混淆矩阵对BO-XGBoost蓝藻分类模型精度进行评估,确定4个评价指标,即精确率(Precision)、召回率(Recall)、F1指标和Kappa系数。另外,利用交并比(intersection over union,IoU)评价人工标注成果和识别结果之间的差异大小,以验证分类模型实际应用效果。精确率描述正确分类的数量与模型识别出的数量占比; 召回率描述正确分类的数量与真实数量的占比; F1指标为精确率和召回率的调和平均数; Kappa系数描述模型预测结果和实际分类结果的一致性; IoU描述正确分类区域与模型识别结果和真实区域交集的比值。
3 结果与分析
3.1 模型分类结果
采用依托贝叶斯优化生成的最优参数组合,利用XGBoost算法对提取的1 000条样本集进行训练,随机抽取70%样本数据作为样本集,30%样本数据作为测试集。经训练后生成BO-XGBoost模型,利用精确率、召回率、F1指标、Kappa系数对样本集进行评价,表3展示了BO-XGBoost分类算法分别在训练集和测试集上的表现,其中水体、云、其他植被为背景物,蓝藻为目标物。从表3可以看出,在训练集、测试集上,云类识别精度最高,水体次之,蓝藻精度较低但F1指标仍在98%以上。BO-XGBoost在测试集上各项指标精度均高于96.07%,且测试集、训练集表现相似相差较小,该模型在样本数据训练过程中不存在过拟合和欠拟合的问题。
表3 分类模型精度评价
Tab.3
| 评价指标 | 训练集 | 测试集 | ||||||
|---|---|---|---|---|---|---|---|---|
| 蓝藻 | 水体 | 云 | 其他植被 | 蓝藻 | 水体 | 云 | 其他植被 | |
| 精确率/% | 98.61 | 98.86 | 99.88 | 98.63 | 96.07 | 99.32 | 99.46 | 98.11 |
| 召回率/% | 97.82 | 99.57 | 99.77 | 98.97 | 97.86 | 98.66 | 98.93 | 97.33 |
| F1/% | 98.22 | 99.21 | 99.82 | 98.80 | 96.96 | 98.99 | 99.19 | 97.72 |
| Kappa | 0.986 7 | 0.975 6 | ||||||
为确定BO-XGBoost分类模型的实际应用情况,利用7月7日、8月26日、9月30日、10月30日参与样本集提取的4期影像数据进行蓝藻提取。图5(a)—(d)展示了Sentinel-2的标准假彩色影像,图5(e)—(h)展示了BO-XGBoost的蓝藻分类结果,其中黄色区域为蓝藻区域,图5(i)—(l)展示了人工判别标注的蓝藻分类结果。对比BO-XGBoost和人工解译蓝藻提取成果可发现,人工目视解译成果的蓝藻空间分布与BO-XGBoost识别结果相似,图中可知4期遥感影像数据蓝藻主要暴发区域为阳澄西湖,2种方法蓝藻区域表征基本一致。在蓝藻聚集程度较低的区域,遥感影像上蓝藻与水体边界不清晰,表征不明显,仅利用真彩色、假彩色、NDVI等指数进行人工解译的方法,蓝藻提取结果受主观因素影响较大,尤其蓝藻边界区域的划分。BO-XGBoost机器学习分类算法具备一定客观性,同时该算法从光谱、纹理、光谱指数多个角度对蓝藻区域进行判别,可有效对蓝藻边界进行区分。
图5
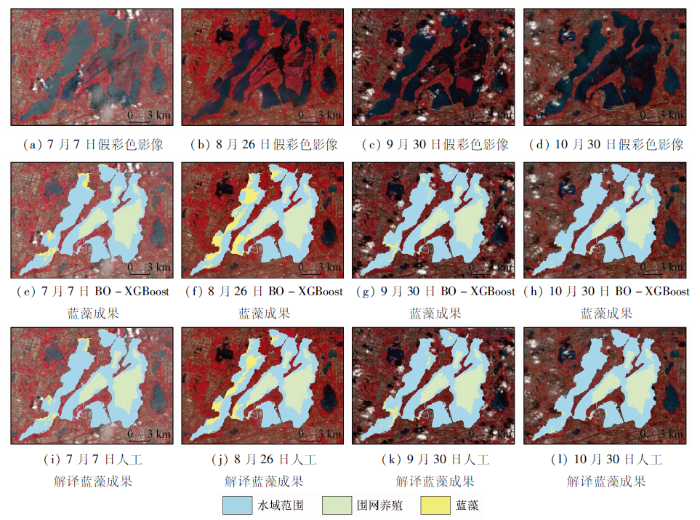
图5
2021年参与样本集构建的蓝藻识别成果对比
Fig.5
Comparison of cyanobacterial identification results participating in the construction of the sample set in 2021
图6
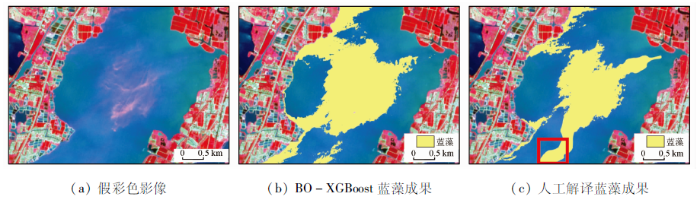
图6
8月26日蓝藻识别成果细节对比
Fig.6
Comparison of details of cyanobacteria identification results on August 26
为定量化描述BO-XGBoost分类模型与人工解译成果之间的蓝藻分类差异程度。表4展示了BO-XGBoost分类算法和人工解译提取的蓝藻面积,以及2种方法得到蓝藻区域的IoU计算结果。IoU指标存在一定差异,2种方法得到的蓝藻区域IoU高于41.31%,其中7月7日最高为55.46%,造成这种差异的主要原因在于: 人工解译进行蓝藻提取过程主要利用NDVI值和人工目视解译方法进行判别,针对不同区域不同情况下NDVI划分阈值,最后再依据人工经验对NDVI划分阈值的结果边界进行修订,最终得到蓝藻提取结果,过程中受人为主观影响因素较大。对比图5的蓝藻成果细节,IoU指标差异主要体现在以下2点: ①算法提取结果受岸边混合像元影响,岸边易被误识别为蓝藻,而人工解译结果,在人工审核过程中已经去除岸边的细碎斑点; ②由于人工解译过程,其结果受人为主观因素影响,其边界判定条件不统一,无法客观表征蓝藻提取结果。
表4 蓝藻提取面积及IoU评价指标
Tab.4
| 日期 | IoU/% | BO-XGBoost /km2 | 人工解译 /km2 |
|---|---|---|---|
| 7月7日 | 55.46 | 4.289 2 | 2.743 6 |
| 8月26日 | 41.53 | 16.521 6 | 11.235 8 |
| 9月30日 | 41.31 | 2.305 1 | 2.897 4 |
| 10月30日 | 43.28 | 0.896 8 | 0.812 4 |
综上所述,基于贝叶斯优化进行XGBoost模型超参数选取的方法,提取的超参数组合适用于遥感蓝藻分类。同时,基于光谱、指数、灰度共生矩阵为多特征输入,其训练结果,应用Sentinel-2影像数据时,与人工判读结果区域表征基本一致,蓝藻提取结果和其他地物边界区分明显。
3.2 适用性分析
表5 蓝藻提取面积及IoU评价指标
Tab.5
| 日期 | IoU/% | BO-XGBoost /km2 | 人工解译 /km2 |
|---|---|---|---|
| 6月22日 | 44.75 | 4.073 8 | 3.167 1 |
| 7月12日 | 43.85 | 3.465 3 | 1.671 9 |
| 8月31日 | 44.01 | 1.486 6 | 1.642 2 |
| 10月5日 | 50.22 | 0.585 4 | 0.678 4 |
图7
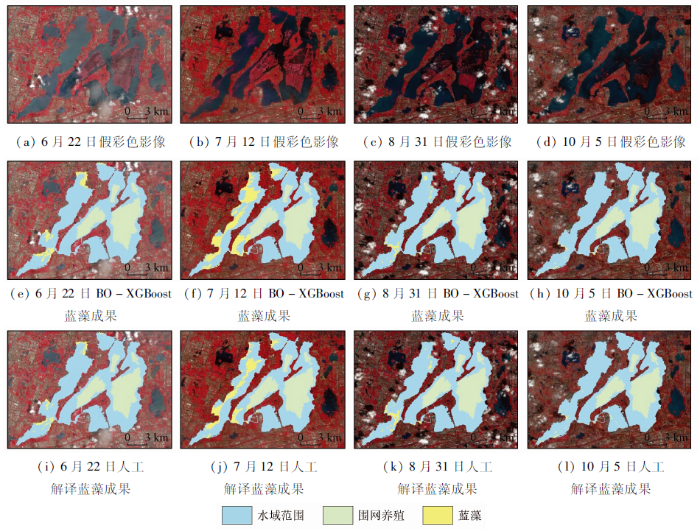
图7
2021年未参与样本集构建的蓝藻识别成果对比
Fig.7
Comparison of cyanobacterial identification results that did not participate in the construction of the sample set in 2021
4 结论
本文以江苏省苏州市阳澄湖为研究区域,利用Sentinel-2遥感图像数据以及实地踏勘情况对样本进行标注,以遥感数据特有的光谱、指数、纹理等多特征为分类模型输入,结合贝叶斯优化和XGBoost算法构建BO-XGBoost蓝藻提取模型。经实验验证该模型算法对2021年不同月份蓝藻监测具有很好的适用性,蓝藻分类准确度高达96%,实际应用中所提取的蓝藻与人工提取的蓝藻空间分布结果一致性较高,并经长时序影像数据验证该模型泛化能力强,能够适应不同月份的蓝藻提取和分类应用。
本文提出的BO-XGBoost训练模式,可自动确定XGBoost模型最优超参数组合,且该参数组合能够在提升模型精度的同时,避免模型过拟合和欠拟合情况发生。结合遥感影像优势,以光谱、指数、灰度共生矩阵多特征为输入进行模型训练,其蓝藻提别结果与其他地物边界区分明显,蓝藻提取区域与人工解译区域基本一致。表明本文所提方法能够有效对湖泊蓝藻进行自动有效提取。
本文虽然利用贝叶斯优化、XGBoost、多特征进行湖泊蓝藻信息提取,同时验证了在相同区域其他时相遥感影像数据蓝藻信息提取的有效性,但仍存在不足之处在于,该蓝藻识别模型是否可直接应用于其他湖泊进行蓝藻信息提取有待验证; 输入多特征进行模型训练时,光谱、指数、灰度共生矩阵包含的14类特征哪一类特征更能表征蓝藻分布情况,并未进行验证。后续工作将针对其他湖泊区域进行实验以验证模型的泛化能力,另外基于基尼指数、卡方检验等方法对特征重要性进行评价。
参考文献
城市闸控河流浮游植物群落结构特征及影响因素
[J].
Phytoplankton community characteristics and influencing factors of the urban gate-controlled rivers
[J].
基于多源信息的水资源立体监测研究综述
[J].
A review on water resources stereoscopic monitoring systems based on multisource data
[J].
Sentinel-2A影像珠海市污染水体识别
[J].
Water pollution identification in Zhuhai City based on Sentinel-2A imagery
[J].
浒苔遥感监测研究进展
[J].
Advances in the monitoring of Enteromorpha prolifera using remote sensing
[J].
Mapping macroalgal blooms in the Yellow Sea and East China Sea using HJ-1 and Landsat data:Application of a virtual baseline reflectance height technique
[J].DOI:10.1016/j.rse.2016.02.065 URL [本文引用: 2]
环境一号卫星多光谱数据在巢湖动态监测中的应用
[J].
Application of environmental satellite HJ1A/1B-CCD data for Cyanobacteria dynamic monitoring in Chaohu Lake
[J].
A novel ocean color index to detect floating algae in the global oceans
[J].DOI:10.1016/j.rse.2009.05.012 URL [本文引用: 1]
Remote sensing of harmful algal blooms variability for Lake Hulun using adjusted FAI (AFAI) Algorithm
[J].
Land cover change assessment using decision trees,support vector machines and maximum likelihood classification algorithms
[J].
DOI:10.1016/j.jag.2009.11.002
[本文引用: 1]

Land cover change assessment is one of the main applications of remote sensed data A number of pixel based classification algorithms have been developed over the past years for the analysis of remotely sensed data The most notable Include the maximum likelihood classifier (MLC). Support vector machines (SVMs) a:id the decision trees(DTs) The DTs in particular offer advantages not provided by other approahces They are computationally fast and make no statistical assumptions regarding the distribution Of data The challenge 10 using DTs lies in the determination of the "best" tree Structure and the decision boundaries Recent developments in the field of data mining have however, provided all alternative for overcoming the above shortcomings In this study, we analysed the potential of DTs as one technique for data mining for the analysis of the 1986 and 2001 Landsat TM and ETM+ datasets, respectively The results were compared with those obtained using SVMs. and MLC Overall. acceptable accuracies of over 85% were obtained in all the cases In general, the DTs performed better than both MLC and SVMs (C) 2009 Elsevier B V All rights reserved
基于RF算法优选多时相特征的冬小麦空间分布自动解译
[J].
Automatic interpretation of spatial distribution of winter wheat based on random forest algorithm to optimize multi-temporal features
[J].
支持向量机与分类后验概率空间变化向量分析法相结合的冬小麦种植面积测量方法
[J].
Method of winter wheat planting area estimation based on support vector machine and post-classification changed vector analysis
[J].
变端元混合像元分解冬小麦种植面积测量方法
[J].
The application of the dynamic endmember linear spectral unmixing model to winter wheat area estimation
[J].
一种提取南黄海浒苔的自适应阈值遥感算法
[J].
An adaptive threshold algorithm for detecting ulva prolifera in southern Yellow Sea by remote sensing
[J].
XGBoost:A scalable tree boosting system
[C]//
基于OLCI数据的福建近海悬浮物浓度遥感反演
[J].
Retrieving total suspended matter concentration in Fujian coastal waters using OLCI data
[J].
基于显著性图像与纹理特征的遥感影像云检测
[J].
Cloud detection of remote sensing images based on significance maps and texture features
[J].
无人机遥感与XGBoost的红树林物种分类
[J].
Mangrove species classification with UAV-based remote sensing data and XGBoost
[J].
一种利用贝叶斯优化的弹道目标微动分类网络
[J].
Ballistic target fretting classification network based on Bayesian optimization
[J].
苏州湖泊水源地浮游植物群落特征及营养状况分析
[J].
An analysis of the phytoplankton community characteristics and nutrition status in lake-type drinking water sources in Suzhou
[J].
基于Sentinel-2遥感时间序列植被物候特征的盐城滨海湿地植被分类
[J].
DOI:10.11821/dlxb202107008
[本文引用: 1]
滨海湿地是具有重要功能的特殊海陆过渡带生态系统,精准获取滨海湿地植被时空分布信息具有重要意义。传统的湿地遥感观测研究集中于高空间、高光谱分辨率影像分类,往往受限于数据成本和覆盖范围,仅适用于小区域湿地监测。Sentinel-2A/B卫星影像时空分辨率高且免费共享,为大区域滨海湿地动态监测提供了可能。本文采用2018年Sentinel-2影像,提出像元级SAVI时间序列及双Logistic植被物候特征拟合重构模型,采用随机森林算法进行盐城滨海湿地植被分类,探讨Sentinel-2遥感时间序列植被物候特征分类方法的适用性。结果显示,分类总体精度达87.61%,Kappa系数为0.8358,分类结果与湿地实况相吻合,比常规单一时相分类精度总体提高19.57%。植被判别物候特征参数可为影像数据缺失或不足的滨海湿地分类提供不同植被的判别依据。研究表明,基于像元级时间序列植被物候特征的分类方法能实现植被群落混生带的精准分类以及对“异物同谱”植被的有效区分,对大区域滨海湿地植被分类具有很好的适用性,有效提高了滨海湿地植被分类精度。
Classification of Yancheng coastal wetland vegetation based on vegetation phenological characteristics derived from Sentinel-2 time-series
[J].
DOI:10.11821/dlxb202107008
[本文引用: 1]
Coastal wetlands are special land-sea transitional ecosystems with important functions. It is of great significance to obtain the spatiotemporal distribution data of coastal wetland vegetation accurately. Previous wetland mapping studies focusing mainly on high spatial and spectral resolution images often have difficulties such as high data acquisition costs and limited coverage, so these methods are only suitable for small regions. Sentinel-2A/B satellite images with high spatial and temporal resolution and free sharing, make it possible for us to dynamically monitor large-area coastal wetlands. Based on Sentinel-2 images in 2018, this study proposed the pixel-level SAVI time series and double logistic vegetation phenological feature fitting reconstruction model, used a random forest algorithm to classify Yancheng coastal wetland vegetation in Jiangsu, East China, and then discussed the applicability of vegetation phenological characteristics (VPC) classification method. The results show that the overall accuracy of mapping based on VPC was 87.61%, which was 19.57% higher than that of the conventional single image classification, and the results were consistent with the actual distribution of wetlands. The vegetation discriminant phenological parameters can provide the basis for differentiating various types of vegetation, which can be applied to coastal wetland classification in the case of missing or insufficient image data. The phenological parameters have improved the method based on VPC, which can be applied to the rapid and accurate extraction of coastal vegetation and also provides new ideas to solve the problem of insufficient data in coastal wetland classification research. The method based on VPC in the pixel-level time series can achieve the accurate classification of the mixed zone of vegetation communities and the effective differentiation of "the same spectrum with different objects", which is applicable to the coastal wetland classification in large regions and improves the mapping accuracy of coastal wetland vegetation effectively.
Urban impervious surface extraction based on multi-features and random forest
[J].DOI:10.1109/Access.6287639 URL [本文引用: 1]
Algorithms for hyper-parameter optimization
[J].
Bayesian optimization for genomic selection:A method for discovering the best genotype among a large number of candidates
[J].DOI:10.1007/s00122-017-2954-9 URL [本文引用: 1]
Gaussian processes for machine learning
[J].Gaussian processes (GPs) are natural generalisations of multivariate Gaussian random variables to infinite (countably or continuous) index sets. GPs have been applied in a large number of fields to a diverse range of ends, and very many deep theoretical analyses of various properties are available. This paper gives an introduction to Gaussian processes on a fairly elementary level with special emphasis on characteristics relevant in machine learning. It draws explicit connections to branches such as spline smoothing models and support vector machines in which similar ideas have been investigated. Gaussian process models are routinely used to solve hard machine learning problems. They are attractive because of their flexible non-parametric nature and computational simplicity. Treated within a Bayesian framework, very powerful statistical methods can be implemented which offer valid estimates of uncertainties in our predictions and generic model selection procedures cast as nonlinear optimization problems. Their main drawback of heavy computational scaling has recently been alleviated by the introduction of generic sparse approximations.13,78,31 The mathematical literature on GPs is large and often uses deep concepts which are not required to fully understand most machine learning applications. In this tutorial paper, we aim to present characteristics of GPs relevant to machine learning and to show up precise connections to other "kernel machines" popular in the community. Our focus is on a simple presentation, but references to more detailed sources are provided.
Bayesian optimization of personalized models for patient vital-sign monitoring
[J].
DOI:10.1109/JBHI.2017.2751509
PMID:29505398
[本文引用: 2]
Gaussian process regression (GPR) provides a means to generate flexible personalized models of time series of patient vital signs. These models can perform useful clinical inference in ways that population-based models cannot. A challenge for the use of personalized models is that they must be amenable to a wide range of parameterizations, to accommodate the plausible physiology of any patient in the population. Additionally, optimal performance is typically achieved when models are regularized in light of the knowledge of the physiology of the individual patient. In this paper, we describe a method to build GP models with varying complexity (via covariance kernels) and regularization (via fixed priors over hyperparameters) on a patient-specific level, for the purpose of robust vital-sign forecasting. To this end, our results present evidence in support of two main hypotheses: 1) the use of patient-specific models can outperform population-based models for useful clinical tasks, such as vital-sign forecasting; and 2) the optimal values of (hyper)parameters of these models are best determined by sophisticated methods of optimization, due to high correlation between dimensions of the search space. The resulting models are sufficiently robust to inform clinicians of a patient's vital-sign trajectory and warn of imminent deterioration.
基于遥感数据的太湖蓝藻水华信息识别方法
[J].
Extraction methods of cyanobacteria bloom in Lake Taihu based on RS data
[J].
多源卫星遥感数据监测巢湖蓝藻水华爆发研究
[J].
Using multi-source satellite imagery data to monitor cyanobacterial blooms of Chaohu Lake
[J].
基于Sentinel-2遥感影像的巢湖蓝藻水华提取方法研究
[J].
DOI:10.16258/j.cnki.1674-5906.2021.01.017
[本文引用: 1]
可下载PDF全文。
Extraction of cyanobacteria bloom in Chaohu Lake based on Sentinel-2 remote sensing images
[J].
