

0 引言
实现海岸线信息准确、快速提取是海岸线研究的关键。在长期的海岸线监测中,传统的人工实地测量方法通常存在耗时长、时效性差、人工成本高等问题,而且易受到复杂地理环境条件的制约[5]。相对而言,遥感具有覆盖范围广、重访周期短、获取成本低等优势,逐渐成为海岸线监测的重要技术手段。海岸线提取方法可分为目视解译和自动提取[6⇓-8]。目视解译主要根据遥感影像解译标志,采用人机交互的方式识别海岸线[9],该方法对研究人员的海岸识别技能要求高,且容易受到主观因素的影响,难以满足大规模、长时间序列的海岸线信息提取。自动提取方法依靠影像地物光谱特征差异识别海岸线,相比目视解译方法,其普适性和时效性更好,成为海岸线遥感提取的重要手段[10- 11]。
基于遥感影像的海岸线自动提取方法主要有影像分类、图像处理和指数阈值分割等方法[12⇓-14]。影像分类利用监督或无监督的分类方法[15-16]对沿海地区土地覆盖类型进行划分,能够获得较高的海岸线精度和属性信息,但其精度会受到分类器选择以及样本点选取的影响。图像处理方法主要包括边缘活动轮廓模型和边缘检测算子模型[17-18],通过检测图像中灰度变化最明显的点获取边缘信息,当水陆边缘特征不清晰时,该方法得到的分割效果不理想。指数阈值分割方法利用光谱指数,通过选择适当的阈值对水体和其他地物进行区分,从而获取水体边界。常见的用于水体提取的指数包括归一化水体指数 (normalized difference water index,NDWI)、修 正 归 一 化 水 体 指 数 (modified normalized difference water index,MNDWI) 和陆表水指数 (land surface water index,LSWI) [19⇓⇓⇓-23]。Cao等[24]基于Landsat影像,使用MNDWI阈值并结合像元出现频率实现对水体、陆地以及潜在潮滩的划分,确定详细的海岸动态变化; Guo[25]使用NDWI,MNDWI和Otsu阈值算法,得到水体和非水体二值化图像,通过Canny边缘检测提取水体边界。相比影像分类和图像处理方法,指数阈值分割简单高效、易于实现,更适合于长时间序列数据处理。
杭州湾作为中国经济高度发达的地区之一,城市化水平高,人口密度高,沿岸湿地资源丰富,具有重要的生态和经济价值[26]。随着经济的快速发展,杭州湾地区空间格局发生变化,对海岸线造成影响。Chu 等[27]使用1985—2018年Landsat影像并结合夜间灯光数据监测杭州湾海岸线变化和人类活动,发现在热点地区,人类活动显著增加并且海岸线移动达到5 km以上,揭示了人类活动对海岸线的影响; Wang等[28]使用1976—2015年多时相Landsat数据,分析杭州湾宁波地区海岸线时空变化特征,结果表明海岸线形态由曲折转换为平直,且海岸线年平均净移动达到85 m/a,向海一侧不断推进。针对长时间序列的杭州湾海岸线变化分析,多数研究基于若干时间节点(例如监测周期为5 a或10 a)的遥感影像展开,往往易丢失连续变化的信息,难以准确反映海岸线的精细变化特征。
因此,本研究基于Google Earth Engine(GEE)平台,提出光学遥感影像的水体指数时间序列重构方法,获得高频次的长时间序列水体指数数据集,通过Otsu算法进行水陆分割,实现长时间序列杭州湾海岸线自动提取,并使用专业的数字化海岸线分析系统,深入分析海岸线特征,对海岸线时空演变特征进行研究。
1 研究区及其数据源
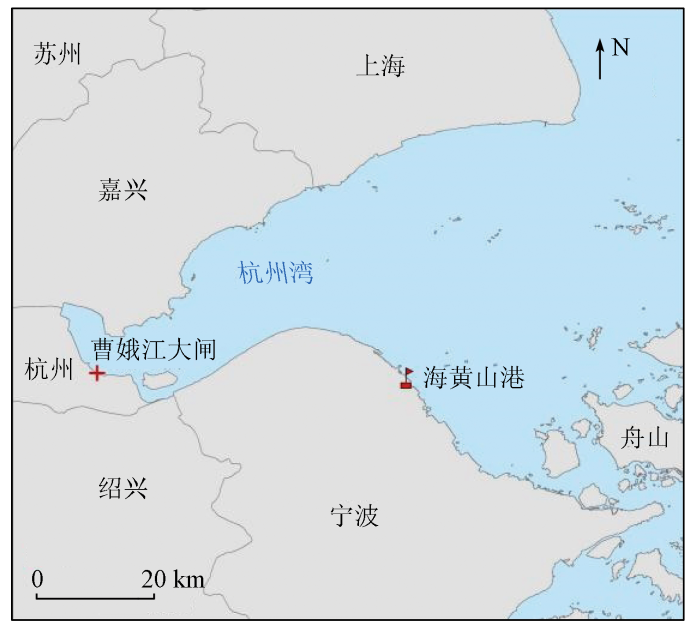
1.1 研究区概况
图1
1.2 数据源
表1 用于海岸线提取的Landsat影像
Tab.1
| 序号 | 传感器 | 获取时间 | 高潮位/cm | 时间① | 序号 | 传感器 | 获取时间 | 高潮位/cm | 时间 | |
|---|---|---|---|---|---|---|---|---|---|---|
| 1 | TM | 1990/08/14(09: 45: 22) | 272 | 06: 01 | 16 | TM | 2005/06/04(10: 12: 51) | 324 | 11: 24 | |
| 2 | TM | 1991/09/18(09: 49: 21) | 252 | 08: 50 | 17 | TM | 2006/06/23(10: 18: 07) | 287 | 10: 31 | |
| 3 | TM | 1992/10/22(09: 46: 50) | 319 | 09: 43 | 18 | TM | 2007/07/12(10: 19: 06) | 287 | 10: 31 | |
| 4 | TM | 1993/06/03(09: 47: 57) | 350 | 11: 42 | 19 | TM | 2008/07/14(10: 12: 16) | 278 | 10: 22 | |
| 5 | TM | 1994/05/05(09: 45: 06) | 326 | 08: 09 | 20 | TM | 2009/08/18(10: 14: 45) | 305 | 10: 53 | |
| 6 | TM | 1995/07/11(09: 30: 25) | 300 | 12: 23 | 21 | TM | 2010/08/21(10: 15: 43) | 274 | 10: 09 | |
| 7 | TM | 1996/06/11(09: 37: 59) | 315 | 09: 46 | 22 | TM | 2011/08/08(10: 14: 18) | 287 | 06: 02 | |
| 8 | TM | 1997/07/16(09: 55: 54) | 278 | 10: 22 | 23 | ETM+ | 2012/05/14(10: 20: 08) | 327 | 07: 15 | |
| 9 | TM | 1998/08/04(10: 03: 45) | 287 | 11: 33 | 24 | ETM+ | 2013/07/20(10: 20: 45) | 287 | 11: 33 | |
| 10 | TM | 1999/08/23(10: 02: 52) | 296 | 11: 17 | 25 | OLI | 2014/07/31(10: 25: 21) | 373 | 15: 23 | |
| 11 | ETM+ | 2000/06/14(10: 17: 16) | 294 | 10: 40 | 26 | OLI | 2015/07/18(10: 24: 58) | 329 | 14: 22 | |
| 12 | ETM+ | 2001/07/03(10: 14: 45) | 294 | 10: 40 | 27 | OLI | 2016/07/04(10: 25: 16) | 318 | 12: 57 | |
| 13 | ETM+ | 2002/07/22(10: 13: 40) | 287 | 11: 33 | 28 | OLI | 2017/07/07(10: 25: 12) | 300 | 12: 23 | |
| 14 | TM | 2003/10/21(10: 03: 22) | 285 | 08: 47 | 29 | OLI | 2018/07/10(10: 24: 32) | 276 | 09: 44 | |
| 15 | TM | 2004/06/01(10: 06: 26) | 350 | 11: 42 | 30 | OLI | 2019/07/29(10: 25: 26) | 283 | 10: 02 |
①高潮位及对应时间来自于海黄山港。
2 研究方法
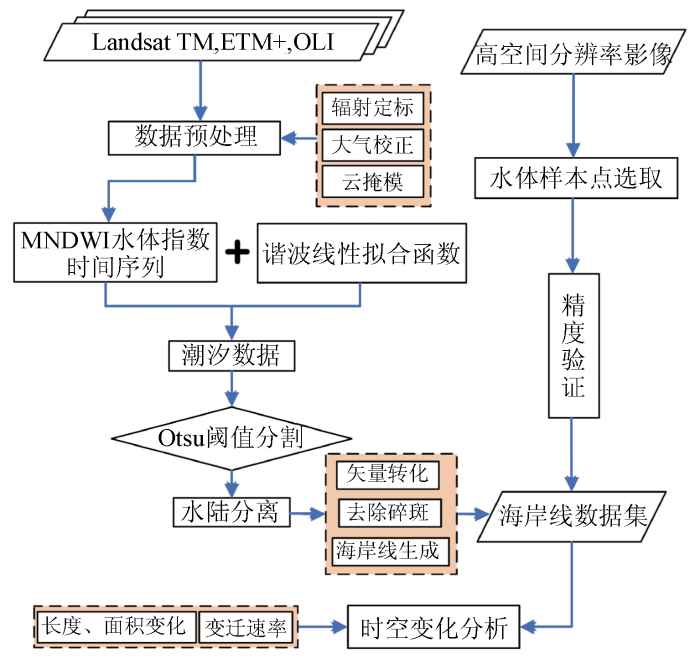
本研究把遥感成像时刻的水陆边界线定义为海岸线,使用1990—2019年Landsat数据,基于指数阈值分割方法进行杭州湾海岸线信息提取,并对其进行时空演变分析。首先,基于像素计算MNDWI,并使用时间序列谐波分析 (harmonic analysis of time series,HANTS) 对MNDWI时间序列数据进行重构; 其次,使用Otsu算法确定阈值区分水体和陆地以获取水体边界; 然后,利用ArcGIS 10.4软件进行矢量转换和后处理; 最后,基于生成的海岸线进行时空变化分析。具体技术路线如图2所示。
图2
2.1 海岸线遥感提取
基于Landsat影像计算MNDWI对陆地和水体进行区分,该方法优于NDWI,在海岸线提取方面得到广泛应用[33]。其计算公式为:
式中
HANTS[34]是一种基于快速傅里叶变换改进的算法,通过傅里叶变换和最小二乘法拟合,可以有效去除异常值。本研究使用HANTS对MNDWI时间序列数据进行重构,去除1990—2019年期间的异常观测值,并通过拟合填补云掩模生成的空洞。
2.2 海岸线时空变化分析
式中: NSM为最远年份和最近年份的海岸线距离海岸线基线距离,m; SP为最近年份与最远年份之间的时间间隔,a。
LRR通过将最小二乘法拟合剖面线与海岸线相交的点来确定,计算海岸线的变化速率。线性回归方法使用所有的数据,不考虑趋势和准确性的变化。计算公式为:
式中:
3 结果与分析
3.1 海岸线提取结果精度评价
图3
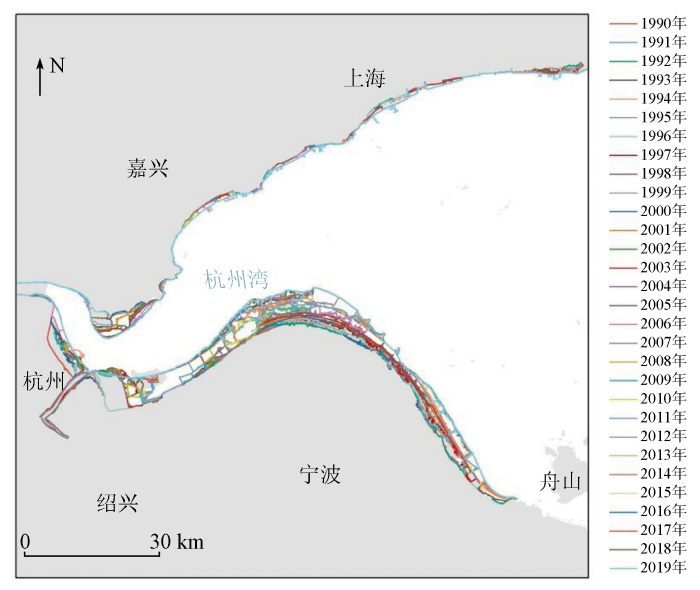
图3
1990—2019年杭州湾海岸线分布
Fig.3
Distribution of coastlines over the Hangzhou Bay from 1990 to 2019
表2 海岸线提取结果精度评价
Tab.2
| 年份 | 样本个 数/个 | 大于2像 元个数 (>60 m)/个 | 小于1像 元个数 (<30 m)/个 | 平均 误差/m | 准确 度/% |
|---|---|---|---|---|---|
| 1990年 | 100 | 4 | 92 | 26.41 | 92 |
| 2000年 | 100 | 7 | 92 | 24.88 | 92 |
| 2010年 | 100 | 7 | 91 | 23.53 | 91 |
| 2019年 | 100 | 4 | 96 | 20.78 | 96 |
3.2 海岸线时空演变分析
3.2.1 1990—2019年海岸线长度及面积变化分析
1990—2019年的杭州湾海岸线长度、长度变化、所围陆域面积和面积变化情况如图4所示。在研究时间段内,杭州湾海岸线长度从1990年的479.12 km增加到2019年的499.81 km,增加了20.69 km,增长率为4.32%,年均增长率约为0.14%。海岸线整体呈现增长趋势,但增长速率缓慢,年际间长度变化幅度大。从海岸线长度变化情况来看,海岸线长度增加主要发生在2003—2004年、2010—2011年、2012—2013年和2014—2015年,增加分别为40.78 km,32.58 km,19.81 km和24.91 km; 海岸线长度缩减主要发生在1998—1999年、2007—2008年、2009—2010年、2011—2012年和2017—2018年,分别减少了17.93 km,32.49 km,18.58 km,38.26 km和27.97 km。在面积方面,1990—2019年杭州湾海岸线所围成的陆域面积呈显著的增长趋势,从1990年的7 202.76 km2增加到2019年的7 967.57 km2,共增加了约764.81 km2,增长率为10.62%,年均增加速率为0.35%。其中,面积增加较大的年份主要发生在1996—1997年、2003—2004年、2005—2006年和2011—2012年,分别为94.48 km2,69.71 km2,64.30 km2和76.85 km2; 极少数面积减小的年份主要发生在1994—1995年、1998—1999年、2002—2003年和2018—2019年,分别为17.35 km2,4.73 km2,2.76 km2和1.54 km2。
图4
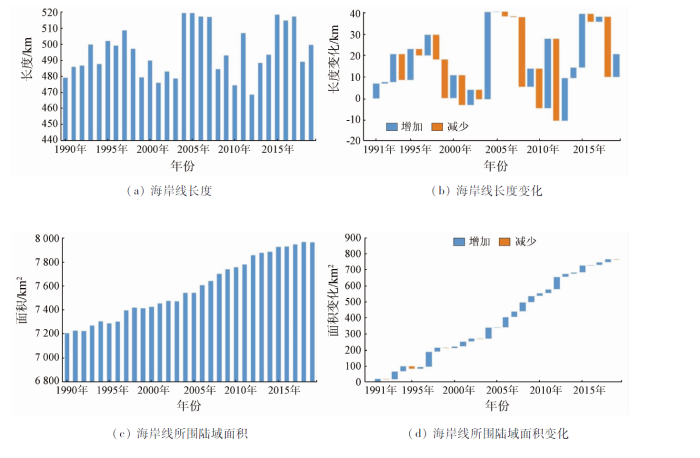
图4
1990—2019年杭州湾海岸线长度和面积变化
Fig.4
Changes of line length and area in Hangzhou Bay from 1990 to 2019
海岸线扩张或后退过程会引起海岸线的海陆格局发生变化,陆地向海洋扩张表现为陆地面积增加,称为淤积,海洋向陆地退却表现为陆地面积减少,称为侵蚀。陆地面积的变化可以反映海岸线变化的方向和幅度。本文研究了1990—2019年间杭州湾陆域面积的变化,并根据陆域面积变化情况,分阶段对杭州湾海岸线海陆格局的时空变化进行分析,结果如图5所示。在整个研究时间段内,杭州湾区域基本处于淤积状态,尤其以南岸为主,北岸基本保持稳定。在1998—1999年和2003—2004年,杭州湾北岸嘉兴南部区域有明显淤积。2007年曹娥江大闸枢纽工程竣工,使曹娥江区域海岸线向外扩张,出现淤积情况。从2003年开始,杭州湾南岸淤积状态显著,尤其以宁波区域为主,到2018年基本趋于稳定。
图5
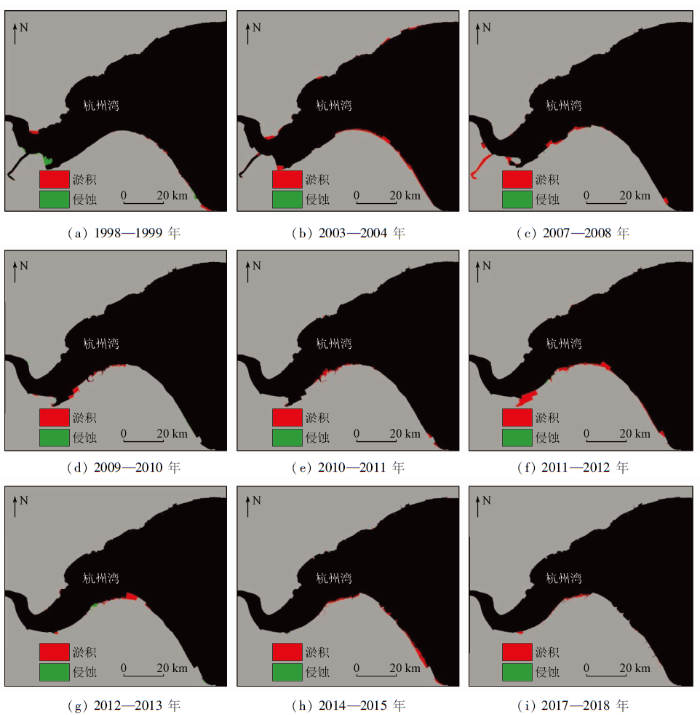
图5
1990—2019年杭州湾阶段性冲淤情况
Fig.5
Staged accretion and erosion areas over the Hangzhou Bay from 1990 to 2019
3.2.2 1990—2019年海岸线变化率分析
图6
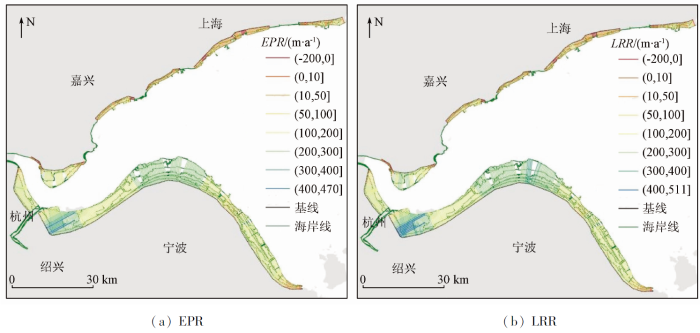
图6
1990—2019年杭州湾海岸线变化率分布
Fig.6
Distribution of coastline change rate of Hangzhou Bay from 1990 to 2019
图7
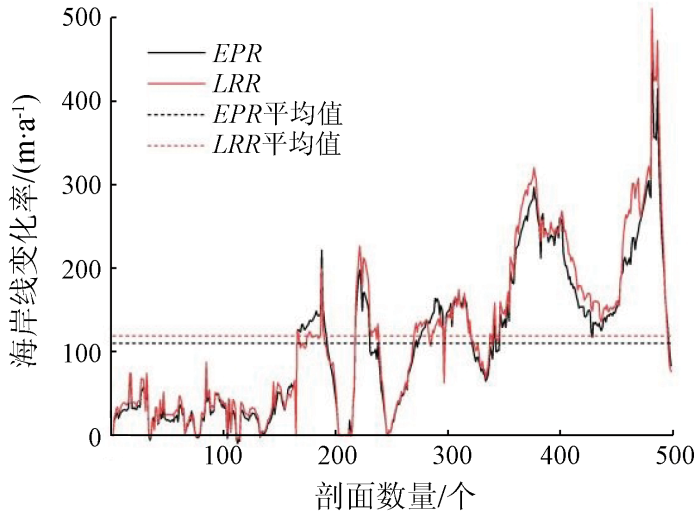
图7
1990—2019年杭州湾海岸线变化率
Fig.7
Coastline change rate of Hangzhou Bay from 1990 to 2019
为了进一步分析杭州湾海岸线的变迁,本文选取了5个重点区域进行研究(图8),分别为: ①北岸嘉兴南部区域; ②北岸嘉兴东部区域; ③北岸金山和奉贤区域; ④南岸绍兴区域; ⑤南岸宁波区域。北岸嘉兴南部区域受所处地理位置的影响,河流泥沙大量淤积,形成冲积平原的速度快。1990—2000年海岸线变化主要是由于围海造田和沿岸水产养殖业的发展造成,2000—2010年河流入海口沉积物堆积使海岸线不断向海扩张,陆地面积持续增加。2010年以后,泥沙含量减少,政府不断加强对土地资源的管理,海岸线变化趋于稳定。在北岸嘉兴东部区域,随着城市经济的发展,城市空间需求日益增加,规模性的围海造田以及海堤和港口建设使得海岸线不断向外扩张。北岸金山和奉贤区域围海造田和河流泥沙淤积加速沿岸沙洲形成,沙洲以外堤坝的修建促使海岸线不断向外扩张。但由于长江上游水利设施建设,河流下游泥沙输送量逐渐减少,使海岸线淤积速度减缓,海浪冲刷作用下该区域某些岸段出现一定程度侵蚀。南岸绍兴区域位于钱塘江和曹娥江之间,处于河流下游入海口,地形较为平坦。当河流泛滥时,泥沙在河岸两侧沉积,并逐渐形成冲积平原。两河的泥沙沉积形成了大范围的滩涂,易于开发,主要受人类活动的影响成为农田和水产养殖区域。南岸宁波区域地势低平,呈现弧形分布形态。在弧度最大,即滩涂凸起最显著地段,海岸线变化率达到峰值。受潮汐影响,杭州湾形成了“北进南出”的水沙输移特征[40⇓-42]。距离河流入海口越来越远,河口宽度放宽,流速变缓,挟带泥沙能力减弱,沉积物逐渐堆积,在南岸形成大面积滩涂。另外,在人类经济活动的影响下,水产养殖和围海造田逐渐取代自然状态。尤其是在2000年以后,为促进经济发展,满足人民生产生活需要,杭州湾新区建设加速了人工岸线的开发。围涂、丁坝群等工程建设,进一步推动海岸线向海延伸。
图8
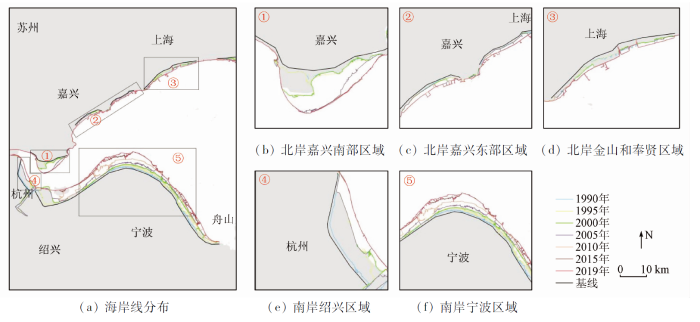
图8
1990—2019年杭州湾重点区域海岸线分布
Fig.8
Coastline distribution in key areas of Hangzhou Bay from 1990 to 2019
图9为1990—2019年间杭州湾重点区域海岸线变化率。1990—2019年北岸嘉兴南部区域海岸平均EPR和LRR分别为74.85 m/a和89.11 m/a,最大增长速率分别为197.51 m/a和226.31 m/a,最大侵蚀速率分别为-0.01 m/a和-0.56 m/a。1990—2019年北岸嘉兴东部区域海岸平均EPR和LRR分别27.40 m/a和33.26 m/a,最大增长速率分别为65.14 m/a和74.03 m/a,最大侵蚀速率分别为-5.64 m/a和-2.08 m/a。1990—2019年北岸金山和奉贤区域海岸平均EPR和LRR分别为22.23 m/a和27.32 m/a,最大增长速率分别为72 m/a和87.27 m/a, 最大侵蚀速率分别为-9.91 m/a和-4.78 m/a。1990—2019年南岸绍兴区域海岸平均EPR和LRR分别为119.22 m/a和106.50 m/a,最大增长速率为221.45 m/a和199.27 m/a。相比北岸嘉兴南部区域,由于其特殊的地理位置和城市发展进程,变化速率更快。1990—2019年南岸宁波区域海岸平均EPR和LRR分别为167.58 m/a和178.01 m/a,最大增长速率分别为296.66 m/a和320.21 m/a,变化速率普遍较快。
图9
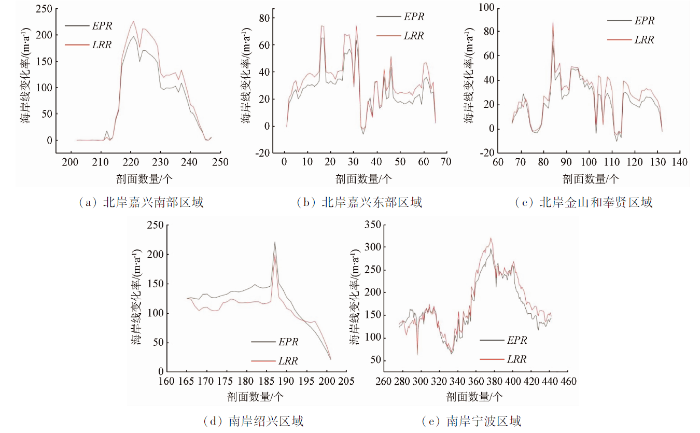
图9
1990—2019年杭州湾重点区域海岸线变化率
Fig.9
Change rate of coastline in key areas of Hangzhou Bay from 1990 to 2019
4 讨论
4.1 河流输沙量的影响
从总体发展趋势来看,河流泥沙输送量将随着人类活动的增强而逐渐减少。为进一步了解河流径流量和输沙量对海岸线的影响,收集了杭州湾兰溪水文站(
图10
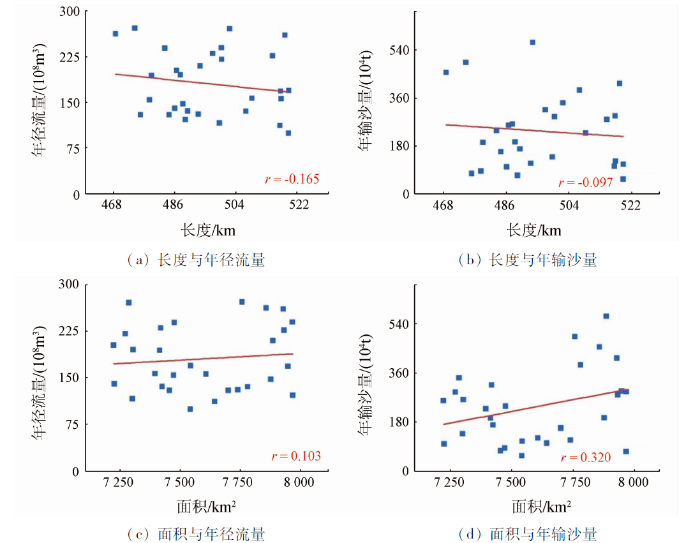
图10
1990—2019年杭州湾年径流量、年输沙量、海岸线长度、面积相关性
Fig.10
Correlation of water discharge, sediment load, coastline length and area in Hangzhou Bay from 1990 to 2019
4.2 人为活动的影响
根据杭州湾经济发展状况和城市规划要求,土地围垦的利用方式在不同区域有所不同。在杭州湾北岸嘉兴东部以及上海(金山区和奉贤区)土地扩张的主要利用方式是港口、海堤以及少数的养殖池塘建设,而北岸嘉兴尖山区域和南岸大部分区域土地围垦的主要利用方式是耕地、水产养殖和丁坝群建设。
大坝建设也是造成海岸线变化的一个重要因素。如上所述,大坝会对自然状态下河流物质输送造成干扰,而河流泥沙输送会影响海岸线变化。长江三峡水利工程及钱塘江流域建成的18个以上中大型水库,在一定程度上都使得输海泥沙通量减少、河口地区泥沙浓度下降。
除土地围垦和大坝建设外,政府政策也是海岸线变化的一个潜在因素。2001年宁波市提出建设杭州湾新区,2003年国家提出长三角区域一体化发展战略。杭州湾作为长三角城市群重要区域之一,存在着巨大的发展潜力。为了提供更多空间资源促进经济快速发展,自然岸线越来越多地转变为人工岸线。由此可以看出,海岸带区域方针政策的实施,会影响土地资源的需求,加速海岸线改造,从而导致海岸线变化。
5 结论
本研究提出MNDWI时间序列重构结合Otsu阈值分割方法进行海岸线信息提取,利用Landsat数据的时序特征,实现了长时间序列的海岸线信息提取。同时,使用高空间分辨率Google Earth影像对海岸线提取结果进行了验证,证明了本研究海岸线精度的可靠性。
结果表明,杭州湾地区海岸线时空变化复杂,淤积与侵蚀现象并存,而近30 a来,向海扩张是海岸线变化的主要模式,尤其是在杭州湾南岸。在整个研究时间段内,杭州湾海岸线长度从1990—2019年增加了20.69 km,增长率为4.32%,杭州湾地区面积从1990—2019年共增加了约764.81 km2,增长率为10.62%。与自然因素相比(如河流沉积物的减少),人为活动对杭州湾滩涂的开发(土地围垦和港口建设)是杭州湾海岸线变化的重要驱动因素。
本研究虽然实现了长时间序列的海岸线信息提取,并进行了时空变化分析,但仍然存在一些问题有待于进一步研究: ①杭州湾南岸以含水量高的滩涂区域为主,易与水体混分,仅依靠单一的水体指数阈值分割不能满足复杂地物水陆分离的需求。因此,更加精确地提取淤泥质滩涂区域海岸线将是下一步研究工作的重点; ②为进一步分析人类活动对杭州湾海岸线变化产生的作用,可考虑将海岸线类型划分与海岸线分形维数计算相结合来分析海岸线的复杂性。
参考文献
Automatic detection of shoreline change on coastal Ramsar wetlands of Turkey
[J].DOI:10.1016/j.oceaneng.2011.05.006 URL [本文引用: 1]
Spatiotemporal change patterns of coastlines in Zhejiang Province,China,over the last twenty-five years
[J].DOI:10.3390/su10020477 URL [本文引用: 1]
Spatial-temporal characteristics of coastline changes in Indonesia from 1990 to 2018
[J].
DOI:10.3390/su12083242
URL
[本文引用: 1]

As a valuable resource in coastal areas, coastlines are not only vulnerable to natural processes such as erosion, siltation, and disasters, but are also subjected to strong pressures from human processes such as urban growth, resource development, and pollution discharge. This is especially true for reef nations with rich coastline resources and a large population, like Indonesia. The technical joint of remote sensing (RS) and geographic information system (GIS) has significant advantages for monitoring coastline changes on a large scale and for quantitatively analyzing their change mechanisms. Indonesia was taken as an example in this study because of its abundant coastline resources and large population. First, Landsat images from 1990 to 2018 were used to obtain coastline information. Then, the index of coastline utilization degree (ICUD) method, the changes in land and sea patterns method, and the ICUD at different scales method were used to reveal the spatiotemporal change pattern for the coastline. The results found that: (1) Indonesia’s total coastline length has increased by 777.40 km in the past 28 years, of which the natural coastline decreased by 5995.52 km and the artificial coastline increased by 6771.92 km. (2) From the analysis of the island scale, it was known that the island with the largest increase in ICUD was Kalimantan, at the expense of the mangrove coastline. (3) On the provincial scale, the province with the largest change of ICUD was Sumatera Selatan Province, which increased from 100 in 1900 to 266.43 in 2018. (4) The change trend of the land and sea pattern for the Indonesian coastline was mainly expanded to the sea. The part that eroded to the land was relatively small; among which, Riau Province had the most significant expansion of land area, about 177.73 km2, accounting for 23.08% of the increased national land area. The worst seawater erosion was in the Jawa Barat Province. Based on the analysis of population and economic data during the same period, it was found that the main driving mechanism behind Indonesia’s coastline change was population growth, which outweighed the impact of economic development. However, the main constraint on the Indonesian coastline was the topographic factor. The RS and GIS scheme used in this study can not only provide support for coastline resource development and policy formulation in Indonesia, but also provide a valuable reference for the evolution of coastline resources and environments in other regions around the world.
Problems and countermeasures of coastline protection and utilization in China
[J].DOI:10.1016/j.ocecoaman.2017.12.016 URL [本文引用: 1]
基于遥感影像的海岸线提取方法综述
[J].
DOI:10.12082/dqxxkx.2018.180152
[本文引用: 1]
近年来,全球气候变暖等原因导致海平面不断升高,人类对海岸带的开发也越来越频繁,海岸带的变化比以前更为活跃,因此精确快速地提取出海岸线并实时监测其变化对我国海岸带的开发规划与利用具有重要的意义。本文详细梳理了国内外利用光学遥感、微波遥感和雷达遥感手段提取瞬时水边线或理论海岸线的方法,对各种经典方法和一些近年来出现的新方法进行了分析和比较,并指出各种方法的适用情况和不足。最后,针对目前中国在此方面的研究现状给出了一些建议。
Review of coastline extraction methods based on remote sensing images
[J].
海岸线变化研究综述
[J].
Review of research on coastline changes
[J].
遥感影像的海岸线自动提取方法研究进展
[J].
Research progress on methods of automatic coastline extraction based on remote sensing images
[J].
Shoreline detection using optical remote sensing:A review
[J].
DOI:10.3390/ijgi8020075
URL
[本文引用: 1]
With coastal erosion and the increased interest in beach monitoring, there is a greater need for evaluation of the shoreline detection methods. Some studies have been conducted to produce state of the art reviews on shoreline definition and detection. It should be noted that with the development of remote sensing, shoreline detection is mainly achieved by image processing. Thus, it is important to evaluate the different image processing approaches used for shoreline detection. This paper presents a state of the art review on image processing methods used for shoreline detection in remote sensing. It starts with a review of different key concepts that can be used for shoreline detection. Then, the applied fundamental image processing methods are shown before a comparative analysis of these methods. A significant outcome of this study will provide practical insights into shoreline detection.
中国大陆海岸线近30 a的时空变化分析
[J].
Spatial and temporal of continental coastline of China in recent three decades
[J].
舟山群岛海岸线遥感信息提取及时空演变分析
[J].
Coastline extraction and spatial-temporal variations using remote sensing technology in Zhoushan Islands
[J].
Remote sensing of the coastline variation of the Guangdong-Hongkong-Macao Greater Bay Area in the past four decades
[J].
DOI:10.3390/jmse9121318
URL
[本文引用: 1]
In this study, a combination of example-based feature extraction and visual interpretation was applied to analyze the coastline variations in the Guangdong–Hong Kong–Macao Greater Bay Area (GHMGBA) from the past four decades based on the Landsat satellite remote sensing image data from 1987–2018, using ENVI and ArcGIS software. The results showed that the total length of the coastline of the GHMGBA increased in the past four decades, rising from 1291 km in 1987 to 1411 km in 2018. Among these, artificial coastline increased by 450 km, while the other coastline types decreased. The type of coastline that decreased the most was bedrock coastline, by a total of 172 km. The silty coastline disappeared, and almost all of it was converted to artificial coastline. Variations in the coastline of the GHMGBA were mainly connected to human activities and showed an overall trend of advancing towards the ocean. Dynamic monitoring of coastline variations can provide a reference for the protection of natural resources, sustainable marine development and rational planning of the coastal zone.
Sub-annual to multi-decadal shoreline variability from publicly available satellite imagery
[J].DOI:10.1016/j.coastaleng.2019.04.004 URL [本文引用: 1]
Shoreline extraction in SAR image based on advanced geometric active contour model
[J].
DOI:10.3390/rs13040642
URL
[本文引用: 1]
Rapid and accurate extraction of shoreline is of great significance for the use and management of sea area. Remote sensing has a strong ability to obtain data and has obvious advantages in shoreline survey. Compared with visible-light remote sensing, synthetic aperture radar (SAR) has the characteristics of all-weather and all-day working. It has been well-applied in shoreline extraction. However, due to the influence of natural conditions there is a problem of weak boundary in extracting shoreline from SAR images. In addition, the complex micro topography near the shoreline makes it difficult for traditional visual interpretation and image edge detection methods based on edge information to obtain a continuous and complete shoreline in SAR images. In order to solve these problems, this paper proposes a method to detect the land–sea boundary based on a geometric active contour model. In this method, a new symbolic pressure function is used to improve the geometric active-contour model, and the global regional smooth information is used as the convergence condition of curve evolution. Then, the influence of different initial contours on the number and time of iterations is studied. The experimental results show that this method has the advantages of fewer iteration times, good stability and high accuracy.
Extracting the intertidal extent and topography of the Australian coastline from a 28 year time series of Landsat observations
[J].DOI:10.1016/j.rse.2017.04.009 URL [本文引用: 1]
Image classification metho-ds applied to shoreline extraction on very high-resolution multispectral imagery
[J].DOI:10.1080/01431161.2014.907939 URL [本文引用: 1]
Shoreline changes along northern Ibaraki coast after the great East Japan Earthquake of 2011
[J].
DOI:10.3390/rs13071399
URL
[本文引用: 1]
In this study, we analyze the influence of the Great East Japan Earthquake, which occurred on 11 March 2011, on the shoreline of the northern Ibaraki Coast. After the earthquake, the area experienced subsidence of approximately 0.4 m. Shoreline changes at eight sandy beaches along the coast are estimated using various satellite images, including the ASTER (Advanced Spaceborne Thermal Emission and Reflection Radiometer), ALOS AVNIR-2 (Advanced Land Observing Satellite, Advanced Visible and Near-infrared Radiometer type 2), and Sentinel-2 (a multispectral sensor). Before the earthquake (for the period March 2001–January 2011), even though fluctuations in the shoreline position were observed, shorelines were quite stable, with the averaged change rates in the range of ±1.5 m/year. The shoreline suddenly retreated due to the earthquake by 20–40 m. Generally, the amount of retreat shows a strong correlation with the amount of land subsidence caused by the earthquake, and a moderate correlation with tsunami run-up height. The ground started to uplift gradually after the sudden subsidence, and shoreline positions advanced accordingly. The recovery speed of the beaches varied from +2.6 m/year to +6.6 m/year, depending on the beach conditions.
Reconstruction of reservoir and lake surface area dynamics from optical and SAR satellite imagery
[C]//
A computational approach to edge detection
[J].This paper describes a computational approach to edge detection. The success of the approach depends on the definition of a comprehensive set of goals for the computation of edge points. These goals must be precise enough to delimit the desired behavior of the detector while making minimal assumptions about the form of the solution. We define detection and localization criteria for a class of edges, and present mathematical forms for these criteria as functionals on the operator impulse response. A third criterion is then added to ensure that the detector has only one response to a single edge. We use the criteria in numerical optimization to derive detectors for several common image features, including step edges. On specializing the analysis to step edges, we find that there is a natural uncertainty principle between detection and localization performance, which are the two main goals. With this principle we derive a single operator shape which is optimal at any scale. The optimal detector has a simple approximate implementation in which edges are marked at maxima in gradient magnitude of a Gaussian-smoothed image. We extend this simple detector using operators of several widths to cope with different signal-to-noise ratios in the image. We present a general method, called feature synthesis, for the fine-to-coarse integration of information from operators at different scales. Finally we show that step edge detector performance improves considerably as the operator point spread function is extended along the edge.
Coastline extraction from repeat high resolution satellite imagery
[J].
DOI:10.1016/j.rse.2019.04.010
[本文引用: 1]
This paper presents a new coastline extraction method that improves water classification accuracy by benefitting from an ever-increasing volume of repeated measurements from commercial satellite missions. The widely-used Normalized Difference Water Index (NDWI) method is tested on a sample of around 12,600 satellite images for statistical analysis. The core of the new water classification method is the use of a water probability algorithm based on the stacking of repeat measurements, which can mitigate the effects of translational offsets of images and the classification errors caused by clouds and cloud shadows. By integrating QuickBird, WorldView-2 and WorldView-3 multispectral images, the final data product provides a 2 m resolution coastline, as well as a 2 m water probability map and a repeat-count measurement map. Improvements on the existing coastline (GSHHS-the Global Self-consistent, Hierarchical, High-resolution Shoreline Database, 50 m-5000 m) in terms of resolution (2 m) is substantial, thanks to the combination of multiple data sources.
Detecting coastline change with all available Landsat data over 1986—2015:A case study for the state of Texas,USA
[J].DOI:10.3390/atmos9030107 URL [本文引用: 1]
An effective water body extraction method with new water index for Sentinel-2 imagery
[J].
DOI:10.3390/w13121647
URL
[本文引用: 1]
Surface water bodies, such as rivers, lakes, and reservoirs, play an irreplaceable role in global ecosystems and climate systems. Sentinel-2 imagery provides new high-resolution satellite remote sensing data. Based on the analysis of the spectral characteristics of the Sentinel-2 satellite, a novel water index called the Sentinel-2 water index (SWI) that is based on the vegetation-sensitive red-edge band (Band 5) and shortwave infrared (Band 11) bands was developed. Four representative water body types, namely, Taihu Lake, Yangtze River, Chaka Salt Lake, and Chain Lake, were selected as study areas to conduct a water body extraction performance comparison with the normalized difference water index (NDWI). We found that (1) the contrast value of the SWI was larger than that of the NDWI in terms of various water body types, including purer water, turbid water, salt water, and floating ice, which suggested that the SWI could achieve better enhancement performance for water bodies. (2) An effective water body extraction method was proposed by integrating the SWI and Otsu algorithm, which could accurately extract various water body types with high overall accuracy. (3) The method effectively extracted large water bodies and wide river channels by suppressing shadow noise in urban areas. Our results suggested that the novel method can achieve efficient water body extraction for rapidly and accurately extracting various water bodies from Sentinel-2 data and the novel method has application potential for larger-scale surface water mapping.
Mapping Australia’s dynamic coastline at mean sea level using three decades of Landsat imagery
[J].DOI:10.1016/j.rse.2021.112734 URL [本文引用: 1]
Monitoring the coastline change of Hatiya Island in Bangladesh using remote sensing techniques
[J].DOI:10.1016/j.isprsjprs.2014.12.009 URL [本文引用: 1]
Mapping changes in coastlines and tidal flats in developing islands using the full time series of Landsat images
[J].DOI:10.1016/j.rse.2020.111665 URL [本文引用: 1]
Zoning of Hangzhou Bay ecological red line using GIS-based multi-criteria decision analysis
[J].DOI:10.1016/j.ocecoaman.2017.01.013 URL [本文引用: 1]
Monitoring longterm shoreline dynamics and human activities in the Hangzhou Bay,China,combining daytime and nighttime EO data
[J].DOI:10.1080/20964471.2020.1740491 URL [本文引用: 1]
Spatiotemporal change detection of Ningbo coastline using Landsat time-series images during 1976—2015
[J].DOI:10.3390/ijgi6030068 URL [本文引用: 1]
面向对象方法和多源遥感数据的杭州湾海岸线提取分析
[J].
DOI:10.3724/SP.J.1047.2013.00262
[本文引用: 1]
本文以1983-2011 年的多源遥感数据为基础, 利用GIS 空间分析和地图代数功能, 提取杭州湾海岸线, 分析了其变迁的位置、长度, 以及增加和减少的陆地面积。结果表明:受到自然和人为因素的影响, 杭州湾南北两岸的海岸线变迁规律不同。杭州湾北岸1983-1993 年共有60.2km的海岸线向陆迁移, 最大迁移距离0.6km, 减少的陆地面积共为23.5km<sup>2</sup>。1993-2011 年由于围垦和工业填海北岸向海迁移。其中,1993-2002 年最大迁移距离3.6km, 新增陆地面积42.5km<sup>2</sup>, 2002-2011 年最大迁移距离2.9km, 新增陆地面积61.0km<sup>2</sup>。由于淤积和围垦, 杭州湾南岸海岸线不断向海迁移, 1983-1993 年、1993-2002 年和2002-2011 年向海迁移最大距离分别是1.8km、2.7km和5.1km, 新增陆地面积分别为34.3km<sup>2</sup>、230.2km<sup>2</sup>及331.7km<sup>2</sup>。海岸线向海迁移的速度越来越快, 规模越来越大。研究成果对于地图制图、滨海湿地生态资源管理, 以及海岸线保护具有十分重要的意义。
Coastline changes in Hangzhou Bay based on object-oriented method using multi-source remote sensing data
[J].DOI:10.3724/SP.J.1047.2013.001262 URL [本文引用: 1]
Economic and ecological trade-offs of coastal reclamation in the Hangzhou Bay,China
[J].DOI:10.1016/j.ecolind.2021.107477 URL [本文引用: 2]
Continuous monitoring of lake dynamics on the Mongolian Plateau using all available Landsat imagery and Google Earth Engine
[J].
DOI:10.1016/j.scitotenv.2019.06.341
[本文引用: 1]
Lakes are important water resources on the Mongolian Plateau (MP) for human's livelihood and production as well as maintaining ecosystem services. Previous studies, based on the Landsat-based analyses at epoch scale and visual interpretation approach, have reported a significant loss in the lake areas and numbers, especially from the late 1990s to 2010. Given the remarkable inter- and infra-annual variations of lakes in the aril and semi-arid region, a comprehensive picture of annual lake dynamics is needed. Here we took advantages of the power of all the available Landsat images and the cloud computing platform Google Earth Engine (GEE) to map water body for each scene, and then extracted lakes by post-processing including raster-to-vector conversion and separation of lakes and rivers. Continuous dynamics of the lakes over 1 km2 was monitored annually on the MP from 1991 to 2017. We found a significant shrinkage in the lake areas and numbers of the MP from 1991 to 2009, then the decreasing lakes on the MP have recovered since circa 2009. Specifically, Inner Mongolia of China experienced more dramatic lake variations than Mongolia. A few administrative regions with huge lakes, including Hulunbuir and Xilin Gol in Inner Mongolia and Ubsa in Mongolia, dominated the lake area variations in the study area, suggesting that the prior treatments on these major lakes would be critical for water management on the MP. The varied drivers of lake variations in different regions showed the complexity of factors impacting lakes. While both natural and anthropogenic factors significantly affected lake dynamics before 2009, precipitation played increasingly important rule for the recovery of lakes on the MP after 2009. J.V, (C) 2019 Elsevier B.V.
Google Earth Engine:Planetary-scale geospatial analysis for everyone
[J].DOI:10.1016/j.rse.2017.06.031 URL [本文引用: 1]
利用改进的归一化差异水体指数 (MNDWI) 提取水体信息的研究
[J].
A study on information extraction of water body with the modified normalized difference water index (MNDWI)
[J].
Reconstruction of global MODIS NDVI time series:Performance of harmonic analysis of time series (HANTS)
[J].DOI:10.1016/j.rse.2015.03.018 URL [本文引用: 1]
A threshold selection method from gray-level histograms
[J].DOI:10.1109/TSMC.1979.4310076 URL [本文引用: 1]
A FPGA based implementation of Sobel edge detection
[J].DOI:10.1016/j.micpro.2017.10.011 URL [本文引用: 1]
Spatiotemporal changes of coastline over the Yellow River Delta in the previous 40 years with optical and SAR remote sensing
[J].
DOI:10.3390/rs13101940
URL
[本文引用: 1]
The integration of multi-source, multi-temporal, multi-band optical, and radar remote sensing images to accurately detect, extract, and monitor the long-term dynamic change of coastline is critical for a better understanding of how the coastal environment responds to climate change and human activities. In this study, we present a combination method to produce the spatiotemporal changes of the coastline in the Yellow River Delta (YRD) in 1980–2020 with both optical and Synthetic Aperture Radar (SAR) satellite remote sensing images. According to the measurement results of GPS RTK, this method can obtain a high accuracy of shoreline extraction, with an observation error of 71.4% within one pixel of the image. Then, the influence of annual water discharge and sediment load on the changes of the coastline is investigated. The results show that there are two significant accretion areas in the Qing 8 and Qingshuigou course. The relative high correlation illustrates that the sediment discharge has a great contribution to the change of estuary area. Human activities, climate change, and sea level rise that affect waves and storm surges are also important drivers of coastal morphology to be investigated in the future, in addition to the sediment transport.
基于数字化海岸分析系统(DSAS)的海岸线变迁速率研究:以黄河三角洲和莱州湾海岸线为例
[J].
Study on the change rate of shoreline based on Digital Coastal Analysis System (DSAS):Taking the shoreline of the Yellow River Delta and Laizhou Bay as an example
[J].
杭州湾沉积物宏观输运的数值模拟
[J].
Modelling macroscale suspended sediment transport patterns in Hangzhou Bay,China
[J].
Morphodynamic modeling of a large inside sand bar and its dextral morphology in a convergent estuary:Qiantang Estuary,China
[J].
1959—2019年杭州湾南岸滩涂演变规律及机制
[J].
Evolution law and mechanism of tidal flats on the south bank of Hangzhou Bay from 1959 to 2019
[J].
Changjiang River plume and suspended sediment transport in Hangzhou Bay
[J].DOI:10.1016/0278-4343(89)90085-X URL [本文引用: 1]
The variations of sediment transport patterns in the outer Changjiang Estuary and Hangzhou Bay over the last 30 years
[J].DOI:10.1002/2016JC012264 URL [本文引用: 1]
高强度人类活动对泉州湾滨海湿地环境的影响及其对策
[J].
Effects of high-intensity human activities on the environment variations of coastal wetland in the Quanzhou Bay,China
[J].
How do modern transportation projects impact on development of impervious surfaces via new urban area and urban intensification? Evidence from Hangzhou Bay Bridge,China
[J].DOI:10.1016/j.landusepol.2018.05.059 URL [本文引用: 1]
Impacts of reclamation derived land use changes on ecosystem services in a typical gulf of eastern China:A case study of Hangzhou bay
[J].DOI:10.1016/j.ecolind.2021.108259 URL [本文引用: 1]
