

0 引言
影响消费级无人机地形建模精度的因素众多,主要可分为航线设计因素、控制测量因素和平台性能因素3个方面[9]。平台性能因素(如相机性能和GPS-IMU定位精度等)在出厂时已经确定,无法改变。在实际地形建模过程中,航线设计和控制测量相关因素是探究建模精度的重要可控因素。
航线设计方面,重叠度、相机倾角和航高是重要的设计因素。一般来说,重叠度越高越好[10],消费级无人机一般采用70%以上的重叠度。针对相机倾角,由于消费级无人机通常仅搭载单镜头,为提升作业效率,常采用“井”字形格网飞行[1]。尽管前人研究表明倾斜摄影有利于提高精度,但是其推荐使用的相机倾斜角度在10°~45°间不等[11⇓⇓⇓-15],还缺乏统一的参考依据。另外,相对航高越高,地面分辨率越低,地形建模的高程精度也越低[1]。但是,精度指标均方根误差(root mean square error,RMSE)和相对航高之比在不同研究中其比值在1∶640~1∶2 100之间不等[16-17],表明高程精度对航高的敏感性还受其他因素的影响。
控制测量方面,控制点的精度、数量和空间分布是影响摄影测量成果精度的重要因素。控制点的精度与测量手段(全站仪、静态全球导航卫星系统(global navigation satellite system,GNSS)或GNSS-实时动态差分技术(real-time kinematic,RTK)等)有关,采用的测量手段确定之后其精度水平基本固定。关于控制点分布前人针对不同的测量情景已提出了各类布设方法,通常要尽可能均匀且中心加边缘分布[18-19]。控制点数量越多越有利于精度提高,但是当控制点达到一定数量时,其测量精度的提高也有限[20],通常存在“最优”的控制点数量。但是,最优控制点数量受到哪些因素的影响还有待进一步探索。
针对上述问题,众多学者都只针对上述单一方向上进行研究,没有综合去考虑上述因素对于地形建模精度的影响。因此,针对上述问题,本文使用单镜头消费级无人机,通过设计不同摄影测量数据采集方案和控制点蒙特卡罗检验,综合探究相机倾角、相对航高和控制点布设数量对地形建模高程精度的影响,提出消费级无人机摄影测量精度优化方法。
1 研究区概况
本研究在黄土高原选取了3个典型小流域,其中T1(E110°17'3.2″,N37°33'48.8″)、T2(E110°21'45.7″,N37°35'12.8″)和T3(E109°15'6.2″,N36°44'9.7″)3个样区作为无人机摄影测量实验样区(图1)。T1和T2样区分别位于陕西省绥德县刘家坪村和王茂庄村,T3样区位于陕西省延安市安塞区寺崾崄村。3个样区均是典型的水土流失区,区域内沟壑侵蚀剧烈、地形起伏大,最大高差达200余m。同时,区域内植被稀疏,有利于开展无人机地形建模。
图1
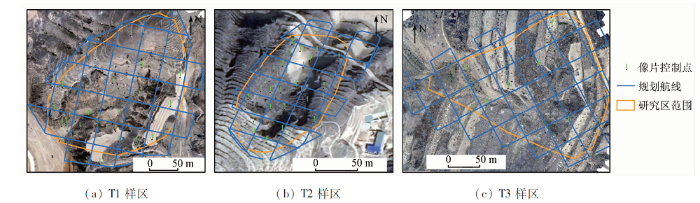
图1
研究区航线设计与控制点分布
Fig.1
Flight design and distribution of control points in the study area
2 研究方法
2.1 数据采集实验设计
技术路线如图2所示。
图2
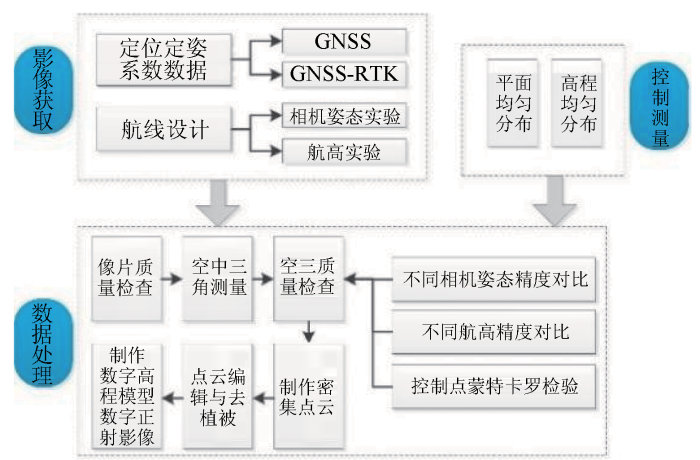
首先,设计了不同相机姿态实验和航高实验并进行无人机影像数据的采集; 其次,针对不同航高和飞行姿态的航摄影像分别进行摄影测量内业数据处理; 同时,设计了控制点蒙特卡罗检验,对比分析不同摄影条件(姿态和航高)以及控制点数量、分布和精度对最终摄影测量结果的精度影响; 最后,在对上述精度影响因素全面总结的基础上,提出消费无人机地形建模的优化方案。
表1 无人机摄影测量相机倾角实验
Tab.1
| 样区 | 相机倾角/(°) | 航高/m | 飞行 架次 | 地面分 辨率/cm |
|---|---|---|---|---|
| T1 | 0, 5, 10, 20, 30, 40, 50 | 100 | 7 | 2.7 |
| T2 | 0, 5, 10, 20, 30, 40, 50 | 70 | 7 | 1.9 |
| T3 | 0, 10, 20, 30, 40 | 80 | 5 | 2.2 |
表2 无人机摄影测量航高实验
Tab.2
| 样区 | 航高/m | 相机倾 角/(°) | 飞行 架次 | 地面分 辨率/cm |
|---|---|---|---|---|
| T1 | 60, 80, 100, 120, 140, 160 | 0 | 7 | 1.6 ~ 4.4 |
| T2 | 60, 80, 100, 120, 140, 160 | 15 | 6 | 1.6 ~ 4.4 |
2.2 数据处理与控制点蒙特卡罗检验
数据处理步骤包含航片质量检查、空中三角测量、密集点云匹配、点云分类与编辑和数字高程模型(digital elevation model,DEM)数据生成。通过在Agisoft PhotoScan软件中完成对齐照片、标记照片和相机优化等功能[22]。空中三角测量的精度检验是摄影测量过程中最重要的环节之一。之后整个项目的精度基本上已经确定。本研究重点关注空中三角测量这一环节所获得的地面控制点实际精度,以此来评价不同摄影方案所获得地面点的高程精度以及复杂地形建模的应用潜力。后续的密集点云匹配、点云分类与编辑和DEM数据生成等已经是十分成熟的技术流程,此处不再赘述。
为了验证在无地面控制点条件下消费级无人机倾斜摄影在复杂地形建模的应用潜力,分为2组实验。第一组,数据处理中不使用任何控制点参加摄影测量的光束平差过程,仅用3个控制点对空中三角测量模型进行平移、旋转和缩放; 第二组,使用一半的地面控制点参与光束平差过程优化模型精度,剩余一半的控制点作为检查点,检查模型精度。
本文将摄影测量精度达到稳定后控制点数量称为控制点饱和数。为了探索不同的相机倾角、不同航高是否影响控制点饱和数,此处使用蒙特卡罗方法[20,22]设计了控制点检测实验。控制点蒙特卡罗检验在Agisoft PhotoScan软件中执行,通过Python脚本不断重复光束平差过程。该实验主要可分为2个步骤: ①对于每一次实现,随机选择一定数量的地面控制点参与光束平差过程,剩余的点作为检查点评价模型精度; 保持每次随机选择的控制点数量不变,重复上述过程50遍,每次实现过程中记录控制点和检查点的精度; ②逐渐增加随机选择的控制点的数量并重复步骤①,分别以10%,20%,30%,40%,50%,60%,70%,80%,90%的控制点数量实现步骤①中操作。
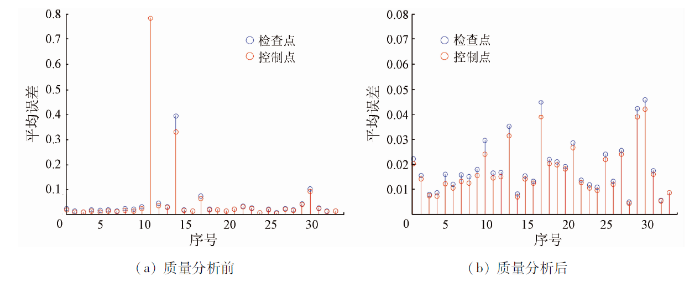
通过上述蒙特卡罗检验可以得到随着选择控制点数量的增加,控制点和检查点误差的变化情况。此外,还可以通过查看每一个地面控制点作为检查点或控制点时的平均误差,判断每个控制点的质量。若某个地面控制点不论是作为控制点还是检查点时,误差均很大,则说明该点很可能在测量过程中出现了较大误差(如电磁场干扰等),或者在刺点过程中出现了较大误差。
2.3 精度评价
精度评价采用RMSE指标进行评估。RMSE可分为平面RMSE和高程RMSE。在地形建模过程中,高程RMSE较平面RMSE更重要。因此,本文的精度评价主要指高程RMSE的评价,其公式为[23]:
式中: Xi为检查点(或控制点)i的Z坐标的测量值,即摄影测量的观测值;
由于RMSE的分布不是均一的,而是在空间上变化的。在不同地形部位的检查点,误差的大小也不尽相同。因此,还需要判断检查点的误差是否存在一定的空间分布模式。具体做法为确定好控制点的数量后,利用随机函数从所有控制点中随机选择规定数量下的点重复50次做成误差箱型图,排除偶然误差与随机误差带来的影响。
3 结果与分析
3.1 控制点质量分析
图3
3.2 相机倾角对高程精度的影响
3.2.1 高程RMSE
图4

3.2.2 误差空间分布
T1和T2样区在无地面控制点下检查点误差的空间分布如表3所示。在T1和T2样区,相机倾角为0°时,检查点误差出现了明显的空间聚集; T1样区东北方向和西南方向山脊线上出现了低值聚集,沟谷中央出现了高值聚集; T2样区东方向山脊线上出现了低值聚集,沟谷中央出现了高值聚集。说明摄影测量模型可能出现了系统误差。使用倾斜相机时,检查点误差的空间分布明显得到改善,其分布较为均匀,没有发现明显的空间聚集分布。这一结果表明,使用倾斜摄影,不仅提高了高程精度,同时还改善了误差的空间分布,一定程度上减少了系统误差。倾斜摄影对高程误差的改善可能与地形起伏和同名射线交会角有关。黄土小流域中沟壑侵蚀剧烈、地形起伏大、坡面坡度高,使用倾斜摄影时,相对于坡面区域可能更趋近于垂直摄影,此时地面控制点实际地面分辨率较均匀,误差也相对更均匀。另一方面,使用倾斜摄影时,部分同名射线的交会角变大,使加密点的解算更稳定。因此,当地形起伏度高时,使用倾斜摄影有利于提高测量精度。
表3 不同相机倾角下检查点误差的空间分布情况
Tab.3
| 样区 | 相机倾角/(°) | |||
|---|---|---|---|---|
| 0 | 10 | 30 | 40 | |
| T1 |  | |||
| T2 |  | |||
3.2.3 镜头畸变校正
倾斜摄影对高程精度的改善可能与相机畸变参数有关。消费级无人机搭载的多为非量测相机,影像畸变大且校检结果不稳定。理想情况下,经过光束平差优化之后,相机的各项畸变参数之间应当互不相关。实际应用中,各项相机畸变参数存在较强的相关性。T1和T2样区中不同相机倾角下的相机畸变参数自相关系数如表4所示。根据相机畸变原理,径向畸变参数之间的相关是正常的,同理,焦距和主点偏移、主点偏移和切向畸变参数之间的相关性也无需关注。这里主要关注径向畸变参数和主点偏移、径向畸变参数和切向畸变参数之间的相关性。前人研究表明这几个参数之间的强相关会导致摄影测量模型的系统误差。从表4中可以发现,当相机倾角为0°~ 5°时,径向畸变参数与主点偏移,和其与切向畸变参数之间相关性(红色虚线框)均较强。随着相机倾角的增加,相关性减弱。当相机倾角大于20°时,这几项参数近乎不相关。这与垂直摄影使用全部控制点优化的相机畸变模型的相关系数分布十分相近。这一结果说明使用倾斜摄影优化了相机畸变模型,特别是倾角大于20°时,可达到使用控制点优化相机畸变模型的相同效果。
表4 不同相机倾角下相机参数自相关模型
Tab.4
 |
注: F为相机焦距; Cx和Cy分别为主点偏移; K1,K2和K3分别为径向畸变参数; P1和P2分别为切向畸变参数。
3.2.4 控制点饱和数量
在有地面控制点的情况下,相机倾角对高程RMSE的影响不大(图4)。但其精度可能随控制点数量变化而变化。T1样区的实验结果如表5第一列所示。控制点的误差随着参与光束平差的控制点数量增加而变高,数量达到一定程度之后精度保持不变; 检查点的误差随着参与光束平差的控制点数量增加而降低,数量达到一定程度之后精度保持不变。这说明控制点达到一定数量之后,对摄影测量精度的影响不大。相机倾角并不影响这一趋势。但是通过表5可以发现,相机倾角对控制点饱和数有明显的影响。使用垂直摄影(0°)时,高程误差在控制点数量为5左右时达到了稳定。而使用倾斜相机时,高程误差在控制点数量为7时开始趋近于稳定。这说明使用倾斜相机略微提高了控制点饱和数。T2和T3样区的控制点蒙特卡罗检验结果如表5第二列和第三列所示。可以发现这2个样区的控制点和检查点误差变化趋势和T1样区结果基本一致,但在这2个样区中相机倾角对控制点饱和数的影响更明显。使用正射相机时,T2和T3样区中控制点数量在5左右时达到了饱和; 而使用倾斜相机时,T2样区控制点数量在9左右时趋近于饱和,T3样区控制点数量为8时才开始趋近于饱和。这一结果验证了T1样区的结论,使用倾斜相机提高了控制点饱和数。但是,控制点达到饱和时,倾斜摄影的最优精度高于垂直摄影的最优精度。
表5 T1,T2,T3样区不同相机倾角下控制点蒙特卡罗检验结果
Tab.5
| 倾角/(°) | T1样区 | T2样区 | T3样区 |
|---|---|---|---|
| 0 |  | ||
| 10 |  | ||
| 20 |  | ||
| 30 |  | ||
| 40 |  | ||
3.3 航高对高程精度的影响
3.3.1 高程RMSE
航高对高程RMSE的影响如图5所示。其中T1样区影像获取时采用的是垂直摄影,T2样区采用的是倾角为15°的倾斜摄影。可以发现,在无地面控制点时垂直摄影(T1)的高程RMSE均在分米级,且随航高的增加而增大; 而采用倾斜摄影(T2)时,高程RMSE均为厘米级,且随航高的变化不大。这一方面验证了倾斜摄影有利于提高高程精度的结论,另一方面说明采用倾斜摄影降低了高程误差对航高的敏感性。为满足《低空数字航空摄影规范》(CH/Z3005—2010)中1∶500比例尺测图的要求,试验的飞行高度设计在60~160 m,地面分辨率均优于5 cm。理论上,高程精度也可优于5 cm。一方面,由于倾斜摄影优化了相机畸变模型(表4),降低了系统误差,使摄影测量模型能达到这个精度,所以60~160 m的航高范围内检查点高程误差变化不显著(图5)。在这个精度级别,刺点误差和控制点测量误差等可能比航高更重要。以控制点测量误差为例,本实验采用GNSS-RTK的测量方式,高程中误差在3 cm左右,在60~160 m的航高范围内高程误差的变化可能小于3 cm,导致难以通过检查点检测航高对误差的影响。另一方面,由于垂直摄影的相机畸变参数分离效果较差,自相关性较强,当航高变高时,将放大相机模型的畸变误差,导致高程误差对航高的变化更敏感。
图5

3.3.2 控制点饱和数量
在有控制点参与光束平差校正的情况下,60~160 m范围内,高程RMSE对航高的变化不敏感。为了讨论航高是否影响控制点饱和数量,在不同航高下进行了蒙特卡罗控制点检验,结果如图6所示。结果表明,航高从60 m变到160 m,T1样区(垂直摄影)的控制点饱和数一直在5左右,T2样区(15°倾斜摄影)一直在9左右。这说明航高基本上不影响控制点饱和数,也验证了倾斜摄影增加了控制点饱和数的结论。
图6

图6
不同航高下控制点蒙特卡罗检验结果
Fig.6
Monte Carlo test results of control points at different altitudes
4 结论
本研究设计了不同的摄影测量数据采集方案和控制点蒙特卡罗检验,综合分析了相机倾角、航高和控制点数量对地形建模精度的影响,实验结果表明:
1)在进行无人机摄影测量数据处理时,应先使用蒙特卡罗检验对控制点质量进行分析,排除控制点误差再进行数据处理。
2)在无控制点测量的情况下,倾斜摄影有利于改善高程精度。倾斜摄影有利于降低相机畸变参数相关性,减少系统误差,特别是倾角大于20°时,可达到使用控制点优化相机畸变模型的相同效果。在有控制点的情况下,相机倾角对高程精度的影响不大,但是影响控制点饱和数量; 相对于垂直摄影,倾斜摄影需要略多的控制点才能达到最优精度。
3)在无控制点测量的情况下,航高对高程精度的影响与相机倾角有关。使用倾斜摄影时,有利于降低高程精度对航高变化的敏感性,高程精度在60~160 m航高内的变化不明显。使用垂直摄影时,高程精度明显随航高变高而降低。在有控制点的情况下,高程精度在60~160 m航高内的变化不明显。同时航高不影响控制点饱和数量。
在使用消费级无人机进行地形建模时,如因条件限制,样区难以布设控制点时,为了提高测量精度,建议使用20°~40°的“井”字形倾斜摄影方案; 同时应当在遥感影像或者其他资料中至少选取3个控制点,将摄影测量模型平移、旋转和缩放到正确的位置。如有条件布设控制点时,可以根据飞行方案合理优化控制点的布设数量。
参考文献
3-D uncertainty-based topographic change detection with structure-from-motion photogrammetry:Precision maps for ground control and directly georeferenced surveys
[J].DOI:10.1002/esp.v42.12 URL [本文引用: 3]
结合无人机航空摄影测量的河道流量估算
[J].
River flow estimation method based on UAV aerial photogrammetry
[J].DOI:10.11834/jrs.20209082 URL [本文引用: 1]
基于无人机摄影测量的地形变化检测方法与小流域输沙模型研究
[J].
DOI:10.18306/dlkxjz.2021.09.011
[本文引用: 1]

流域输沙过程是地貌学和地表动力学的重要研究内容,但传统的输沙过程监测方法仅能得到某个区域的总输沙率,无法推算其空间分布。论文以黄土高原绥德县窑家湾小流域为例,利用无人机摄影测量技术得到其2006年和2019年2期数字高程模型(DEM)并计算地形变化量;然后,根据质量守恒原理和多流向算法建立泥沙在空间上的输送模型,进而计算小流域输沙率的空间分布。实验结果表明,该模型能有效模拟泥沙在空间上的输送情况,输沙率出现质量不守恒的区域面积占比小于4%,且不守恒区域多为人类活动影响区。同时,论文讨论了DEM的选择和不同地形变化检测水平对模型结果的影响。当使用第一期DEM进行泥沙搬运路径推算时,质量不守恒区域的面积显著降低。使用误差空间分布图进行地形变化检测得到的输沙率结果鲁棒性更强。使用中误差进行地形检测得到的结果在不同置信度下变化较大。基于无人机地形变化检测的空间输沙模型能方便、快捷地提供详尽的输沙率空间分布,为地表过程研究带来了新的机遇。
Modelling sediment transport in space in a watershed based on topographic change detection by UAV survey
[J].
DOI:10.18306/dlkxjz.2021.09.011
[本文引用: 1]
Sediment transport rate, as an important indicator for studying Earth surface processes and for planning soil and water conservation, is a spatial variable. However, traditional monitoring methods can only obtain the global sediment transport rate in a certain area and are unable to map the spatial distribution of sediment transport rate. In this study, unmanned aerial vehicle (UAV) photogrammetry was used to obtain a two-phase digital elevation model (DEM) and calculate the amount of topographic change. In accordance with the principle of mass conservation and using a multi-flow direction algorithm, a spatial sediment transport model was established, by which the spatial sediment transport rate from a loess watershed was obtained. The results show that this method can effectively simulate the transportation of sediment in space. The area where the mass is not conserved is less than 4%, and the non-conserved areas are mostly those that are affected by human activities. The effects of DEM choice and the level of topographic change detection on the proposed model are also discussed. When DEM in the first phase is used to calculate the sediment transportation path, the area where the mass is not conserved is significantly reduced. The results of the spatial sediment transport model are more robust when a precision map is used to detect topographic changes, whereas the results from topographic changes detected by root mean square error (RMSE) greatly varied under different confidence levels. The proposed model can conveniently and quickly provide a detailed spatial distribution of sediment transport rate through UAV-based topographic change detection, which provides new perspectives for research of Earth surface processes.
黄河源区放牧家畜数量及空间分布无人机遥感调查
[J].
DOI:10.12082/dqxxkx.2021.210075
[本文引用: 1]
黄河源区拥有独特的生态系统和生物资源,是我国重要的江河水源涵养地和重要的生态屏障。近年来,放牧家畜数量的增加使该地区传统草地畜牧业面临过度放牧、草地退化、季节性失衡等发展难题。为科学掌握黄河源区放牧家畜的情况,本文以黄河源区的玛多县为研究区,应用无人机对玛多县放牧家畜(牦牛、藏羊和马)的数量和空间分布开展航拍调查。根据牦牛、藏羊和马的无人机图像解译标志库进行目视解译,采用5种方法估算玛多县放牧家畜的数量,利用选择指数分析家畜空间位置与环境因子的关系,结果表明:① 在冷季无人机航拍样带内,牦牛、藏羊和马的样带密度分别为4.12、7.34和0.06 只/km<sup>2</sup>。② 玛多县有牦牛7.08万头,藏羊10.22万只,马0.12万匹,经验证,估算牦牛、藏羊和马数量的误差分别为-0.93%、2.27%和-13.23%。③ 家畜对环境因子的选择倾向于坡度小于12°,草地覆盖度高于0.6,距居民点小于1 km,距水源小于 3 km,距公路大于3 km的区域。研究结果表明,无人机遥感技术在畜牧业方面有较大的应用潜力,为研究牧区放牧家畜的特征和草畜平衡情况提供新的思路。
Using UAVs remote sensing for population and distribution of grazing livestock in the source region of the Yellow River
[J].
Guidelines on the use of structure-from-motion photogrammetry in geomorphic research
[J].
DOI:10.1002/esp.4637
[本文引用: 1]
As a topographic modelling technique, structure-from-motion (SfM) photogrammetry combines the utility of digital photogrammetry with a flexibility and ease of use derived from multi-view computer vision methods. In conjunction with the rapidly increasing availability of imagery, particularly from unmanned aerial vehicles, SfM photogrammetry represents a powerful tool for geomorphological research. However, to fully realize this potential, its application must be carefully underpinned by photogrammetric considerations, surveys should be reported in sufficient detail to be repeatable (if practical) and results appropriately assessed to understand fully the potential errors involved. To deliver these goals, robust survey and reporting must be supported through (i) using appropriate survey design, (ii) applying suitable statistics to identify systematic error (bias) and to estimate precision within results, and (iii) propagating uncertainty estimates into the final data products. (c) 2019 John Wiley & Sons, Ltd.
顾及单木三维形态的无人机立体影像单木识别算法
[J].
DOI:10.12082/dqxxkx.2021.210117
[本文引用: 1]
单木参数对当前的森林资源管理、生态研究以及生物多样性保护等具有重要意义。无人机立体影像数据与单木识别算法为单木参数的低成本、自动化获取提供了基础。现有研究表明,常用的基于局部最大值搜索的单木识别算法面对密集林分时存在严重的漏识别问题,影响了参数提取的精度,因此本文提出了顾及单木三维形态的无人机立体影像单木识别新算法。算法首先综合利用无人机立体影像的高程与RGB光谱信息,通过随机森林分类进行林冠区的提取;然后利用形态学的多层腐蚀、膨胀与连通区标记进行树冠相连单木的分离与树冠中心点的提取,从而实现单木自动化识别。本文选取内蒙古大兴安岭林区和四川王朗林区的4块样地进行验证,以目视解译数据为参考,分别与基于高程值的局部最大值搜索算法(算法A)、基于RGB光谱亮度值的局部最大值搜索算法(算法B)进行比较。结果显示:本文提出的算法在4个样地的平均F1-score为94.17%,与算法A和算法B相比分别提高了15.85%和9.37%;而对于密集样地,本文提出的算法在查全率上相比算法A和算法B分别提高51.79%和35.64%。结果表明本文提出的算法在不同林区均能够实现较好的单木识别效果,特别是能够有效避免密集林分下的漏识别问题,为基于无人机立体影像的单木识别研究提供了一种新的思路。
Individual tree recognition algorithm of UAV stereo imagery considering three-dimensional morphology of tree
[J].
Reconstruction of extreme topography from UAV structure from motion photogrammetry
[J].DOI:10.1016/j.measurement.2018.02.062 URL [本文引用: 1]
Straightforward reconstruction of 3D surfaces and topography with a camera:Accuracy and geoscience application
[J].
Enhancing UAV-SfM 3D model accuracy in high-relief landscapes by incorporating oblique images
[J].
DOI:10.3390/rs11030239
URL
[本文引用: 1]
Complex landscapes with high topographic relief and intricate geometry present challenges for complete and accurate mapping of both lateral (x, y) and vertical (z) detail without deformation. Although small uninhabited/unmanned aerial vehicles (UAVs) paired with structure-from-motion (SfM) image processing has recently emerged as a popular solution for a range of mapping applications, common image acquisition and processing strategies can result in surface deformation along steep slopes within complex terrain. Incorporation of oblique (off-nadir) images into the UAV–SfM workflow has been shown to reduce systematic errors within resulting models, but there has been no consensus or documentation substantiating use of particular imaging angles. To address these limitations, we examined UAV–SfM models produced from image sets collected with various imaging angles (0–35°) within a high-relief ‘badland’ landscape and compared resulting surfaces with a reference dataset from a terrestrial laser scanner (TLS). More than 150 UAV–SfM scenarios were quantitatively evaluated to assess the effects of camera tilt angle, overlap, and imaging configuration on the precision and accuracy of the reconstructed terrain. Results indicate that imaging angle has a profound impact on accuracy and precision for data acquisition with a single camera angle in topographically complex scenes. Results also confirm previous findings that supplementing nadir image blocks with oblique images in the UAV–SfM workflow consistently improves spatial accuracy and precision and reduces data gaps and systematic errors in the final point cloud. Subtle differences among various oblique camera angles and imaging patterns suggest that higher overlap and higher oblique camera angles (20–35°) increased precision and accuracy by nearly 50% relative to nadir-only image blocks. We conclude by presenting four recommendations for incorporating oblique images and adapting flight parameters to enhance 3D mapping applications with UAV–SfM in high-relief terrain.
Ground-based and UAV-based photogrammetry:A multi-scale,high-resolution mapping tool for structural geology and paleoseismology
[J].DOI:10.1016/j.jsg.2014.10.007 URL [本文引用: 1]
Mitigating systematic error in topographic models derived from UAV and ground-based image networks
[J].DOI:10.1002/esp.v39.10 URL [本文引用: 1]
Cost-effective non-metric photogrammetry from consumer-grade sUAS:Implications for direct georeferencing of structure from motion photogrammetry
[J].DOI:10.1002/esp.v42.3 URL [本文引用: 1]
Effects of image orientation and ground control points distribution on unmanned aerial vehicle photogrammetry projects on a road cut slope
[J].DOI:10.1117/1.JRS.10.034004 URL [本文引用: 1]
Combining nadir and oblique UAV imagery to reconstruct quarry topography:Methodology and feasibility analysis
[J].DOI:10.1080/22797254.2017.1313097 URL [本文引用: 1]
From experimental plots to experimental landscapes:Topography,erosion and deposition in sub-humid badlands from structure-from-motion photogrammetry
[J].DOI:10.1002/esp.v40.12 URL [本文引用: 1]
小型消费级无人机地形数据精度验证
[J].
Topographic data accuracy verification of small consumer UAV
[J].
Influence of the number and spatial distribution of ground control points in the accuracy of UAV-SfM DEMs:An approach based on generalized additive models
[J].DOI:10.1109/TGRS.2021.3050693 URL [本文引用: 1]
小区域消费级无人机倾斜摄影像控点布设及建模精度研究
[J].
DOI:10.13474/j.cnki.11-2246.2019.0325
[本文引用: 1]
像控点布设是无人机倾斜摄影施测阶段的重要环节,直接决定后期三维实景模型的精度。本文面向校园等小区域环境,利用消费级单镜头多旋翼无人机航摄系统获取影像数据,重点设计了不同像控点布设方案,基于全自动数据处理系统进行空三加密及三维模型的构建,并对模型成果进行精度分析,为实际工作中小区域像控点的布设提供建议和指导。
Research on the control point layout scheme for consumption-grade UAV oblique photogrammetry in small areas and modeling accuracy
[J].
DOI:10.13474/j.cnki.11-2246.2019.0325
[本文引用: 1]
The control point layout scheme is an important part in the surveying stage of the unmanned aerial vehicle(UAV) oblique photogrammetry, which directly determines the accuracy of the later 3D real scene model. In this paper, aiming at campus and other small-area environments, and using the consumption-grade single-lens multi-rotor UAV aerial photography system to obtain the image data, different control point layout schemes are designed. Aerotriangulation and building 3D model based on automatic data processing system, accuracy analysis of model results is carried out. The suggestion and guidance are given for the layout of the control point in small areas for the actual work.
Optimising UAV topographic surveys processed with structure-from-motion:Ground control quality,quantity and bundle adjustment
[J].DOI:10.1016/j.geomorph.2016.11.021 URL [本文引用: 2]
Revisiting the morphological method in two dimensions to quantify bed-material transport in braided rivers
[J].
DOI:10.1002/esp.4633
[本文引用: 2]
Research in the 1990s showed that bed-material transport rates could be estimated at the reach scale in both one-dimension and, over small spatial scales (10s of m), in two-dimensions. The limit on the latter was the spatial scale over which it was possible to obtain distributed data on morphological change. Here, we revisit the morphological method given progress in both topographical data acquisition and hydraulic modelling. The bed-material transport needed to conserve mass is calculated in both one and two dimensions for a 1600 m x 300 m Alpine braided river "laboratory". High-resolution topographical data were acquired by laser scanning to quantify Digital Elevation Models (DEMs), and morphological changes caused by the flushing of the water intake were derived from repeated surveys. Based on DEMs of differences, 1D bed-material transport rates were calculated using the morphological method. Then, a 2D hydraulic model was combined with a topographic correction to route sediment through the network of braided channels and to obtain a spatially variable estimate of transport in both downstream and cross-stream directions. Monte Carlo simulation was applied to the routing model parameters, allowing identification of the most probable parameter values needed to minimize negative transport. The results show that within-section spatial compensation of erosion and deposition using the 1D treatment leads to substantial local errors in transport rate estimates, to a degree related to braiding intensity. Even though the 2D application showed that a large proportion of the total transport was actually concentrated into one main channel during the studied low flow event, the proportion of transport in secondary anabranches is substantial when the river starts braiding. Investigations of the effects of DEM resolution, competent flow duration and survey frequency related to 'travelling bedload' and sequential erosion-deposition emphasized the critical importance of careful data collection in the application of the morphological method. (c) 2019 John Wiley & Sons, Ltd.
