

0 引言
最早于1986年Dalai等[5]利用多元回归分析发现1 700~2 100 nm是土壤光谱与氮元素关系较为密切的波段,Hummel等[6]与Reeves等[7]研究表明土壤全氮在可见光和近红外波段处相关性较高,并利用近红外光谱反射率特征波段对土壤全氮含量进行有效估测。随着高光谱技术的不断发展,国内基于高光谱土壤全氮反演也逐步趋于成熟,卢艳丽等[8]利用反射率对数的一阶导数光谱预测黑土全氮含量,决定系数R2均达到0.8以上; 张娟娟等[9]对我国中、东部地区5种类型土壤全氮含量进行高光谱反演研究,结果表明偏最小二乘法(partial least-square method,PLS)与BP神经网络建立高光谱全氮反演模型有较高的精度; 王炜超等[1]基于CatBoost算法建立的土壤全氮预测模型R2均高于0.80,证明CatBoost算法在土壤全氮含量预测中有一定的使用价值; 赵燕东等[10]与王世东等[11]分别运用一阶微分与二阶微分有效预测了土壤全氮含量。
基于上述研究,各学者对于高光谱数据的处理方式均采取一阶微分与二阶微分等传统处理方式,整数阶微分数学变换形式对土壤光谱数据处理时中间空缺较多,可能会导致具体的信息遗漏,与整数阶微分相比,分数阶微分(fractional order derivative,FOD)具有较小的间隔变化,可以确保信噪比转变缓慢,这为检测到某些光谱曲线信号提供更多特征[12]。此外,因一阶微分与二阶微分波形差异较大,可能会忽略土壤全氮含量造成的光谱差异,因此,为了细化光谱特征,利用FOD的方法对光谱数据进行潜在信息的挖掘是非常有必要的[13],相关研究中竞霞等[14]通过对原始光谱进行FOD处理,提高了光谱反射率与小麦条锈病严重度的相关性; 赵慧等[15]引入FOD对土壤高光谱反射率进行0~2阶微分处理,发现在1.6阶处模型结果较好; 田安红等[16]使用FOD的方法对新疆干旱区盐渍土的电导率进行研究时发现在1.5阶处估算效果最佳; Wang等[17]在对艾比湖的土壤有机质使用FOD方法时发现在1.2阶处取得了良好效果,综上所述,渐变的FOD信息制约模型的精度[12],基于FOD的高光谱估算模型具有较好的稳定性,模型估算的预测能力较好。
非线性模型因其更加接近客观规律,得到了广泛的应用,而非线性模型的复杂性也促进了变量的筛选[18]。支持向量机(support vector machine,SVM)是建立在统计学习理论中结构风险最小化基础上的监督学习模型[19],在解决小样本、非线性、高维数等模式识别问题时,SVM较其他建模方法来说具有更多的优点[20],相对于线性模型能更好地应用于函数回归问题[21]。BP神经网络适用范围广、易操作、扩充性强,所以在实践中得到了广泛应用[22],一般线性回归无法达到较高精度,神经网络算法以其强大的容错性、自组织自学习和非线性模拟能力在不确定两者之间关系的前提下仍然可以很好地解决非线性问题[23],在估算建模研究中人们还发现,人工神经网络集成模型的精度要优于单神经网络模型,单神经网络模型则优于多元逐步回归模型[24]。
所以本文采取FOD的处理方法,筛选敏感波段,构建土壤全氮高光谱反演模型,探究FOD在土壤全氮高光谱反演研究中深度挖掘光谱信息、有效提升模型反演精度的能力,力图为土壤全氮高光谱数据预处理提供一定的新思路,为土壤全氮高光谱反演提供理论依据。
1 研究区及数据来源
1.1 研究区概况
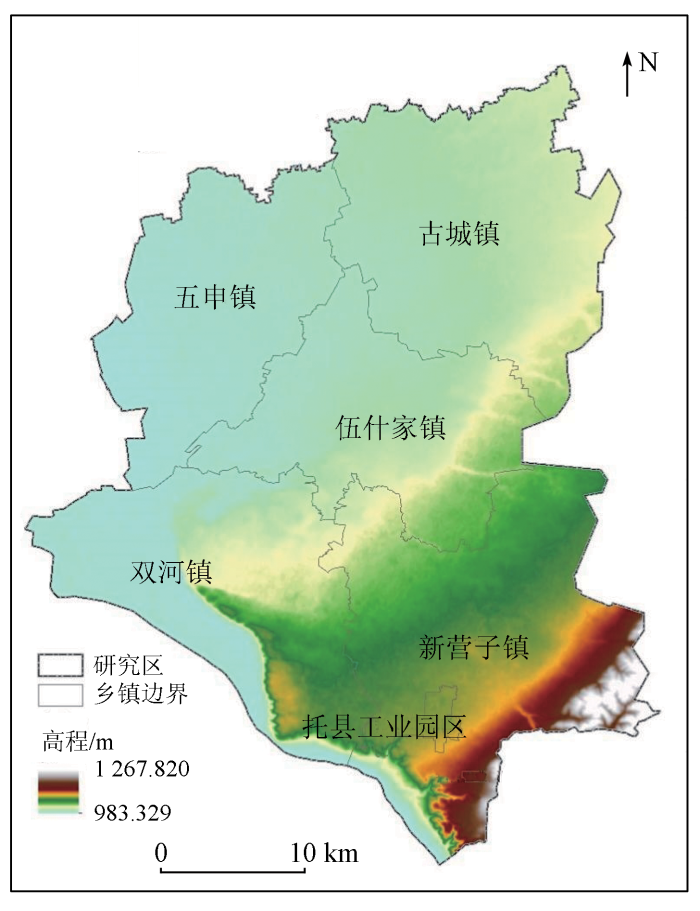
托克托县(图1)隶属于内蒙古自治区首府呼和浩特市,位于自治区中部、大青山南麓、黄河上中游分界处北岸的土默川平原上。地理坐标在E111°02'30″~111°32' 21″,N40°05'55″~40°35'15″之间,总面积为1 416.8 km2,平均海拔为1 117 m,属于温带大陆性干旱气候,年均气温为7.3 ℃,年均降雨量为362 mm。托克托县耕地总面积达400 km2,其中古城镇、新营子镇和五申镇的耕地较多,占全县耕地面积的60%以上,主要作物包括小麦、玉米和莜麦,工农业及生产生活用水主要来源于大黑河和黄河水资源,整个地形是以大黑河为轴,呈现由丘陵向平原过度的趋势,地势为东南高、西北和西南低; 东南向西北土壤类型为栗钙土、砂壤石灰性冲积土、盐渍化石灰性冲积土,土壤类型的不同导致土壤养分存在差异性分布,植被类型从西向东依次为草甸草原、干草原和退化灌丛草原分布[25]。
图1
1.2 数据来源
1.2.1 土样采集
采样时间为10—11月,地面植被较少,方便进入农田,也可减少取土时对地表植被的破坏。采用五点取样法,取样前先剔除地表杂物,取样深度为0~20 cm,取样约500 g放入聚乙烯密封袋中,并记录相应的土地利用类型与地理坐标。采集的土样置于通风干燥的室内进行自然风干、去除杂物、研磨,并分为2份,一份过10目筛,用于光谱数据测定,一份过100目筛,用于土壤全氮含量测定。
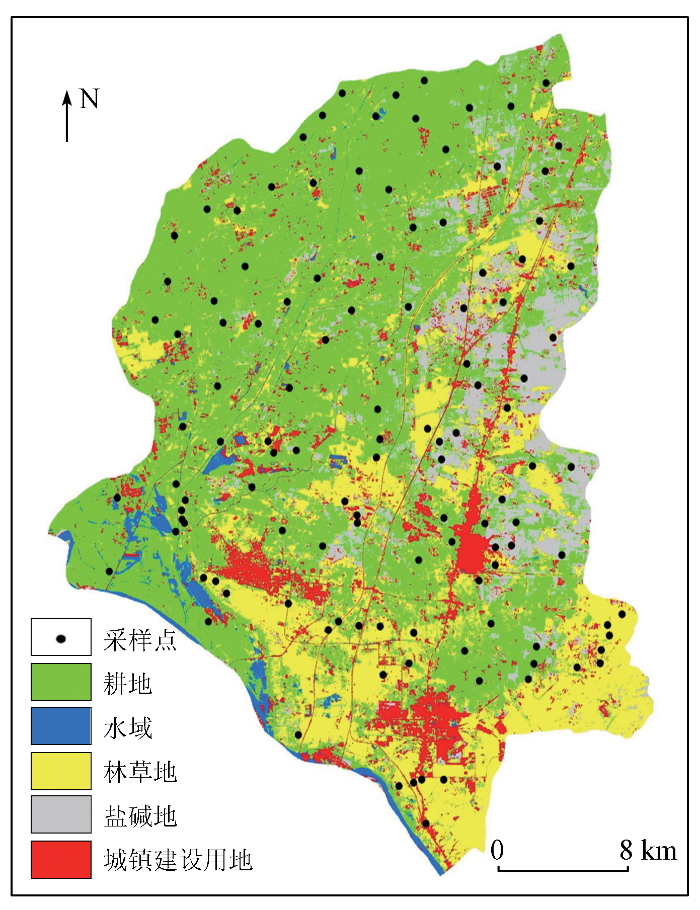
1.2.2 土地利用现状
以Landsat8 OLI影像为基础数据源,运用人工目视解译与BP神经网络分类法得到托克托县2019年7月份土地利用数据,土壤采集分布示意图如图2所示。
图2
1.2.3 土壤全氮测定
表1 土壤养分描述性统计
Tab.1
| 类型 | 最大值/ (g· kg-1) | 最小值/ (g· kg-1) | 均值/ (g· kg-1) | 中位数/ (g· kg-1) | 标准 差 | 偏度 | 峰度 | 变异 系数/ % |
|---|---|---|---|---|---|---|---|---|
| 全氮 | 1.74 | 0.11 | 0.53 | 0.41 | 0.33 | 1.27 | 1.16 | 0.62 |
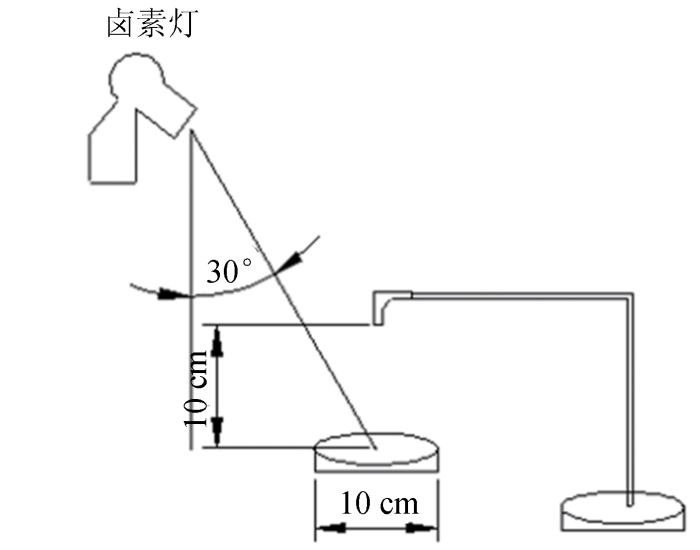
1.2.4 土壤光谱测定
土壤光谱于暗室内测量,测量示意图见图3,采用SVC HR-1024便携式光谱仪,光谱范围350~2 500 nm,在350~1 000 nm波段之间光谱分辨率≤3.5 nm,在1 000~1 850 nm波段之间光谱分辨率≤9.5 nm,在1 850~2 500 nm波段之间光谱分辨率≤6.5 nm。光源采用与太阳光接近的50 W卤素灯,将土壤样品放入深2 cm,宽10 cm的黑色器皿内,用直尺将土壤表面刮平,探头距离土样10 cm,光源距离土壤表面30 cm,天顶角为30°,测量前用白板进行标定,每个土样采集5条光谱求平均作为该土样的光谱数据。
图3
2 研究方法
2.1 光谱预处理
由于受噪声与仪器暗电流的的影响,导致光谱数据混入噪声等信息,因此删除350~399 nm和2 400~2 500 nm的波段,采用五点平滑法对光谱进行平滑处理,为保留光谱所有信息,将光谱重采样至1 nm。
2.2 FOD
FOD由整数阶发展而来,目前比较常用的FOD定义为Grunwald-Letnikov(G-L),Riemann-Liouville(R-L)和Caputo这3种形式[26],其中G-L是最为常用的一种形式,当光谱数据重采样至1 nm时,其主要形式为:
式中:
2.3 模型及精度验证
采用BP神经网络与SVM建立土壤全氮预测模型,本研究SVM的cmd参数中“-s”为SVM类型,0代表C-SVC模型; 1代表nu-SVM模型; 2代表one-class SVM模型; 3代表epsilon-SVR模型; 4代表nu-SVR模型; “-t”为核函数设置类型,0代表线性核函数,1代表多项式核函数,2代表RBF核函数,3代表sigmoid核函数; “-p”为epsilon-SVR中损失函数epsilon的值,默认为0.01。为了避免造成在高维空间中向量内积的大量运算,对SVM方法进行了各种类型核函数的引用,在实际应用中,根据具体问题选择合适的惩罚参数c,灵敏损失参数f,核函数类型以及相应的参数; BP神经网络的迭代次数设置为1 000,学习率为0.01,训练的均方根误差小于0.001,神经元个数则针对不同数据集进行手动调整,有效避免过拟合现象发生。
模型精度采用决定系数R2,均方根误差(root mean square error,RMSE)和相对分析误差(relative percent deviation,RPD)共同评价。
R2表明模型的稳定性,越接近于1模型越稳定,拟合程度越好。公式为:
式中: n为样本数量;
RMSE用来检验模型的预测能力,越小则表明模型的估测能力越好,公式为:
RPD是样本的标准差与RMSE的比值,RPD<1.4时,模型无法对样品进行预测; 1.4≤RPD<2时,认为模型预测效果一般,可以用来对样品进行粗略评估; RPD≥2时,模型具有极好的预测能力。计算公式为:
式中STDEV为样本的标准差。
3 结果与分析
3.1 土壤全氮光谱特征分析
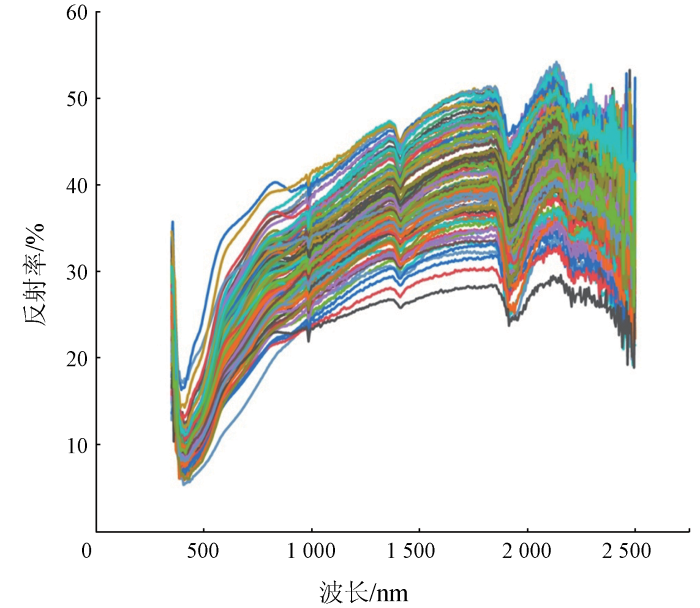
采样点室内实测光谱数据曲线经平滑后如图4所示,光谱曲线整体变化趋势相同,在450~470 nm波段处反射率最低,1 400 nm与1 900 nm波段处波谷较为明显,主要由土壤水分分子引起的,在450~1 000 nm波段处反射率增加较为明显,1 000~1 900 nm波段反射率增长趋势较慢,2 000~2 300 nm波段反射率仍增长趋势,350~450 nm与2 400~2 500 nm波段光谱曲线较为杂乱且规律性较差,主要受环境以及仪器自身影响,所以本研究不考虑此范围的波段。
图4
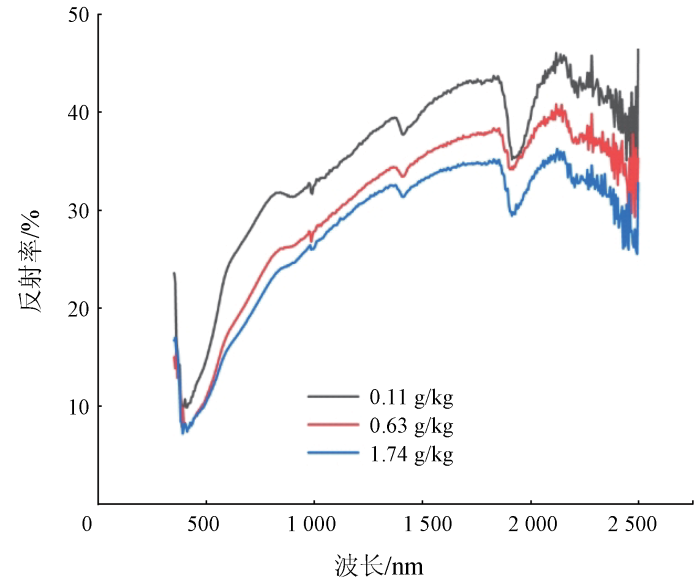
全氮含量为0.11 g/kg,0.63 g/kg,1.74 g/kg土样的光谱曲线如图5所示。在350~470 nm波段处,不同全氮含量的光谱反射率随波长的增加而逐渐减少,而反射率趋于相同,除1 000 nm,1 500 nm,2 000 nm和2 200~2400 nm波段外,不同全氮含量的光谱反射率均随波长的增加而逐渐增加,但增长规律并不相同,在500~600 nm波段处,含量为0.63 g/kg与1.74 g/kg的光谱反射率较为接近,土壤全氮与原始光谱的反射率在600~2 200 nm土壤光谱反射率随全氮含量的增加而减少,在其他波段处全氮含量与光谱反射率没有很好的变换规律。
图5
3.2 光谱数据FOD
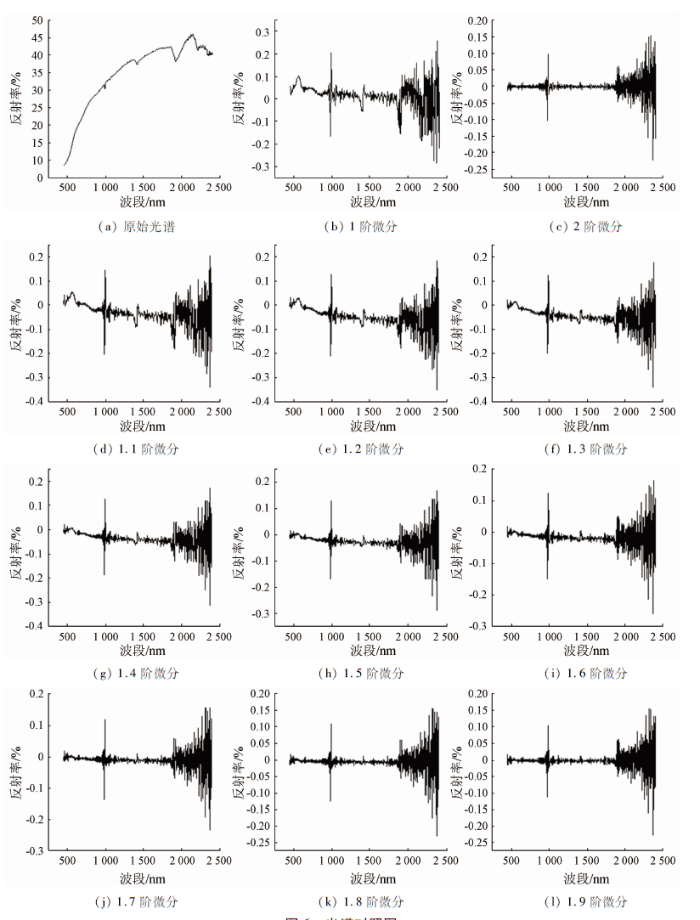
经1~2阶(间隔0.1)FOD处理后,如图6所示,600 nm,1 000 nm,1 500 nm,2 000 nm波段处出现明显波动,对比原始光谱,在500~1 000 nm波段处,反射率随波长的增加而快速增加,在600 nm波段处斜率达到最大值,在1 000 nm,1 500 nm,2 000 nm波段处存在3个显著的吸收峰,在2 000~2 400 nm波段处主要为水汽波段与环境噪声影响波段,光谱曲线变换频率较快,表明FOD处理光谱数据能够将光谱的波峰、波谷、斜率变化较快的波段信息放大,有效捕捉光谱的特征值,有利于挖掘光谱的潜在信息,其余光谱反射率随分解尺度的增加逐渐趋于0,进一步剔除光谱无用信息,保留有效信息。综上,FOD处理对于光谱的波峰、波谷、变化较为明显的波段有较高的敏感性,对于放大信号,挖掘数据有显著作用,更有利于获取更精细的光谱数据。
图6
3.3 相关性分析
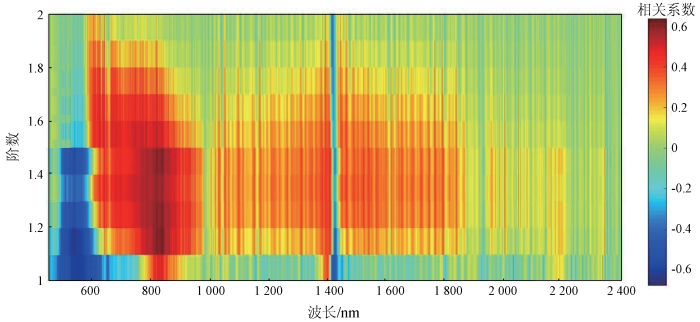
光谱数据对应全氮含量皮尔森相关系数(p<0.01)计算结果如图7所示,原始光谱敏感波段主要集中于500~600 nm呈负相关、800~900 nm呈正相关,进行微分处理后,呈正相关的敏感波段范围明显增加,集中于600~1 000 nm波段处,在1~1.4阶微分范围内,r均大于0.60,随分解尺度的增加,范围逐渐减少; 呈负相关的波段随分级尺度的增加,范围逐渐减少,但相关系数在1.1阶微分处达到最大值(-0.67),正负相关均在1.5阶微分后敏感波段范围与相关系数逐渐减少。如图7所示,经过FOD处理后,相关系数较原始光谱(r=0.61)在1.4阶微分尺度内均有一定的提高,进一步证明FOD对于放大光谱信号,挖掘光谱信息有一定的意义。
图7
3.4 模型构建
表2 敏感波段筛选
Tab.2
| 阶数① | 波长范围/nm | 波段数 |
|---|---|---|
| 0 | 815~819,830~835 | 11 |
| 1 | 828~829,534~535,548~554 | 11 |
| 1.1 | 535~539,541~542,817~818,834~835,839 | 12 |
| 1.2 | 535~536,816~819,830~835,837,839~840 | 15 |
| 1.3 | 785,810,815~819,822,830~835,837,839~840 | 17 |
| 1.4 | 535~536,816~819,830~835 | 12 |
| 1.5 | 624,639,640,746~747,769,816~818 | 9 |
| 1.6 | 621,624~625,638~640,680,727,746~747,816~818 | 13 |
| 1.7 | 604,621,624~625,638~639,666,727,816~817 | 10 |
| 1.8 | 604,621,624,638~639 | 5 |
| 1.9 | 604,1 411~1 412,1 415 | 4 |
| 2 | 1 404,1 407~1 408 | 3 |
①阶数为0时为原始光谱。
表3 全氮建模集和验证集描述性统计
Tab.3
| 数据集 | 最大值/ (g·kg-1) | 最小值/ (g·kg-1) | 均值/ (g·kg-1) | 标准差/ (g·kg-1) | 土样 数/个 |
|---|---|---|---|---|---|
| 建模集 | 1.74 | 0.12 | 0.52 | 0.29 | 90 |
| 验证集 | 1.44 | 0.11 | 0.52 | 0.36 | 30 |
3.4.1 SVM模型
筛选敏感波段建立SVM预测模型结果如表4所示,原始光谱建立的模型R2分别为0.28与0.27,RMSE分别为0.22与0.28,RPD为1.18,模型效果较差,无法对土壤全氮进行粗略估测,经过FOD处理后,R2均得到了一定提升,在1.8阶之后,模型预测效果逐渐下降,12个预测模型整体来看,RPD达到1.4以上的模型为1.1阶和1.2阶,建模集和验证集的R2分别为0.55和0.42,0.54和0.41,RMSE分别为0.16和0.22,0.17和0.23,RPD分别为1.50与1.43,较原始光谱建模集R2分别提升了0.27和0.26,RMSE分别减少了0.06和0.05,验证集R2分别提升了0.15和0.14,可实现对土壤全氮的粗略估算,1.6阶与1.4阶处,模型建模集R2虽达到0.5以上,但验证集R2效果较差,RPD也未达到模型评价标准。将R2,RMSE和RPD综合分析后,1.1阶处理后筛选敏感波段土壤全氮可以进行粗略观测,也初步证明FOD处理后,有效提升了模型反演能力。
表4 SVM预测模型
Tab.4
| 阶数① | 建模集 | 验证集 | RPD | ||
|---|---|---|---|---|---|
| R2 | RMSE | R2 | RMSE | ||
| 0 | 0.28 | 0.22 | 0.27 | 0.28 | 1.18 |
| 1 | 0.44 | 0.19 | 0.33 | 0.26 | 1.27 |
| 1.1 | 0.55 | 0.16 | 0.42 | 0.22 | 1.50 |
| 1.2 | 0.54 | 0.17 | 0.41 | 0.23 | 1.43 |
| 1.3 | 0.45 | 0.19 | 0.35 | 0.26 | 1.27 |
| 1.4 | 0.52 | 0.17 | 0.38 | 0.24 | 1.38 |
| 1.5 | 0.43 | 0.19 | 0.38 | 0.25 | 1.32 |
| 1.6 | 0.50 | 0.17 | 0.34 | 0.26 | 1.27 |
| 1.7 | 0.47 | 0.18 | 0.32 | 0.26 | 1.27 |
| 1.8 | 0.39 | 0.28 | 0.23 | 0.28 | 1.18 |
| 1.9 | 0.28 | 0.22 | 0.13 | 0.31 | 1.06 |
| 2 | 0.28 | 0.21 | 0.15 | 0.30 | 1.10 |
①阶数为0时为原始光谱。
3.4.2 BP神经网络模型
筛选敏感波段建立BP神经网络预测模型结果如表5所示,原始光谱建立模型建模集和验证集的R2均为0.58,RMSE分别为0.25和0.31,RPD为1.06,无法对土壤全氮含量进行粗略估测,经过FOD处理后,1,1.1,1.2和1.3阶模型RPD均大于1.40,1.4阶后预测模型RMSE过高,导致RPD过低,无法对土壤全氮含量进行预测,综上最佳预测模型为1.1阶处理后建立的土壤全氮反演模型,建模集和验证集的R2分别为0.75和0.71,RMSE都为0.16,RPD为2.06,可有效预测土壤全氮含量。
表5 BP神经网络预测模型
Tab.5
| 阶数① | 建模集 | 验证集 | RPD | ||
|---|---|---|---|---|---|
| R2 | RMSE | R2 | RMSE | ||
| 0 | 0.58 | 0.25 | 0.58 | 0.31 | 1.06 |
| 1 | 0.66 | 0.23 | 0.64 | 0.22 | 1.50 |
| 1.1 | 0.75 | 0.16 | 0.71 | 0.16 | 2.06 |
| 1.2 | 0.74 | 0.19 | 0.65 | 0.23 | 1.43 |
| 1.3 | 0.73 | 0.19 | 0.56 | 0.21 | 1.57 |
| 1.4 | 0.75 | 0.45 | 0.51 | 0.31 | 1.06 |
| 1.5 | 0.69 | 0.22 | 0.58 | 0.3 | 1.10 |
| 1.6 | 0.75 | 0.20 | 0.53 | 0.31 | 1.06 |
| 1.7 | 0.69 | 0.47 | 0.63 | 0.28 | 1.18 |
| 1.8 | 0.60 | 0.25 | 0.63 | 0.29 | 1.14 |
| 1.9 | 0.54 | 0.26 | 0.37 | 0.33 | 1.00 |
| 2 | 0.53 | 0.26 | 0.46 | 0.32 | 1.03 |
①阶数为0时为原始光谱。
4 讨论与结论
4.1 结论
本文以托克托县为研究区,进行野外采样,实验室土壤养分测定以及光谱测量,利用FOD(0.1间隔)将光谱数据进行1~2阶处理,分别建立SVM模型和BP神经网络模型,采用综合评价指标建立托克托县土壤养分最佳反演模型,得到如下结论:
1)不同含量土壤全氮高光谱反射率受众多因素干扰。
2)FOD处理后光谱与全氮之间的最大相关系数绝对值由0.61提升至0.67。
3)本研究区内BP神经网络预测模型优于SVM模型,最佳预测模型为1.1阶处理后建立的BP神经网络模型,建模集和验证集的R2分别为0.75和0.71,RMSE均为0.16,RPD为2.06。
4.2 讨论
在预测模型中,SVM预测效果整体低于BP神经网络预测。由于针对不同类型土壤以及光谱数据,模型并不能良好运算,虽然SVM在处理非线性回归问题中有较强的能力,但本身模型中存在不稳定性,对模型的环境设置同样要求较高,所以未能对所有数据集进行良好的预测。由于光谱数据受土壤类型影响较大,不同区域光谱差异性较大,对验证集的敏感性不同,本文研究表明研究区土壤全氮含量适合1.1阶FOD处理后,建立BP神经网络模型进行含量估测。
参考文献
基于CatBoost算法与图谱特征融合的土壤全氮含量预测
[J].
Prediction of soil total nitrogen based on CatBoost algorithm and fusion of image spectral features
[J].
基于高光谱数据的土壤全氮含量估测模型对比研究
[J].
Comparative study on estimation models of soil total nitrogen content based on hyperspectral data
[J].
基于表层土壤光谱的耕层土壤有机质间接估测
[J].
Indirect estimation of organic matter content in plough layer based on topsoil spectrum
[J].
二进制小波技术定量反演北方潮土土壤有机质含量
[J].
Quantitative inversion of soil organic matter content in northern tidal soil by binary wavelet technique
[J].
DOI:10.3964/j.issn.1000-0593(2019)09-2855-07
[本文引用: 1]

In order to separate the information of the content of soil organic matter contained in soil spectra, to extract the spectral response information of the matter, to improve the diagnostic accuracy and reliability of soil organic matter content, this study takes the content of organic matter in tidal soil as the research object, and takes the soil parameters and hyperspectral data of 96 farmlands collected from Beijing area as the data source to research and analyze. First, the binary wavelet technique is used to separate the soil spectral data into 5 scales of high-frequency data and low-frequency data, and then these two kinds of data are respectively used for the correlation analysis with the measured soil organic matter data. Afterwards, the optimal band combination is extracted to build the diagnosis model of organic matter content. Finally, results of the study show that: (1) The binary wavelet technology can restrain the noise interference to high frequency information, and effectively enhance the spectral sensitivity to soil organic matter content so as to improve the diagnostic accuracy and reliability of organic matter content; (2) Under the binary wavelet technique, the diagnostic ability of high frequency information to organic matter content is obviously superior to that of low frequency information. The diagnostic ability of low frequency information to soil organic matter content decreases with the increase of scale, while high frequency information increases with the scale increasing and then decreases; (3) Compared with the mathematical method, the model based on the binary wavelet transform algorithm has higher accuracy and better stability. The prediction accuracy of the optimal model is improved by 31.5% and the reliability is increased by 10.5%.
Simultaneous determination of moisture,organic carbon,and totalnitrogen by in France spectrometry
[J].
DOI:10.2136/sssaj1986.03615995005000010023x
URL
[本文引用: 1]
Near infrared diffuse reflectance spectrophotometry, within the wavelength range 1100 to 2500 nm, was investigated for use in the simultaneous prediction of the moisture, organic C, and total N contents of air‐dried soils. An infraAlyzer 500 C (Technicon Instruments Corp.) scanning spectrophotometer was used to obtain near infrared reflectance of soils at 2‐nm intervals. Calibration equations for each of the soil constituents studied were based upon selection of the best combination of three wavelengths in a multiple regression analysis. The wavelengths selected for moisture, organic C, and total N, respectively, were 1926, 1954, and 2150 nm, 1744, 1870 and 2052 nm, and 1702, 1870 and 2052 nm. The standard errors of prediction for finely ground samples (<0.25 mm) from the top layers (0‐0.1, 0.1‐0.2, 0.2‐0.3, 0.3‐0.6 m) were 0.58, 0.16, and 0.014% for moisture, organic C, and total N, respectively. The standard errors of prediction, however, were much larger for coarsely ground soils (<2 mm), soils containing low amounts of organic C (<0.3%) and total N (<0.03%), and for those with a wide range in colors. Within a narrow range in soil color and at moderate amounts of organic matter (0.3–2.5%C), the near infrared reflectance technique provides a rapid, nondestructive, and simultaneous measurement of moisture, organic C and total N in soils
Soil moisture and organic matter prediction of surface and subsurface soils using an NIR soil sensor
[J].DOI:10.1016/S0168-1699(01)00163-6 URL [本文引用: 1]
Near infrared reflectance spectroscopy for the analysis of agricultural soil
[J].
DOI:10.1255/jnirs.248
URL
[本文引用: 1]
The objective of this work was to investigate the usefulness of near infrared (NIR) reflectance spectroscopy in determining: (i) various constituents (total N, total C, active N, biomass and mineralisable N, and pH), (ii) parameters (soil source, depth from which sample was obtained, type of tillage used) and (iii) rate of application of NH4NO3 fertiliser) of low organic matter soils. A NIRSystems model 6250 spectrometer was used to scan soil samples ( n = 179) obtained from experimental plots at two locations with three replicate plots under plow and no till practices at each location with three rates of NH4NO3 for each plot (2 × 3 × 2 × 3). For each of these, samples were taken from five depths for a total of 2 × 3 × 2 × 3 × 5 or 180 samples (one sample lost). The results demonstrated that NIR reflectance spectroscopy can be successfully used to determine some compositional parameters of low organic matter soils (particularly total C and total N). It is also apparent that for non-biological parameters (excluding soil type as reflected by source) such as the depth from which the sample was obtained, the rate of application of NH4NO3 fertiliser and the form of tillage used, that NIR reflectance spectroscopy is not very useful, unless a very limited set of samples is used (i.e. single tillage and location). For other determinations, such as pH, biomass N and active N, the results may be useful depending on the exact needs in question. Finally, from the results presented here, NIR reflectance spectroscopy was not successful in determining soil N mineralisable in 21 days.
黑土土壤中全氮含量的高光谱预测分析
[J].
Hyperspectral prediction analysis of total nitrogen content in black soil
[J].
基于高光谱的土壤全氮含量估测
[J].
Estimating soil total nitrogen content based on hyperspectral analysis technology
[J].
DOI:10.11849/zrzyxb.2011.05.015
[本文引用: 1]
Quantitative relationships between soil total nitrogen content (TN) and hyperspectra in visible and near-infrared region (VIS-NIR) (350-2500 nm) were studied for five soil types (paddy soil, fluvo-aquic soil, salinized fluvo-aquic soil, saline soil, dark soil with lime concretion) collected from central and East China. Based on three different methods of spectral index, partial least square (PLS) and back propagation neural network (BPNN), the models were developed for estimating TN content in soil. The results showed that the newly developed PLS and BPNN models for estimating TN content based on the corrected first derivative spectra of 500-900 nm and 1350-1490 nm regions with Norris smoothing filter performed well, with <em>R</em><sup>2</sup> of calibration as 0.81 and 0.98, respectively. The <em>R</em><sup>2</sup>, <em>RMSE</em> and <em>RPD</em> of validation were 0.81, 0.219 g·kg<sup>-1</sup> and 2.28 for the method of PLS, and were 0.93, 0.149 g·kg<sup>-1 </sup>and 3.36 for the method of BPNN, respectively. In addition, <em>DI (NDR<sub>872</sub>, NDR</em><sub>1482</sub>) composed of the corrected first derivative spectra of 872 nm and 1482 nm with Norris smoothing algorithm also had a good correlation with soil TN content. Testing of the estimating model based on <em>DI(NDR<sub>872</sub>, NDR</em><sub>1482</sub>) with independent datasets from different types of soil samples resulted in <em>R</em><sup>2</sup>, <em>RMSE</em> and <em>RPD</em> as 0.66, 0.53 g·kg<sup>-1 </sup>and 1.60, respectively. Comparison of the above three methods, the sequence of prediction accuracy was PLS-BPNN model>PLS><em>DI(NDR<sub>872</sub>, NDR</em><sub>1482</sub>), which indicated that the newly developed BPNN and PLS models were reliable for estimating soil TN content with high prediction accuracy, and <em>DI(NDR<sub>872</sub>, NDR</em><sub>1482</sub>) maybe a good indicator of soil TN content.
北京地区粘壤土全氮含量的光谱预测模型
[J].
Spectral prediction model of total nitrogen content of clay loam in Beijing
[J].
基于高光谱的矿区复垦农田土壤全氮含量反演
[J].准确快速估测矿区复垦农田土壤全氮含量是科学评价土地复垦质量的保障。以永城矿区复垦农田为例,对采集的土样进行化学处理和室内高光谱数据测量,对土壤高光谱数据进行3种数学变换,然后与全氮含量进行相关性分析并确定敏感波段。在此基础上,将偏最小二乘法回归(PLSR)模型分别与BP神经网络(BPNN)和随机森林(RF)相结合,建立了PLSR-BPNN和PLSR-RF两种土壤全氮含量高光谱反演模型,并将新建立的模型与传统的PLSR、BPNN和RF进行对比分析。结果表明:与利用单一模型相比,建立的PLSR-BPNN和PLSR-RF两种土壤全氮含量高光谱反演模型精度显著提高,特别是光谱数据经过一阶微分处理并利用PLSR-BPNN模型反演精度最高,验证组决定系数R<sup>2</sup>达到0.92,相对分析误差RPD为4.01。基于一阶微分光谱建立的PLS-BPNN模型是土壤全氮含量估测模型中的最优方法。研究成果为矿区复垦农田土壤全氮含量反演提供一定的参考价值。
Inversion of soil total nitrogen content in reclaimed farmland of mining area based on hyperspectral imaging
[J].Accurate and rapid estimation of soil total nitrogen (TN) content in reclaimed farmland is the guarantee of land reclamation quality evaluation. Soil samples from reclaimed farmland of Yongcheng mining area were chemically treated and the hyperspectral data were measured indoors. Soil hyperspectral data were transformed by three mathematical methods and then correlated with TN contents, and then the sensitive bands were determined. Subsequently, the partial least squares regression (PLSR) models with BP neural networks (BPNN) and random forest (RF) were combined to establish PLSR-BPNN and PLSR-RF models of inversion of soil TN content based on hyperspectral data. The newly established models were compared with the traditional PLSR, BPNN and RF models. The results showed that the accuracy of the synthetic models (PLSR-BPNN and PLSR-RF) was significantly improved compared to the single model algorithm. In particular, the accuracy of the spectral data processed by the first-order differential method PLSR-BPNN was the highest, with a decision coefficient (<em>R</em><sup>2</sup>) of 0.92 and a relative analysis error (RPD) of 4.01. Therefore, the PLS-BPNN model based on the first-order differential spectrum was the best one among the estimation models of soil TN content. The results provide reference for the retrieval of soil TN based on hyperspectral data in reclaimed farmland.
结合分数阶微分技术与机器学习算法的土壤有机碳含量光谱估测
[J].
Combination fractional order differential and machine learning algorithm for spectral estimation of soil organic carbon content
[J].
基于分数阶微分的土壤有机质含量高光谱反演研究
[J].
Hyperspectral inversion of soil organic matter content based on fractional differential
[J].
基于分数阶微分光谱指数的小麦条锈病遥感监测模型构建
[J].
Construction of remote sensing monitoring model of wheat stripe rust based on fractional differential spectral index
[J].
基于分数阶微分的博斯腾湖湖滨绿洲土壤电导率高光谱估算
[J].
Hyperspectral estimation of soil conductivity in oasis along Bosten Lake based on fractional differential
[J].
基于分数阶微分的盐渍土电导率高光谱估算研究
[J].
Hyperspectral estimation of electrical conductivity of saline soil based on fractional differentiation
[J].
New methods for improving the remote sensing estimation of soil organic matter content (SOMC) in the Ebinur Lake Wetland National Nature Reserve (ELWNNR) in northwest China
[J].DOI:10.1016/j.rse.2018.09.020 URL [本文引用: 2]
基于BP神经网络的草原矿区表层土壤N/P高光谱反演模型
[J].
Hyperspectral inversion of the surface soil N/P rationin a grassland mining area based on the BP network
[J].
基于主成分分析和支持向量机的木材近红外光谱树种识别研究
[J].
Research on near infrared spectrum with principal component analysis and support vector machine for timber identification
[J].
基于高光谱图像技术的番茄叶片氮素营养诊断
[J].
Nitrogen nutrition diagnosis of tomato leaves based on hyperspectral image technology
[J].
基于SVM的先分类再回归方法及其在产量预测中的应用
[J].针对非线性问题,提出了基于支持向量机分类基础的先分类、再回归的预测方法。根据实际需要和专业知识先将样本集进行分类,判别测试样本的类别后,再利用回归算法预测测试样本的值。利用这一算法进行粮食产量预测,并与其他模型预测结果相比,准确度远优于其他产量预测方法。实验说明:先分类、再回归得到的拟合值比直接利用回归得到的拟合值要精确。
The method of classification and regression based on SVM and its application in yield prediction
[J].DOI:10.3724/SP.J.1087.2010.02310 URL [本文引用: 1]
土壤Cu含量高光谱反演的BP神经网络模型
[J].
Hyper-spectral inversion of soil Cu content based on BP neural network model
[J].
Application of BP neural network based on genetic algorithm
[J].
基于思维进化优化BP神经网络的大豆叶片叶绿素含量高光谱反演
[J].
Hyperspectral retrieval of chlorophyll content in soybean leaves based on mind evolutionary optimization BP neural network
[J].
基于连续小波变换的土壤有机质含量高光谱反演
[J].
Hyperspectral inversion of soil organic matter content based on continuous wavelet transform
[J].
基于无人机高光谱分数阶微分的马铃薯地上生物量估算
[J].
Estimation of potato above-groud biomass based on fractional differential of UAV hyperspectral
[J].
土壤剖面的反射光谱研究
[J].
Study on the reflection spectrum of soil profile
[J].
灰漠土土壤全氮含量的高光谱特征分析及估测
[J].
Hyperspectral characteristic analysis and estimation of total nitrogen content in grey desert soil
[J].[Objective] To solve the traditional soil total nitrogen determination methods such as complexity,time-consuming,energy consumption and other issues.[Method] Gray desert soil in Xinjiang was taken as our research object to study the spectral reflection characteristics of different soil total nitrogen and by using classical statistical and spectroscopy method,the remote sensing inversion models of soil total nitrogen were established and validated in the study area.[Result] The results indicated that the content of total nitrogen in soil was similar to those of different spectral reflectance.The spectral reflectance of the soil appeared near 780,1,800 and 2,140 nm wavelength.There was obvious absorption valley in the vicinity of 1,910 nm and the correlation between the total nitrogen content in soil and the original spectral reflectance was poor.The determination coefficients of first-order differential processing to original spectral reflectance were higher than original spectral reflectance and second order differential,the maximum R2 was 0.819,reaching a very significant correlation;By using the first order differential transform to extract the characteristic bands 667 and 1,414 nm,the estimation model of soil total nitrogen content was established,they were:Y =2,698.048 X667-1,062.149 X1414-0.015.The R2 was 0.75;The estimation model validation found that the R2 was 0.80.When the total nitrogen content was too large or too small,the model estimation error was relatively large,and the overall prediction accuracy was quite high.The results has provided a theoretical basis to improve hyperspectral remote sensing monitoring accuracy of soil nitrogen.[Conclusion] High spectral analysis technique has certain significance for prediction of soil total nitrogen content and rapid identification of soil total nitrogen content by using the estimation model can be achieved.
基于分数阶微分的土壤含水量高光谱响应特征与估测模型构建
[J].
Analysis on soil moisture content hyperspectral response and construction of estimation model based on fractional-order derivative
[J].
基于小波变换和分数阶微分的冬小麦叶绿素含量估算
[J].
Estimation of chlorophyll content in winter wheat based on wavelet transform and fractional differential
[J].
