

0 引言
为了解区域生态系统状况,1990年起各国学者对生态系统服务价值(ecosystem services value,ESV)展开了系列研究[2],主要方法包括能值分析法、物质量分析法和价值分析法等[5]。价值量分析法计算简单、操作方便而被广泛使用[6]。1997年Costanza等[7]利用此方法率先构建了ESV估算的经典研究标准及方法,并对全球ESV进行科学估算。随后谢高地等[8⇓-10]根据我国的区域性特征,制定了中国生态系统服务价值当量因子表,为国内ESV估算演化提供了重要依据。由于价值量分析以货币为最终结果表达形式 [11],与国内生产总值(gross domestic product,GDP)具有可比较性,有助于判断生态系统服务与经济发展之间的互动关系,因而被广泛应用于生态经济关联分析之中。吴建寨等 [12]、Wang等 [13]和陈端吕等 [14]计算任意时间间隔下生态经济协调度与任意时期生态经济一致性指数,判断研究区内生态经济的相互关系; Li等 [15]通过变异系数描述ESV和GDP的集中分散程度; 阳华等[16]将重心模型引入生态评价中探究生态服务价值与经济重心的因果扰动。前人研究综合考虑地理学、经济学与生态学等众多学科,为生态经济研究提供了理论基础与技术途径。但目前大多数研究仅关注生态-经济之间的整体变化趋势,缺乏对区域内各单元生态、经济空间差异水平与聚集特征的探讨,同时在改善生态环境方面未从驱动因子角度给予合理建议。
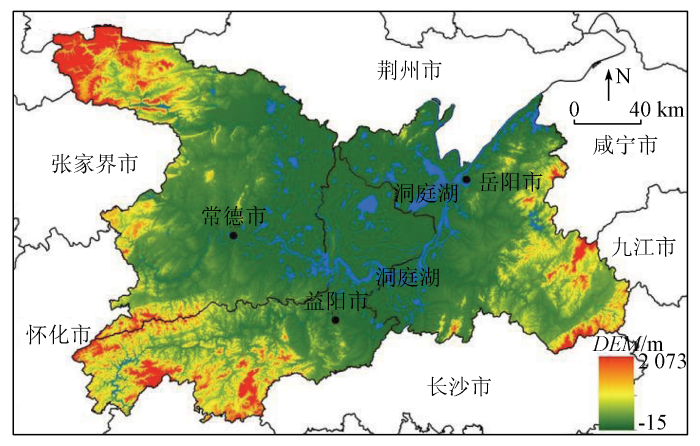
洞庭湖区位于湖南湖北两省交界地带,是长江中下游重要的生态节点[17],也是湖南省北部生态屏障。2014年国务院批复《洞庭湖生态经济区规划》,推动岳阳、常德和益阳等城市圈发展,为湖区带来机遇的同时,也带来了更大的生态压力。因此,本文以洞庭湖区(岳阳、常德和益阳)为研究对象,以其中24个区县为研究单元,基于2000年、2010年和2020年土地利用空间数据,对其生态系统服务价值进行定量化计算,构建生态经济的一致性、协调度指数,探究生态与经济两者间时空差异情况,并通过分析ESV空间分异的驱动因素,提出区域生态系统服务与经济之间可持续发展的优化建议。
1 研究区概况与数据源
1.1 研究区概况
图1
1.2 数据来源
本文基于湖区2000年、2010年和2020年Landsat TM/OLI遥感数据。在ArcGIS 10.2和ENVI平台的支持下,依据《全国土地分类》将湖区用地类型划分耕地、林地、草地、湿地、未利用地、水域和建设用地7类,空间分辨率为30 m,经过精度检验后Kappa值均达到0.80以上,符合研究要求。粮食生产数据来源于《湖南省农村统计年鉴》,社会经济数据来源于湖南省及各市统计年鉴,高程数据来源于地理空间数据云平台(http://www.gscloud.cn/sources/),道路交通数据来源于OSM平台(https://www.openstreetmap.org/#map=10/31.1458/121.3385),年均温和降水来源于国家气象科学研究中心(http://data.cma.cn/)。
2 研究方法
2.1 生态服务价值评估
2.1.1 当量因子表构建
表1 洞庭湖区单位面积ESV系数
Tab.1
| 生态系统服务 | 土地利用类型 | ||||||
|---|---|---|---|---|---|---|---|
| 耕地 | 林地 | 草地 | 湿地 | 未利用地 | 水域 | 建设用地 | |
| 食物生产 | 1 922.40 | 701.11 | 859.43 | 1 153.44 | 0.00 | 1 809.32 | 0.00 |
| 原材料供应 | 904.66 | 1 605.77 | 1 266.52 | 1 130.83 | 0.00 | 520.18 | 0.00 |
| 水资源供给 | 45.23 | 836.81 | 701.11 | 5 857.68 | 0.00 | 18 749.09 | 0.00 |
| 气体调节 | 1 515.31 | 5 314.88 | 4 455.45 | 4 297.14 | 45.23 | 1 741.47 | 0.00 |
| 气候调节 | 814.19 | 15 899.41 | 11 783.21 | 8 141.95 | 0.00 | 5 179.18 | -8 752.59 |
| 净化环境 | 226.17 | 4 500.69 | 3 890.04 | 8 141.95 | 226.17 | 12 552.17 | -6 490.94 |
| 水文调节 | 610.65 | 7 938.40 | 8 639.51 | 54 799.82 | 67.85 | 231 231.27 | -10 245.28 |
| 土壤保持 | 2 329.50 | 6 468.32 | 5 427.96 | 5 224.42 | 45.23 | 2 103.34 | 3 731.73 |
| 维持养分循环 | 271.40 | 497.56 | 407.10 | 407.10 | 0.00 | 158.32 | 0.00 |
| 生物多样性 | 294.01 | 5 880.29 | 4 930.40 | 17 799.20 | 45.23 | 5 767.21 | 0.00 |
| 美学景观 | 135.70 | 2 578.28 | 2 171.19 | 10 697.61 | 22.62 | 4 274.52 | 4 704.24 |
| 总计 | 9 069.22 | 52 221.54 | 44 531.92 | 117 651.12 | 452.33 | 284 086.07 | -17 052.85 |
2.1.2 当量系数修正
式中: fj为第j个栅格的植被覆盖度; NDVI为归一化植被指数; NDVImax和NDVImin分别为此像元全年NDVI的最大值和最小值。
式中: Rj为每个栅格的调整系数; fmean为区域内植被覆盖度均值。
2.1.3 ESV核算
根据各年份湖区各类用地量,利用表1价值系数及修正系数,通过式(3)对研究区域ESV值进行加乘,并以区县为单元统计各地区ESV总值,公式为:
式中: E为区域ESV值; S为用地面积; M为价值系数; i为用地类型; j为栅格序号。
2.2 生态系统服务与经济时空协调关系
2.2.1 重心计算与变异系数
对不同变量不同时期的重心进行研究,有利于更好地把握区域生态服务价值与经济发展空间耦合关系及时空变异情况,生态经济重心距离越近,代表重心耦合程度越高,公式为:
式中: (X,Y)为ESV或GDP的重心坐标; (Xk,Yk)为第k个区县的城市中心坐标; Ak为第k个县ESV或GDP的值; K为区县单元数量。
变异系数(coefficient of variation,CV)是无量纲指标,用来反映区域内各单元之间在某项指标上的差异或离散程度。本文利用该指标反映洞庭湖区整体在生态或经济上的不平衡情况。系数越小,表明各地区ESV(GDP)差距越小,公式为:
式中A0为ESV或GDP的平均值。
2.2.2 生态经济协调性与一致性计算
目前对生态经济协调的评价并没有统一的标准,本文通过生态经济协调性(eco-environment health,EEH)及一致性指数(consistency of eco-economic,CEE)表达各区县生态经济的变化情况和差异关系。EEH代表某时期内生态服务与经济发展之间的动态变化情况,由于各单元GDP值在研究期内持续增长,故EEH<0代表生态经济呈现失衡状态,EEH>0则代表生态经济好转,值越接近于0代表生态经济的协调程度越高[14]。CEE值用来反映单元在湖区生态经济的集聚能力和潜能,CEE值越接近于1表明生态经济一致性越高,CEE>1代表该单元生态聚集大于经济聚集,具有良好的生态潜能,反之代表经济聚集大于生态聚集[6],公式为:
式中: EEHk为第k个区县的生态经济协调度;
式中: CEEk,
2.3 生态服务价值空间分异驱动因子
2.3.1 ESV人为影响指数
式中:
2.3.2 地理探测器
图2
3 结果与分析
3.1 土地利用类型变化特征
表2 洞庭湖流域土地利用变化
Tab.2
| 年份 | 统计量 | 耕地 | 林地 | 草地 | 湿地 | 未利用地 | 水域 | 建设用地 |
|---|---|---|---|---|---|---|---|---|
| 2000年 | 面积/km2 | 17 153.85 | 21 103.9 | 787.08 | 1 626.37 | 0.46 | 4 035.42 | 881.79 |
| 占比/% | 37.63 | 46.29 | 1.73 | 3.57 | 0.00 | 8.85 | 1.93 | |
| 2010年 | 面积/km2 | 16 933.75 | 21 075.51 | 743.27 | 1 683.55 | 0.51 | 4 130.29 | 1 020.74 |
| 占比/% | 37.15 | 46.23 | 1.63 | 3.69 | 0.00 | 9.06 | 2.24 | |
| 2020年 | 面积/km2 | 16 644.74 | 20 965.75 | 721.20 | 1 948.92 | 13.59 | 3 876.43 | 1 419.44 |
| 占比/% | 36.51 | 45.99 | 1.58 | 4.27 | 0.03 | 8.50 | 3.11 |
图3
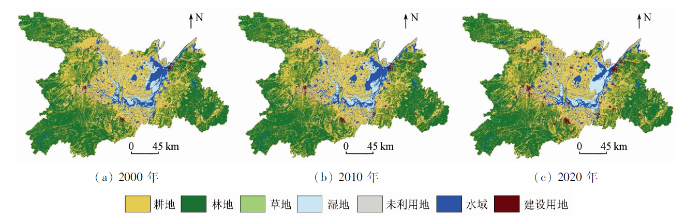
图3
洞庭湖区土地利用类型及变化
Fig.3
Types of land use and their variations in the Dongting Lake area
表3 洞庭湖区2000—2020年土地利用转移矩阵
Tab.3
| 年份 | 土地利用类型 | 2000年 | ||||||
|---|---|---|---|---|---|---|---|---|
| 草地 | 耕地 | 建设用地 | 林地 | 湿地 | 水域 | 未利用地 | ||
| 2020年 | 草地 | 659.79 | 14.69 | 1.03 | 41.67 | 0.93 | 2.49 | 0.00 |
| 耕地 | 11.96 | 15 634.26 | 98.20 | 502.95 | 189.61 | 206.28 | 0.01 | |
| 建设用地 | 6.54 | 406.79 | 740.18 | 230.42 | 6.01 | 29.38 | 0.05 | |
| 林地 | 66.33 | 579.67 | 16.86 | 20 244.17 | 3.40 | 48.30 | 0.07 | |
| 湿地 | 36.17 | 74.02 | 3.23 | 3.39 | 1 262.30 | 569.71 | 0.00 | |
| 水域 | 4.93 | 439.86 | 22.02 | 69.67 | 162.74 | 3 176.46 | 0.00 | |
| 未利用地 | 0.54 | 2.31 | 0.21 | 6.19 | 1.28 | 0.93 | 0.33 | |
3.2 ESV变化特征
表4为洞庭湖区单项ESV及其变化,如表4所示,2000—2020年间湖区ESV值整体减少58.95亿元,各单项生态服务功能除生物多样性和美学景观外均下降,这是因为除建设用地、未利用地和湿地外,其他地类明显减少。此外,单项ESV中水文调节贡献率最大,变化率最高。其中2000—2010年,洞庭湖区ESV值由2 615.41亿元增加至2 641.29亿元,增加了25.88亿元,主要由于区域水文调节服务能力提升,由此可见该时期内水域面积增加抵消了耕地、林地减少以及建设用地扩张带来的消极影响。2010—2020年间湖区ESV值减少39.77亿元,水文调节、气候调节和净化环境等生态服务能力均出现下降。其一,这段时期洞庭湖生态经济区成立,同时《湖南省推进新型城镇化实施纲要(2014—2020 年)》出台,受新城镇化改革政策加持,各市大力推进城市化进程,导致建设用地持续占用耕地和林地等生态用地,区域植被覆盖水平降低。其二,近年来洞庭湖干流水位下降[28],导致大面积高价值水域向价值相对较低的湿地转变。
表4 洞庭湖区单项ESV及其变化
Tab.4
| 生态系统服务类型 | ESV/亿元 | ESV变化量/亿元 | ||||
|---|---|---|---|---|---|---|
| 2000年 | 2010年 | 2020年 | 2000—2010年 | 2010—2020年 | 2000—2020年 | |
| 食物生产 | 57.63 | 54.16 | 53.46 | -3.47 | -0.70 | -4.17 |
| 原材料供应 | 54.34 | 54.16 | 53.46 | -0.19 | -0.70 | -0.89 |
| 水资源供给 | 104.17 | 106.22 | 101.52 | 2.05 | -4.70 | -2.65 |
| 气体调节 | 155.68 | 155.41 | 153.80 | -0.27 | -1.61 | -1.88 |
| 气候调节 | 385.20 | 383.80 | 376.13 | -1.41 | -7.67 | -9.08 |
| 净化环境 | 160.10 | 160.50 | 154.90 | 0.41 | -5.60 | -5.20 |
| 水文调节 | 1 198.01 | 1 220.92 | 1 155.38 | 22.91 | -65.54 | -42.63 |
| 土壤保持 | 201.01 | 201.10 | 200.28 | 0.08 | -0.82 | -0.73 |
| 维持养分循环 | 16.78 | 16.72 | 16.53 | -0.05 | -0.20 | -0.25 |
| 生物多样性 | 185.24 | 186.36 | 187.31 | 1.12 | 0.95 | 2.07 |
| 美学景观 | 97.24 | 98.72 | 101.01 | 1.47 | 2.29 | 3.76 |
| 总计 | 2 615.41 | 2 641.29 | 2 556.46 | 25.88 | -84.83 | -58.95 |
图4
3.3 ESV与GDP时空协调分析
本文以区县为单元对区域ESV与GDP为代表的生态服务与经济发展情况进行定量计算与时空协调分析(图5)。据统计,洞庭湖区 2000年、2010年和2020年GDP(按2020不变价计算)总量分别是 819.16亿元、3 285.48亿元和9 637.82亿元,相比于ESV的起伏性变化,GDP平均以440.93亿元/a的速度大幅上涨。其与单项ESV对比发现,湖区粮食生产、原材料供应、气体和气候调节等生态服务功能与经济增长呈反比,生物多样性与美学景观则与经济增长呈正比。
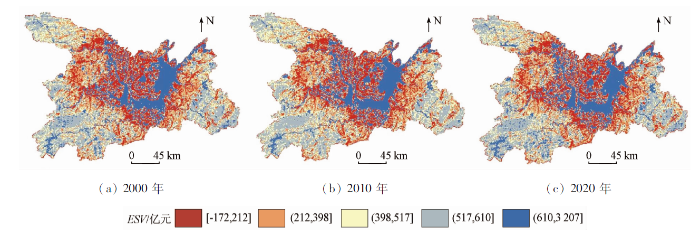
图5
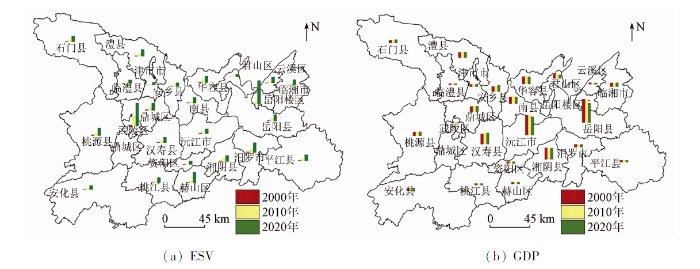
图5
洞庭湖区ESV和GDP空间分布
Fig.5
Spatial distribution of ESV and GDP in the Dongting Lake area
湖区总体来看,就ESV和GDP空间重心坐标而言,ESV重心在GDP重心的东北方向,但重心点位置差距较小具有耦合特征,同时随时间推移两者同步向西迁移,与东侧湖区水体缩减,水文调节功能减弱以及西侧常德市积极应对生态城市建设,提升湿地、水体服务能力密切相关,具体如表5所示。同时就CV而言,ESV的CV减小趋势稳定,而GDP的CV随时间的推移而增大且变化较大,说明ESV的区内差异维持一个相对稳定值,GDP差异与不均衡性则越来越大。
表5 ESV与GDP的变异系数CV与重心坐标
Tab.5
| 指数 | 2000年 | 2010年 | 2020年 | ||
|---|---|---|---|---|---|
| 重心坐标 | ESV | 经度/(°) | 112.45 | 112.44 | 112.42 |
| 纬度/(°) | 29.09 | 29.09 | 29.09 | ||
| GDP | 经度/(°) | 112.27 | 112.15 | 112.18 | |
| 纬度/(°) | 29.06 | 29.02 | 29.07 | ||
| CV | ESV | 0.733 6 | 0.729 7 | 0.694 4 | |
| GDP | 0.466 9 | 0.665 9 | 0.699 5 | ||
湖区内各区县2000—2020年EEH和2020年CEE指标如表6所示。湖区EEH在-0.02~0.01之间,生态经济协调性良好,其中君山区的EEH最低为-0.018 6,津市市EEH最高为0.008 3,EEH的正负单元数基本相当。2000—2020年间各区县的经济快速发展,经济的增长率远大于生态的变化程度,这一方面得益于工业化、机械化的推进,另一方面是由于区域交通发展提供的吸引力。从CEE来看,2020年湖区生态服务价值与经济集聚匹配程度较低,岳阳市的临湘、平江县,常德市的汉寿县、石门县CEE均大于2,说明其在湖区生态基础较好,但经济发展水平较弱,生态集聚水平远高于在湖区的经济集聚水平。岳阳楼区、云溪区、津市市、临澧县、武陵区和赫山区均小于0.5,说明在区域经济发展水平处于湖区前列,但生态集聚与服务的水平较差,从空间上可看出以上区域均为建设量较大、人口密集,为各市的核心功能区。
表6 洞庭湖区EEH与CEE测算结果
Tab.6
| 市 | 区县 | EEH | CEE |
|---|---|---|---|
| 岳阳市 | 岳阳楼区 | -0.006 7 | 0.196 5 |
| 岳阳县 | -0.008 5 | 1.672 1 | |
| 云溪区 | -0.010 1 | 0.489 1 | |
| 华容县 | -0.000 9 | 0.790 9 | |
| 君山区 | -0.018 6 | 0.505 4 | |
| 临湘市 | 0.002 9 | 2.001 8 | |
| 汨罗市 | 0.001 1 | 0.952 3 | |
| 平江县 | 0.000 9 | 3.117 4 | |
| 湘阴县 | -0.001 8 | 1.667 4 | |
| 常德市 | 安乡县 | 0.004 3 | 0.197 9 |
| 鼎城区 | 0.001 6 | 1.301 3 | |
| 汉寿县 | 0.006 3 | 3.276 0 | |
| 津市市 | 0.008 3 | 0.381 7 | |
| 澧县 | 0.004 8 | 0.973 6 | |
| 临澧县 | -0.000 7 | 0.476 8 | |
| 石门县 | 0.003 6 | 2.185 3 | |
| 桃源县 | 0.000 8 | 1.503 4 | |
| 武陵区 | -0.010 3 | 0.161 7 | |
| 益阳市 | 安化县 | 0.001 1 | 0.809 6 |
| 赫山区 | -0.005 9 | 0.434 6 | |
| 南县 | 0.000 9 | 1.323 3 | |
| 桃江县 | -0.001 8 | 1.147 3 | |
| 沅江市 | -0.007 1 | 1.954 1 | |
| 资阳区 | 0.000 5 | 0.506 5 |
3.4 ESV空间分异驱动因素
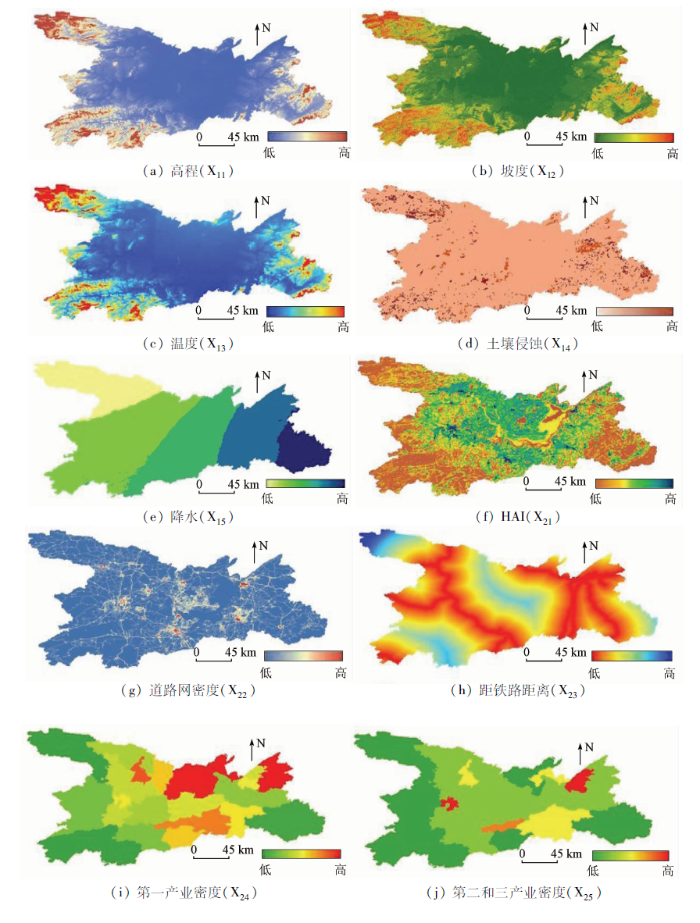
表7 ESV空间分异的驱动力q
Tab.7
| 驱动 因子 | X11 | X12 | X13 | X14 | X15 | X21 | X22 | X23 | X24 | X25 |
|---|---|---|---|---|---|---|---|---|---|---|
| q | 0.20 | 0.19 | 0.11 | 0.01 | 0.19 | 0.44 | 0.01 | 0.04 | 0.19 | 0.07 |
4 讨论与建议
洞庭湖区是我国长江中下游地区重要的生态节点,对全域生态具有重要影响[31],分析湖区生态系统服务价值的空间分布及其与经济增长之间的关系是实现资源合理利用的前提。结果表明,区域内经济发展、城市化的推进,湖区用地结构发生改变,部分高生态价值用地转变为低生态价值用地或城市用地,导致研究期内ESV整体减小。同时,20 a来湖区内部ESV空间结构相对稳定,而经济差距则进一步拉大。一方面,由于湖区内资源要素分布不均匀,山水河湖等生态服务较高的区域,经济发展尚有进步空间; 另一方面,占据交通信息条件与人口资源等发展要素的城市集中建成区域,经济发展迅速。
因此,就整个区域而言,应构建以洞庭湖及周边水体为生态廊道,周边山体为生态保护屏障的生态安全格局。识别生态保护红线,强化对ESV高值区的保护,严格限制开发利用。其次,以区域各区县生态经济的差异和影响生态服务价值的空间驱动为依据,为区域内部生态经济协调发展提供针对性指导方案: ①EEH>0且CEE>1的临湘市、平江县、鼎城区和汉寿县等地,应当继续发挥生态经济优势,增强经济发展动能,促进区域高质量发展; ②EEH>0且CEE<1的汨罗市、安乡县、津市市和澧县等地,在保护当地自然环境本底的同时,弥补生态短板,提高生态环境质量,强化与周边区域的生态联系,遵循因地制宜的土地利用开发模式; ③EEH<0且CEE>1的岳阳县、湘阴县和桃江县等地,应转变经济发展模式,重视生态环境保护治理监控机制,借鉴生态经济稳定协调发展地区的模式,坚持产业转型升级与推动高质量发展,多维度、综合全面地探究新型发展道路[32]; ④EEH<0且CEE<1的岳阳楼区、云溪区、临澧县、武陵区和赫山区等地,高度重视用地转变对生态的影响,在实现用地节约集约利用,控制建设用地总量提高利用效率[33],促进产业高质量转型升级,提高人为因素对区域生态的干预作用,建立合理的定向化生态补偿机制,完善区域生态修复治理[34]。
5 结论
本文研究利用当量因子法对2000年、2010年和2020年洞庭湖区ESV进行了货币化定量核算,计算总量上与邓楚雄等[35]成果较为接近。同时,由于本文计算EEH和CEE指标,对生态经济之间的关系做出了纵向时间维度以及横向各区县的对比分析,并通过探讨生态服务价值的驱动因子,为区域生态经济平衡提出了针对性的建议。本文主要结论如下:
1)研究期内湖区ESV经历了先上升后下降的过程,与土地利用的转换存在直接关联。湖区2000年ESV为2 615.41亿元,2010年2 641.29亿元,2020年减至2 556.46亿元,主要由于水域、耕地和林地的减少,建设用地的增加。从空间上,湖区ESV高低值分布特征呈现出中间水域高、四周山体次之、环状平原最低的格局。从单项ESV来看,水文调节功能占比最高,这是因为水文调节的单项面积ESV系数较高同时湖区水域面积广阔,但在2000—2020年间,区域内水文调节ESV总体呈现出递减趋势,湖区应当加大对现有水域的保护,避免水域向其他用地类型转换。
2)湖区生态经济的关系既存在耦合关系又存在差异性。就湖区整体而言,耦合性体现在ESV与GDP的空间重心区域基本一致。同时,两者又存在差异性,湖区ESV的差异值正在逐渐缩小,而GDP的差异值正在进一步拉大。就各区县单元而言,EEH指数接近于0,区域生态变化率明显小于经济的变化率。CEE指数来看,ESV聚集与GDP聚集存在空间差异,ESV集聚大于GDP集聚的主要位于洞庭湖及其沿岸,GDP集聚大于ESV集聚的一般为各市中心区,及城市化水平较高的区域。
3)对ESV的驱动因子进行分析显示,对ESV影响最高的为HAI,其次为坡度、坡向和降水等自然因素。因此,对区域的生态经济优化,应当从保护“山水林田湖草”、强化人为干预、提供生态修复措施等方面入手,针对各单元现状采取因地制宜的方针政策。
本研究对湖区ESV进行计算,从多个角度对区县生态经济的协调情况进行了分析。可为区域生态服务与经济发展的优化以及各区县未来的发展重点提供重要数据基础,同时此方法对其他地区生态经济和谐发展的战略制定具有借鉴意义。但本文存在以下不足之处: ①经济发展仅考虑GDP指标,忽略了产业结构及复杂的市场过程; ②生态服务价值的空间差异是各因子相互干扰的复杂过程,因此还需要增加对其他驱动要素及驱动因子关联影响的相关研究。
参考文献
大小兴安岭生态资产变化格局
[J].
The pattern of ecological capital in Daxiaoxinganling,Heilongjiang Province,China
[J].
Nature’s services:Societal dependence on natural ecosystems
[J].DOI:10.1023/A:1023307309124 URL [本文引用: 2]
Landscape services as a bridge between landscape ecology and sustainable development
[J].DOI:10.1007/s10980-008-9314-8 URL [本文引用: 1]
青岛都市圈生态系统服务-经济发展时空协调性分析及优化利用
[J].
Spatio-temporal coordination between ecosystem services and economic development and its optimal utilization in Qingdao Metropolitan Region,China
[J].
The value of the world’s ecosystem services and natural capital
[J].DOI:10.1016/S0921-8009(98)00020-2 URL [本文引用: 1]
青藏高原生态资产的价值评估
[J].
Ecological assets valuation of the Tibetan Plateau
[J].
DOI:10.11849/zrzyxb.2003.02.010
[本文引用: 2]

Based on a series of1∶1000000maps of natural resources of China,6categories of ecological assets were divided,which included forest,grassland,farmland,wetland,water body and desert.By means of GIS,the1∶4000000Ecological Assets Map of Tibetan Plateau was compiled and the relative data were calculated.According to partial global ecosystem services value evaluation results obtained by Costanza et al.(1997)along with responses of ecological questionnaire s from specialists of China,this paper established the ecosystem services value unit area of Chinese terrestrial ecosystems.We used the ecological assets value table as a basis and also adjusted price value by biomass and then,the ecological assets value of the Tibetan Plateau was estimated.The results indicated that ecosystem services value of Tibetan Plateau is some 9363.9×10<sup>8</sup> yuan annually,accounting for17.68%of annual ecosystem services value of China and0.61%of the world.The value of soil formation and disposition provided by ecosys-tem s is the highest,which occupies19.3%of the total ecosystem services value and then,the value of waste treatment takes up16.8%,water conservation value,16.5%and biodiversity,16%.The forest and the grassland ecosystem s offered the main ecosystem services value,being31.3%and48.3%of the total value provided by different ecosystem types,respectively.
我国粮食生产的生态服务价值研究
[J].
Study on ecosystem services value of food production in China
[J].
基于单位面积价值当量因子的生态系统服务价值化方法改进
[J].
Improvement of ecosystem service value method based on unit area value equivalent factor
[J].
基于可持续发展综合国力的生态系统服务评价研究——13个国家生态系统服务价值的测算
[J].
DOI:10.12011/1000-6788(2003)1-121
[本文引用: 1]
分析了生态系统服务的内涵,探讨了生态系统服务评价的意义,对比分析了生态系统服务评价的方法,最后测算了澳大利亚、巴西、英国、加拿大、中国、法国、德国、印度、意大利、日本、俄罗斯、南非、美国等 1 3个国家的生态系统服务价值.
Ecosystem services evaluation based on comprehensive national power for sustainable development:The evaluations on 13 countries
[J].
生态系统服务价值变化在生态经济协调发展评价中的应用
[J].
Ecosystem service its application in evaluation of eco-economic harmonious development
[J].
Evaluation of concordance between environment and economy in Qinghai Lake watershed,Qinghai Tibet Plateau
[J].DOI:10.1007/s11442-011-0892-z URL [本文引用: 1]
土地利用生态服务价值与经济发展的协调及空间分异——以西洞庭湖区为例
[J].
DOI:10.11821/dlyj201809003
[本文引用: 2]
土地利用生态服务价值体现了土地通过集约利用与空间优化所发挥生态效益的大小,可在一定程度上反映土地利用与与经济发展的协调关系。以西洞庭湖区为研究对象,在ArcGIS软件支持下,通过评价与分析生态服务价值变化,分析生态经济协调发展水平及其空间差异,探讨土地利用生态服务价值与区域经济发展的互动响应与耦合协调关系。研究表明:① 2000年以来西洞庭湖区土地利用生态服务价值呈下降趋势,2000年西洞庭湖区生态服务价值为1292.13×10<sup>6</sup>元·a<sup>-1</sup>,2011年为953.03×10<sup>6</sup>元·a<sup>-1</sup>,损失339.10×10<sup>6</sup>元。② 从整个研究区来看,整个研究阶段处于低度冲突的县有6个,分别为常德市辖区、安乡县、汉寿县、澧县、临澧县、津市市,只有桃源县处于潜在危机状态。从数量上看,整个区域内大多为冲突状态,区域在经济发展中存在的潜在危机较大。③ 从空间分异来看,2008年与2011年土地利用生态经济协调度基本上为低度冲突状态,需采取生态服务供给恢复与重建措施,控制生态服务消费需求的过快增长。整个区域只有桃源县与汉寿县由不协调转换为协调状态,主要原因是森林覆盖率相对较高,林地类型面积大,水土保持与水源涵养生态服务功能较强,提高了生态服务价值。
Spatial differentiation and coupling effect between land ecosystem services value and economic develo-pment:A case study of west Dongting Lake area
[J].
Spatial disparity dynamics of ecosystem service values and GDP in Shaanxi Province,China in the last 30 years
[J].DOI:10.1371/journal.pone.0174562 URL [本文引用: 1]
三峡库区生态系统服务价值与经济重心演变的耦合分析
[J].
Coupling analysis of ecosystem service value and economic gravity evolution in the Three Gorges Reservoir area
[J].
洞庭湖区生态承载力系统耦合协调度时空分异
[J].
DOI:10.13249/j.cnki.sgs.2014.09.1108
[本文引用: 1]
不同时空尺度下,生态承载力系统耦合协调度呈现不同差异和变化。在阐述耦合协调发展作用机理的基础上,构建了耦合协调度评价指标体系,利用容量耦合模型对洞庭湖区生态承载力系统耦合协调度进行时空分析。结果表明:① 时序变化上,2001~2012年洞庭湖区生态承载力系统耦合度和耦合协调度变化趋势基本趋同,大致呈现同步稳定上升态势,耦合度均值达0.499,处于拮抗阶段;耦合协调度均值达0.463,处于中度耦合协调阶段;年均增长率上,耦合度达3.35%,大于耦合协调度的3.05%。表明生态承载力内部系统耦合作用和协同效应明显,并且耦合作用的强度大于内部协调性。② 空间分异上,17个县域的耦合度出现了低水平耦合、拮抗阶段和磨合阶段3种状态,3种耦合状态的县域个数和区间变化呈现不同的差异。耦合协调度出现了低度耦合协调、中度耦合协调和高度耦合协调3种状态,其变化状况基本上与耦合度类似,但从协调状态的县域个数和区间变化来看,耦合协调度的变化稍滞后于耦合度的变化,空间分布与耦合度分布特征基本相似,高、低值区的空间分布由西南向东北大致呈现较低-高-低-高-较低的“M”型基本格局。③ 空间组合上,17个县域出现了低耦合低协调区、中耦合低协调区、中耦合中协调区、高耦合中协调区和高耦合高协调区5种空间组合类型,其基本空间格局是,低耦合低协调区集中分布在洞庭湖区中部和西南部,高耦合高协调区则沿京广线、石长线和常岳高速三线呈“三足鼎立”布局,其它不同组合类型则集中于高耦合高协调区外围呈“零星状”分布。
Spatio-temporal difference of coupling coordinative degree of ecological carrying capacity in the Dongting Lake region
[J].
北京区位土地利用与生态服务价值变化研究
[J].
Land utilization and changes on eco-service value in different locations in Beijing
[J].
植物生物量研究综述
[J].
A review of researches on plant biomass
[J].
中国陆地生态系统生态资产遥感定量测量
[J].
Remote sensing quantitative measurement of ecological assets of terrestrial ecosystem in China
[J].
城市边缘区景观变化与人为影响的空间分异研究
[J].
Spatial different analysis of landscape change and human impact in urban fringe
[J].
DOI:10.13249/j.cnki.sgs.2001.03.210
[本文引用: 1]
Based on remote sensing images in 1988,1993 and 1998, the Mashan's landscape was conducted through methods of maximum-like and probabilistic relaxation, which revealed the city's spatial process during 11 years. The authors analyzed the relations between landscape changing and human impacting. A spatial variance, human impact index, was raised to express the spatial distribution of human exploiting and using strength. Using this index, mesh sampling method and geostatistics tool, the authors studied the landscape human impact conditions during the past 11 years, and revealed the spatial characteristics of human exploiting and using strength and their relation with the regional social and economic development.The conclusions may be distinguished as follows: (1) The results of the detection are reasonable and it is feasibility to calculate the transfer matrix of landscape to show spatial pattern of landscape distribution as unit of image pixel. (2) The main characteristics of Mashan's landscape changing are obvious reduction of the existing agricultural landscape and subsequent rapid increase of urban landscape along Guzhu road and cycle road which are main developing axes during the recent 5 years. In 1988, agricultural production was the main human impact of Mashan landscape, but in 1998, urban development and so on has be the main human active. The typical agricultural landscape in 1988 transforms to the urban fringe landscape in 1998. (3) The spatial characteristics of human exploiting and using had strong relations with the economic activities in Mashan Town. When agricultural production was the main human active in 1988, the semivariagram of impact index was very low and in short ranges. In 1993 and 1998, non-agricultural land exploitation were the most important type of human disturbance, the semivariagram was high and in long ranges. Because the north-south belt area was the main exploiting region, the semivariagram was anisotropic from 1988 to 1998, but when the northern new developing belt area and cycle road began to be constructed from 1992, it became more and more isotropic.
1990—2011年三峡库区生态系统服务价值演变及驱动力
[J].
Analysis of evolution and driving force of ecosystem service values in the Three Gorges Reservoir region during 1990—2011
[J].
地理探测器:原理与展望
[J].
DOI:10.11821/dlxb201701010
[本文引用: 1]
空间分异是自然和社会经济过程的空间表现,也是自亚里士多德以来人类认识自然的重要途径。地理探测器是探测空间分异性,以及揭示其背后驱动因子的一种新的统计学方法,此方法无线性假设,具有优雅的形式和明确的物理含义。基本思想是:假设研究区分为若干子区域,如果子区域的方差之和小于区域总方差,则存在空间分异性;如果两变量的空间分布趋于一致,则两者存在统计关联性。地理探测器q统计量,可用以度量空间分异性、探测解释因子、分析变量之间交互关系,已经在自然和社会科学多领域应用。本文阐述地理探测器的原理,并对其特点及应用进行了归纳总结,以利于读者方便灵活地使用地理探测器来认识、挖掘和利用空间分异性。
Geodetector:Principle and prospective
[J].
Geographical detectors-based health risk assessment and its application in the neural tube defects study of the Heshun Region,China
[J].DOI:10.1080/13658810802443457 URL [本文引用: 1]
近20 a来巢湖流域生态服务价值空间分异机制的地理探测
[J].
DOI:10.11821/dlyj020181075
[本文引用: 1]
生态系统服务功能是生态系统和生态过程形成和维持的自然环境条件及作用。基于1995—2017年遥感分类数据,对研究区按3 km×3 km幅度网格化2019个样方,利用空间统计和缓冲区等方法进行巢湖流域生态服务价值时空演变特征分析,应用地理探测器工具揭示生态服务价值空间分异的主导因子及因子交互作用机制,并提出生态服务价值空间优化策略。结果表明:① 巢湖流域生态服务价值量由1995年的303.17亿元分别下降为2005年300.95亿元和2017年287.70亿元,近20a来减少约5.11%,年均下降率0.23%,其中合肥市区、巢湖南部和东部地区降速明显;② 生态服务价值等级空间转移分析表明,巢湖流域低级别生态服务价值区域在扩展,中等及高级别区域在缩小。以巢湖为核心的缓冲区分析表明,20a来缓冲区核心环带内生态服务价值量下降18.55%,巢湖流域水环境保护核心区的生态系统功能变化值得关注;③ 地理探测分析表明,人为影响综合指数是生态服务价值空间分异的主导因子;地形、气象因素是重要影响因子;人为影响指数因子、自然因子及社会经济因子的交互协同增强效应共同影响了流域生态服务价值在空间上的分异效果。研究结果在一定程度上可为巢湖流域生态系统调控与优化提供理论依据。
Spatial differentiation of ecosystem service values and its geographical detection in Chaohu Basin during 1995—2017
[J].
洞庭湖近30 a水位时空演变特征及驱动因素分析
[J].
Temporal and spatial variations of water level and its driving forces in Lake Dongting over the last three decades
[J].DOI:10.18307/2017.0421 URL [本文引用: 1]
中国陆地生态系统生态资产测量及其动态变化分析
[J].
Measurement and dynamic analysis of ecological capital of terrestrial ecosystem in China
[J].
黄河下游地区土地利用和生态系统服务价值的时空演变
[J].
Spatial-temporal evolution of land use and ecosystem service value in the lower reaches of the Yellow River region
[J].
中国陆地经济与生态环境协调发展的空间演变
[J].
Evaluation of the coordinated development of economy and eco-environmental systems and spatial evolution in China
[J].
甘肃省生态资产价值和生态-经济协调度时空变化格局
[J].
DOI:10.11849/zrzyxb.20160181
[本文引用: 1]
在地理信息技术和遥感数据支持下,对甘肃省2000和2010年的生态资产价值及其空间分布格局进行了定量测度。构建空间生态资产价值经济协调度模型,测算了甘肃省生态资产价值与经济发展水平协调状况。结果表明:1)甘肃省生态系统在2000和2010年的生态资产价值分别为2 430.84×10<sup>8</sup>和2 487.40×10<sup>8</sup>元;2)林地对甘肃省生态资产价值的贡献量最大;陇南市和甘南州的生态资产价值占甘肃省总价值的一半左右;3)生态资产价值的空间分布整体上呈现西北低、东南高的特征,11 a间生态资产价值增加较多的区域主要分布在河西走廊中部和陇东;4)11 a间,甘肃省各市州生态资产价值与GDP比值均出现不同程度的减小,生态资产价值增长与GDP增长不协调;5)生态-经济协调分区中,潜在危机区的面积最大,其次是低度冲突区和关系恶化区。
The Spatio-temporal variation of ecological property value and eco-economic harmony in Gansu Province
[J].
DOI:10.11849/zrzyxb.20160181
[本文引用: 1]
With the fast development of socio-economic, more attention has been focused on the property value of natural resources and environmental benefit. In this regard, Ecological Property Value (EPV), which is considered as one of the most significant resource and wealth in a country, has being concerned more and more in recent years. EPV is one of the bases of social development. Understanding the EPV in a region is very useful in taking effective management to improve the sustainable development. So, it is very important to assess the EPV. Massive vector and raster spatial data are analyzed in the environment of GIS software. Remote sensing data sets, as well as meteorological data, NDVI and GDP, are resampled at a spatial resolution of 1 km. The EPV and its spatial-temporal variation in Gansu Province from 2000 to 2010 are evaluated and the spatial distribution maps of EPV are drawn. This paper develops spatial model of Ecological Economic Harmony (EEH). The EEH is developed to reflect the coordination degree of the EPV and GDP. The results show: 1) The overall amount of EPV in Gansu Province are 2 430.84 billion and 2 487.40 billion in 2000 and 2010 respectively. 2) The forest ecosystem offers the most of EPV. About half of the total EPV in Gansu Province is contributed by Longnan and Gannan. 3) The spatial distribution of EPV in Gansu Province exhibits a declining trend from southeast to northwest, and the EPV in the Hexi Corridor and Longnan area increased rapidly from 2000 to 2010. 4) The ratios of the EPV to GDP in most of cities decreased in different degrees, which shows unmatching of the development of the EPV and the growth of GDP and the tremendous pressure of protection of ecological environment. 5) The present pattern of the coordination of ecological and economic systems expresses that the potential crisis zone occupies the central location and has a broad coverage, followed by low-grade conflict zone and initial degradation zone. There are some uncertainties for evaluating EPV based on quantitative remote sensing retrieval and economic evaluation methods. The uncertainties are mainly from two aspects: the EPV and the criteria for evaluation, and the spatial resolution of remote sensing data and the precision of applied ecological model.
生态系统生产总值与区域经济耦合协调机制及协同发展——以大连市为例
[J].
Coupling coordination mechanism and spatial-temporal relationship between gross ecosystem product and regional economy: A case study of Dalian
[J].DOI:10.2307/142170 URL [本文引用: 1]
洞庭湖区土地生态系统的服务价值时空变化
[J].
DOI:10.11821/dlyj020170999
[本文引用: 1]
采用5期遥感影像数据,在ArcGIS等软件支撑下,运用当量因子法、空间自相关分析法,估算洞庭湖区土地生态系统服务价值,探究其时空变化。结果表明:① 1995—2015年洞庭湖区林地面积持续减少,未利用地面积稳步增加,林地与未利用地面积的增减主导着区域土地利用变化。② 1995—2015年洞庭湖区土地生态系统服务总价值经历1995—2000年的陡增后不断下降,近20年来累计减少21.64亿元,减少幅度为1.06%,林地面积减少是洞庭湖区土地生态系统服务总价值减少的根本原因。③ 从土地生态系统服务价值结构变化来看,1995—2015年洞庭湖区除废物处理价值有小幅增加外,其他各项生态服务价值均有不同程度的下降,但生态环境保育始终是洞庭湖区土地生态系统的主要功能。④ 1995—2015年洞庭湖区土地生态系统服务价值分布的空间自相关性较为显著,格局变化较明显,高值区、低值区趋于集中,高-高类型区在西部的沅江流域常德段有所减少,向东部的汨罗江流域快速扩展,低-低类型区集中在北部、南部、西部的城镇相对密集区并沿城镇发展轴逐步扩张凝结成带片状。
Spatial and temporal changes of land ecosystem service value in Dongting Lake area in 1995—2015
[J].
