

0 引言
传统的城镇化时空格局演变分析主要基于统计类数据,该类数据可以从省、市和县等空间尺度评价各地区城镇化演变进程,但无法从像元等更精细尺度刻画城镇化的进程[7]。随着空间信息技术的发展,利用遥感数据提取的城市不透水表面数据被广泛应用在城镇化的研究中[8],该类数据可以从像元尺度上刻画城镇化的进程,但对城市区域的定义仅依靠地表覆盖中的不透水表面数据,已有研究表明该类数据无法真实反映城市实际功能和活力水平[9]。夜间灯光数据已被证明与人类活动和社会经济发展密切相关,可以从格网单元尺度上反映人类活动的剧烈程度[10-11]。目前已有诸多学者采用DMSP/OLS(defense meteorological satelite program/operational linescan system)和NPP/VIIRS(national polar-orbiting partnership’s/visible infrared imaging radiometer suite)等夜间灯光数据对城市发展[12]、区域能源消耗[13]、人口密度[14]等进行了分析。考虑到DMSP/OLS数据(1992—2013年)和NPP/VIIRS数据(2012年至今)时空尺度的不一致性,也有学者基于多种模型对2种数据进行整合,将其应用到长时间序列的城镇化研究中。Zhang等[15]利用指数模型构建了1995—2015年中国21个城市群的夜间灯光遥感数据,认为西部和北部的城市扩张速率低于东部和南部; 许正森等[5]利用对数模型整合了长三角城市群的DMSP/OLS和NPP/VIIRS数据,认为该城市群重心稳定在太湖沿岸附近,城市群分布的方向性减弱。
基于此,本文通过二次多项式以及过饱和校正等多种方法对DMSP/OLS和NPP/VIIRS数据进行一致性校正,构建2000—2019年黄土高原长时间序列的稳定夜间灯光遥感数据集,计算黄土高原不同空间尺度的综合夜间灯光指数(compound night light index,CNLI),同时利用统计数据构建的城镇化综合发展水平指数(urbanization development index,UDI)对其进行验证。在此基础上,利用二分模型提取黄土高原城市建成区面积,分析其空间格局演变,以期为该地区城市群管理、规划及黄河流域生态保护和高质量发展提供参考。
1 研究区及其数据源
1.1 研究区概况
图1
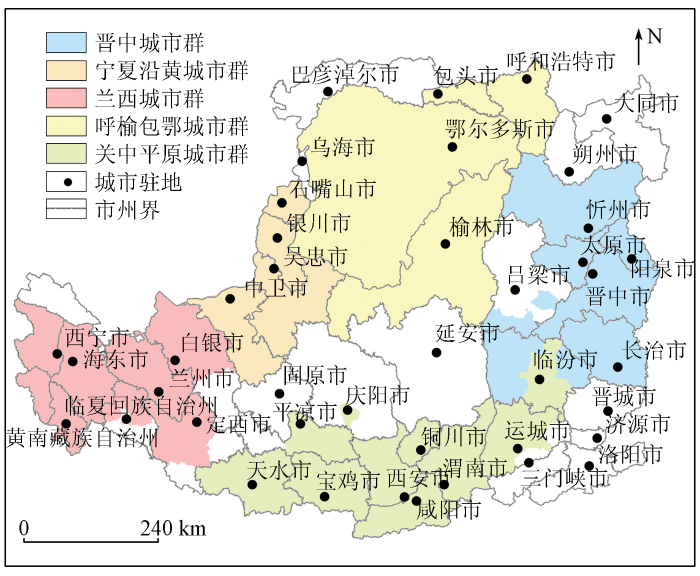
图1
黄土高原地市及城市群范围示意图
Fig.1
Geographical location of cities and urban agglomerations in the Loess Plateau
1.2 数据来源
1)夜间灯光数据。1992—2013年的DMSP/OLS稳定夜间灯光年值数据产品和2012—2019年的NPP/VIIRS平均月值灯光辐射数据产品皆来源于美国国家海洋和大气管理局的国家地球物理数据中心(https://www.ngdc.noaa.gov/ngdc.html),前者的空间分辨率约为1 km×1 km,辐射分辨率为6 bit,像元值是指未经过星上辐射定标的相对亮度值,代表夜间灯光强度,该数据消除了闪电和渔船灯光等短暂灯光的影响,但其不同序列影像数据之间不具有可比性; 后者空间分辨率为500 m×500 m,辐射分辨率为12 bit,像元值是经过辐射定标后的绝对亮度值,其不同时段的影像数据间具有可比性,但该数据未消除火光、渔船灯光等短暂灯光的影响[11,21 -22]。
表1 黄土高原UDI体系
Tab.1
| 准则层 | 权重 | 指标层 | 单位 | 属性 | 权重 |
|---|---|---|---|---|---|
| 人口城镇化 | 0.172 | 城镇人口占比 | % | + | 0.043 |
| 人口密度 | 人/km2 | + | 0.098 | ||
| 非农就业人员占比 | % | + | 0.031 | ||
| 经济城镇化 | 0.268 | 非农产业产值占比 | % | + | 0.084 |
| 人均公共预算收入 | 万元 | + | 0.104 | ||
| 人均GDP | 元/人 | + | 0.080 | ||
| 空间城镇化 | 0.258 | 建成区面积 | km2 | + | 0.042 |
| 人均绿地面积 | m2/人 | + | 0.118 | ||
| 人均道路面积 | m2/人 | + | 0.098 | ||
| 社会城镇化 | 0.302 | 每万人医疗卫生床位数 | 张/万人 | + | 0.114 |
| 人均商品销售总额 | 元/人 | + | 0.134 | ||
| 每万人高校学生数量 | 人/万人 | + | 0.054 |
1.3 数据预处理
表2 2013年黄土高原DMSP/OLS和NPP/VIIRS数据拟合结果
Tab.2
| 函数类型 | 模型表达式 | R2 |
|---|---|---|
| 线性函数 | y=0.121 1x-1.193 4 | 0.709 5 |
| 指数函数 | y=0.213 2 | 0.756 9 |
| 对数函数 | y=2.372 3lnx-5.480 7 | 0.441 1 |
| 二次多项式 | y=0.001 9x2-0.018 2x+0.410 7 | 0.853 6 |
式中: a和b分别为二次多项式的回归系数; c为常数项; DNcal和DN分别为校正后和校正前的DMSP/OLS影像的DN值。③年内融合和校正,由于部分年份存在多个传感器并存现象,对不同传感器的影像进行平均值合成。④年际校正,经过饱和校正和年内融合后,不同年份之间仍存在像元不可比问题,故采用年际校正函数进行校正,即
式中DN(i-1,j),DN(i,j)和DN(i+1,j)分别为第i-1,i和i+1年影像中的第j个像元值。同时,为保持影像原来的值域,将DN值大于63的像元都赋值为63。⑤异常值校正,以0.3为阈值去除NPP/VIIRS数据中的微小灯光[26],同时以每期影像中西安市城区影像最大DN值为阈值,过滤掉偶然出现的异常极大值[9]。⑥DMSP/OLS和NPP/VIIRS联合校正,对2013年DMSP/OLS和NPP/VIIRS这2种数据之间的关系进行模拟(表2),选取最优的拟合函数二次多项式模型对2014—2019年的NPP/VIIRS数据进行校正,进而实现2种数据的一致性和可比性。⑦年际间再校正,由于校正后不同年份之间像元存在不连续的现象,进行年际间再校正,从而得到2000—2019年黄土高原长时间序列经过校正的夜间灯光数据集。
2 研究方法
2.1 CNLI计算
CNLI指某一地区灯光面积占比(light area percentage,LAP)与平均灯光强度(mean light index,MLI)的乘积。该指数可以反映社会发展进程和人类活动的剧烈程度,其具体计算公式为[27]:
式中: Arealight和Area分别为灯光区域面积和研究区域的总面积; DNh为第h个灰度级所对应的像元值; Nh为灰度级为h的像元数量。
2.2 UDI计算
式中: UDIi为黄土高原第i年的城镇化发展指数;
2.3 建成区提取和精度评价
式中Areastatistics为统计年鉴数据提取的城市建成区面积。
2.4 城镇空间扩张强度
式中: UI为城镇空间扩张强度; UAi和UAj+i分别为第i和j+i年城市建成区的面积; T为研究时间跨度。
2.5 标准差椭圆
式中: xm和ym分别为第m个要素的位置坐标;
式中:
式中:
2.6 相关分析
利用Pearson相关系数计算2000—2019年黄土高原UDI与CNLI的相关性,计算公式为[30]:
式中: r为相关系数; xl和yl分别为2000—2019年UDI和CNLI的值,
3 结果与分析
3.1 相关性分析
图2显示了2000—2019年黄土高原CNLI与UDI的相关系数。整体来看,二者相关性较高,其值高达0.887 3(p<0.01); 从黄土高原CNLI与人口、经济、空间和社会城镇化的相关系数来看,其相关系数的值均在0.80以上,分别达到0.840 7,0.852 6,0.879 6和0.836 2。以上结果表明本文构建的CNLI可以较好反映黄土高原城镇化水平,可以用于后续分析。
图2
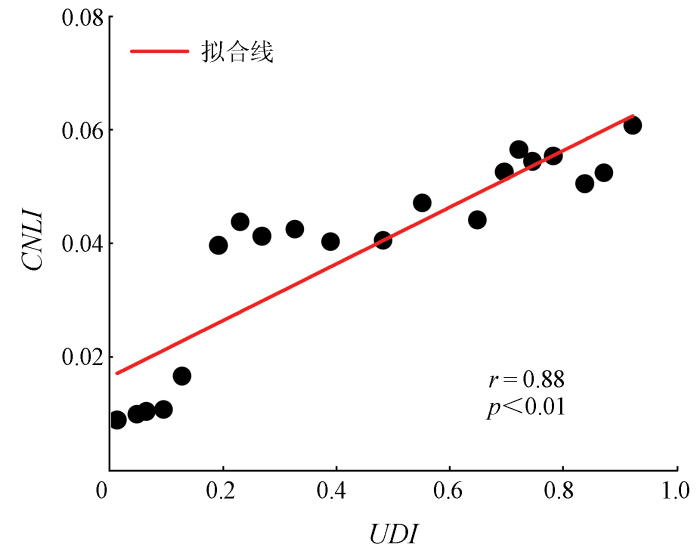
图2
2000—2019年黄土高原UDI与CNLI散点图
Fig.2
Scatter plot between UDI and CNLI in the Loess Plateau from 2000 to 2019
3.2 CNLI时空演变趋势
图3
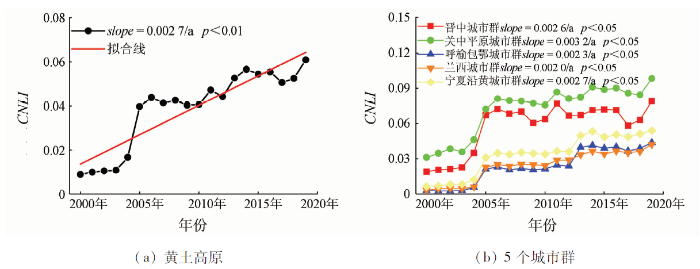
图3
2000—2019年黄土高原及5个城市群CNLI值变化
Fig.3
Changes of the CNLI in Loess Plateau and five urban agglomerations from 2000 to 2019
图4显示了2000—2019年黄土高原夜间灯光强度和CNLI值的空间分布。总体来看,黄土高原夜间灯光强度呈现从东南向西北减小的趋势。2000年夜间灯光强度高值区(DN>20)主要位于黄土高原东南部的太原和西安等地(图4(a)); 到2010年,夜间灯光强度高值区开始向西北方向的呼和浩特、大同和银川等地扩张(图4(b)); 到2019年,夜间灯光强度高值区在黄土高原东南部及省会(首府)城市附近持续扩展,中部地区的夜间灯光强度高值区也有了实质性提升(图4(c))。从城市尺度来看,黄土高原CNLI值呈现从东南向西北递减的趋势,高值区主要分布在省会城市及其附近区域。2000年,除东南部的太原和西安等少数城市的CNLI值高于0.04外,其他城市均小于0.02,表明黄土高原城镇化发展水平较低(图4(d)); 到2010年,东南部的西安、洛阳和太原、北部的包头和呼和浩特以及西北部的银川等地的CNLI值快速上升,其值均超过了0.08,西安、洛阳和太原和包头的CNLI值甚至超过了0.10,逐步形成了以西安为中心的关中平原城市群、以太原为中心的晋中城市群、以呼和浩特和包头为中心的呼榆包鄂城市群以及以银川为中心的宁夏沿黄城市群(图4(e)); 到2019年,CNLI值大于0.10的城市在西安及其附近城市连片出现,西部的兰州和西宁的CNLI值也超过0.06(图4(f))。
图4
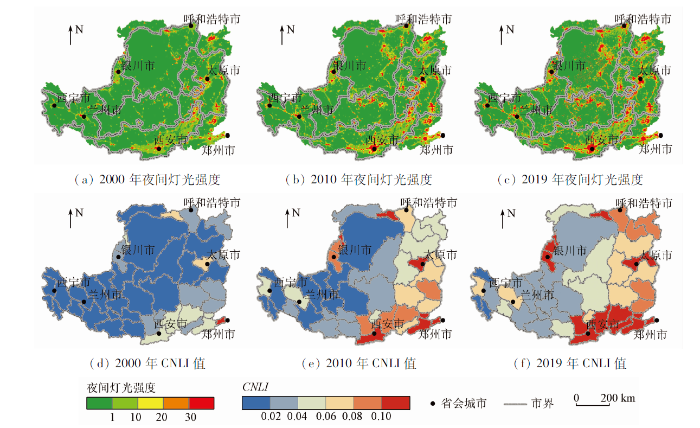
图4
2000—2019年黄土高原夜间灯光指数DN值及其CNLI的空间分布
Fig.4
Spatial pattern and change of lighting image and CNLI in the Loess Plateau from 2000 to 2019
3.3 黄土高原城市建成区提取结果
为进一步分析黄土高原城镇空间格局演变,本文提取了2000—2019年黄土高原40个地级市城市建成区面积,并进一步计算了其绝对误差和相对误差(图5)。从图5中可以看出,所有城市建成区提取的绝对误差均值为2.45 km2,其中29座城市的绝对误差低于3 km2; 从相对误差来看,所有城市建成区提取的相对误差均值为3.72%,其中有35座城市的相对误差低于10%。总体来看,基于二分模型提取的建成区面积与统计的面积较为接近,但由于夜间灯光遥感数据饱和校正和背景噪声去除存在一定误差会使城市建成区内的DN值变化相对较小,城市建成区像元与城市绿地、水体等非建成区像元区分效果较差,因此西安和银川等城市的建成区提取面积绝对误差偏大[5]。
图5
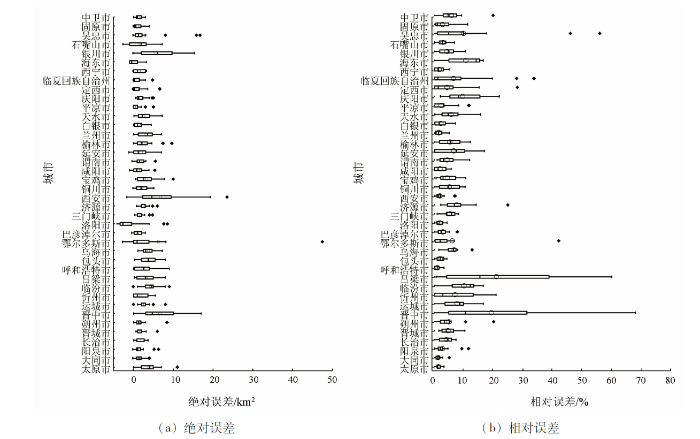
图5
2000—2019年黄土高原各城市建成区提取的绝对误差和相对误差
Fig.5
Absolute error and relative error for built-up areas extraction in the Loess Plateau from 2000 to 2019
3.4 城镇空间格局分析
3.4.1 城镇空间扩展强度
图6
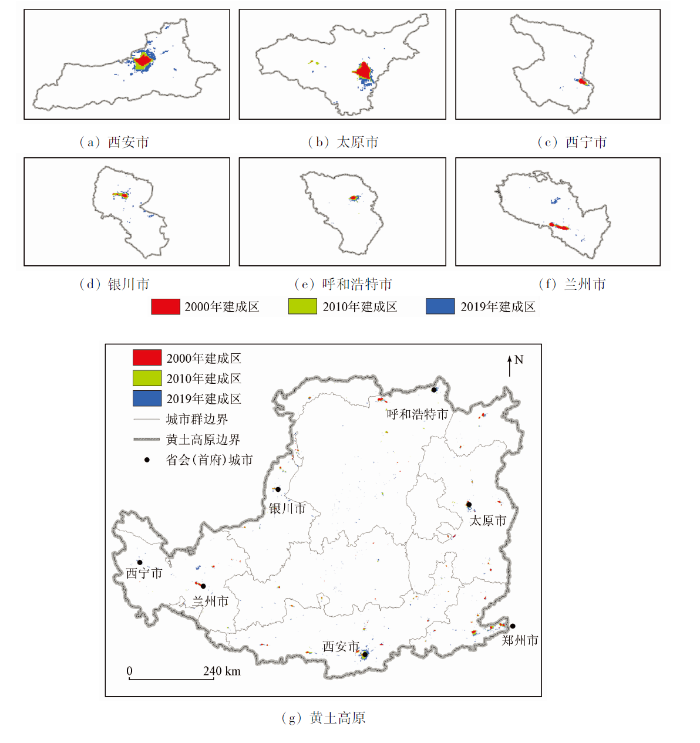
图6
2000—2019年黄土高原及省会(首府)城市城镇建成区空间扩张态势
Fig.6
Urban expansion of the Loess Plateau and six provincial capitals from 2000 to 2019
表3 不同阶段整个黄土高原和5个城市群及省会(首府)建成区扩展强度值
Tab.3
| 区域 | 2000—2010年 | 2010—2019年 | 2000—2019年 |
|---|---|---|---|
| 黄土高原 | 6.27 | 4.69 | 7.42 |
| 关中平原城市群 | 7.02 | 5.84 | 9.03 |
| 晋中城市群 | 3.33 | 4.07 | 4.61 |
| 呼榆包鄂城市群 | 8.01 | 3.33 | 7.53 |
| 宁夏沿黄城市群 | 13.81 | 3.30 | 11.76 |
| 兰西城市群 | 2.47 | 4.98 | 4.52 |
| 西安 | 7.74 | 10.54 | 14.02 |
| 太原 | 3.71 | 3.65 | 4.61 |
| 呼和浩特 | 9.42 | 5.44 | 10.71 |
| 银川 | 13.27 | 6.59 | 15.40 |
| 兰州 | 2.77 | 6.24 | 5.60 |
| 西宁 | 1.34 | 4.00 | 3.03 |
从不同的城市群来看,2000—2019年宁夏沿黄城市群和关中平原城市群的城镇空间扩展强度值较高,分别为11.76%和9.03%,兰西城市群和晋中城市群的值较低,仅为4.52%和4.61%; 分阶段来看,2000—2010年关中平原城市群、呼榆包鄂城市群和宁夏沿黄城市群的城镇空间扩展强度明显高于2010—2019年,晋中城市群和兰西城市群呈相反的态势(表3)。从省会(首府)城市来看,2000—2019年银川和西安的城镇扩张强度值较大,分别达到15.40%和14.02%,西宁的城镇扩张强度值最低,仅为3.03%; 分阶段来看,2010—2019年西安、兰州和西宁的城镇扩张强度的值高于2000—2010年,而银川和呼和浩特呈现相反的态势(图6和表3)。
3.4.2 建成区空间演变趋势
图7显示了2000—2019年黄土高原城市建成区扩张的标准差椭圆及重心的移动轨迹。从图7中可以看出,黄土高原建成区标准差椭圆大致呈东—西走向,其重心在2000—2019年期间呈现向东南方向移动的趋势,由2000年的(109°26'16″E,36°57'1″N)移动至2019年的(109°36'57″E,36°38'6″N),表明该地区东南部的建成区扩张强度领先于西北部(图7(a)—(b))。从标准差椭圆的覆盖面积来看,其值由2000年的4.62×1
图7
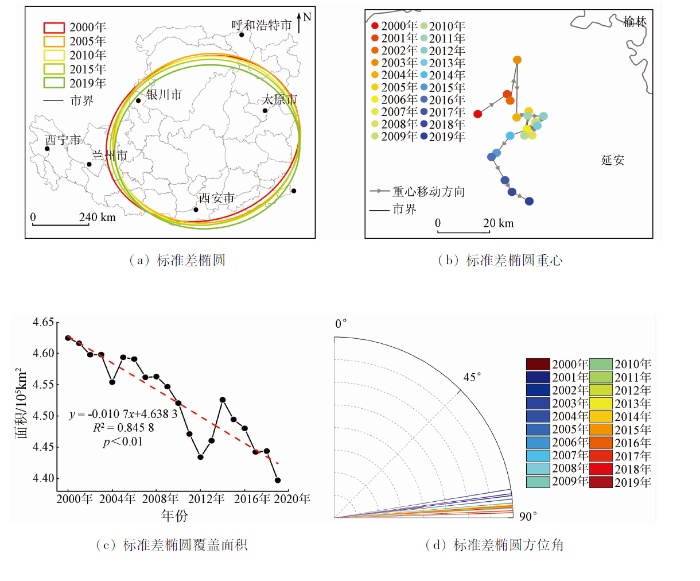
图7
2000—2019年黄土高原建成区面积标准差椭圆重心、覆盖面积及方位角变化趋势
Fig.7
Spatio-temporal dynamics of standard deviation ellipse elements, centroid migration route, areal change trend and azimuth change from 2000 to 2019
4 讨论
作为落实黄河流域高质量发展的主体区域,黄土高原城镇化建设一方面会改变地表下垫面性质,引发区域植被破坏等生态环境问题,另一方面则会促进社会经济的发展,累计诸多资金和技术等用于生态的治理和修复,提高区域的生态承载力[28]。相比于遥感影像提取的城市不透水表面数据,夜间灯光遥感数据与人类活动和社会经济密切相关,可以更加准确反映城市区域的人类活动[5,19]。目前,已有诸多学者利用DMSP/OLS或NPP/VIIRS夜间灯光数据对我国省、市、县等多个空间尺度的城镇化水平进行了评估,认为灯光强度与城镇化水平具有较好的相关性[32-33]。在构建的2000—2019年黄土高原长时间序列的夜间灯光遥感数据的基础上,本文进一步分析了CNLI的时空演变及城市建成区的时空格局,相比与以往的研究,本文采用统计数据进一步验证了CNLI在黄土高原的适用性,陈晋等[27]认为基于夜间灯光指数构建的CNLI同复合城镇化指标具有显著相关性。本文从黄土高原整体、城市群及城市等不同尺度分析了其时空演变,研究结果可为长时间序列的城镇化研究提供数据和方法支撑。宋永永等[16]构建了1992—2015年黄土高原夜间灯光数据,认为黄土高原城镇化空间扩展显著,但该研究并未从多空间尺度分析其城镇化时空演变; 周亮等[17]认为1980—2019年期间黄土高原城镇扩张迅速,但该研究仅基于遥感提取的建设用地面积。本文的研究结果表明黄土高原CNLI值呈现从东南向西北递减的趋势,表明黄土高原城镇化水平空间分布不均,整体呈现东南高、西北低的规律,基本符合黄土高原城镇化水平的实际情况。主要原因是由于东南部的关中平原城市群是该区域唯一的区域级城市群,其人口密度和城镇密度都是5个城市群中最大的,城镇化发展水平最高[20],研究结果同Song等[7]的研究结果类似。从建成区的时空演变格局来看,城镇扩张强度呈明显的阶段性,2010—2019年期间的扩张强度小于2000—2010年,在呼榆包鄂城市群和宁夏沿黄城市群尤为突出,主要是由于资源的推动、政策引导以及行政区划的调整等[7,34],研究结果同史海金等[35]的研究结果类似。此外,城镇扩展强度也会受到地形、交通和社会经济等其他因素的影响。李俊峰等[33]认为兰州市的城镇扩张强度受到河谷地形的限制; 季顺伟等[36]认为城镇扩张强度受公共财政支出和固定资产投入等社会经济的影响。从建成区扩张方向来看,黄土高原建成区整体呈现向东南方向集中扩张的态势,主要是由于西安、太原等黄土高原核心城市建成区扩张对标准差椭圆重心的拉动作用,建成区空间集聚性趋于增强,这与赵雪雁等[24]得出的结论一致。
值得注意的是采用夜间灯光遥感数据对城镇化水平进行估算也存在一定的限制和不足。首先,相同城镇化水平的区域由于地理位置、生活方式等不同会导致夜间灯光亮度不同,同时常用的夜间灯光遥感数据(DMSP/OLS和NPP/VIIRS)存在辐射饱和、背景噪声、云层遮蔽以及月光污染等问题,这些问题均会对CNLI计算的准确性带来一定影响[11,22]; 其次,对建成区提取结果的精度评价主要依据统计年鉴数据,统计年鉴数据主观性及相关年份的缺失会对结果的准确性造成一定的影响[29]。虽然夜间灯光遥感数据衡量城镇化水平并非完全准确,但借助该数据可以克服人为干扰对城镇化发展水平评价的影响,为分析城镇化发展提供了新的研究视角[10,21]。
5 结论
利用DMSP/OLS和NPP/VIIRS数据,本文构建了2000—2019年黄土高原夜间灯光遥感数据集,分析了黄土高原CNLI以及建成区扩张的时空演变格局,可以得出以下结论:
1)基于夜间灯光遥感数据构建的黄土高原CNLI与统计数据构建的UDI及人口城镇化、经济城镇化、空间城镇化和社会城镇化的相关系数均高于0.80,表明本文所构建的CNLI可以较好反映黄土高原的城镇化水平。
2)2000—2019年整个黄土高原及5个城市群的CNLI值均呈显著上升的趋势,关中平原城市群的增速最大,兰西城市群的增速最小; 空间上,黄土高原CNLI值呈现从东南向西北递减的趋势。
3)黄土高原建成区提取的绝对误差和相对误差的均值分别为2.45 km2和3.72%,其中29座城市建成区提取结果的绝对误差低于3 km2; 35座城市建成区提取结果的相对误差低于10%。表明该方法提取的建成区精度较高。
4)黄土高原建成区大致呈东—西走向,其标准差椭圆重心在2000—2019年期间呈现向东南方向移动的趋势; 标准差椭圆覆盖面积表现为显著下降的趋势,方位角的值由北偏东83.33°变化为88.37°。
参考文献
新型城镇化前置条件与驱动机制的重新认知
[J].
DOI:10.11821/dlyj020180444
[本文引用: 1]

本文发现:近年来城市比乡村好的城镇化前提开始出现新变化,以前农村-城市单向的城镇化过程,可能会出现城乡之间的反向或双向的过程。城镇化的主要驱动力逐渐从工业部门拓展到整个非农产业,改变了城镇规模越大越好的组织模式;市场在信息化条件下的“流”空间中开始出现分散化布局的组织模式,改变了传统空间的规模-等级结构;产业之间相互融合的新趋势将改变传统单一用地功能的设置,而更强调功能和空间的复合应对;城市发展由经济利益主导向综合效益转变,城市等级的高低取决于自身的吸引力以及在此基础上所形成的功能。建议未来完善城镇化模式、路径、规划、调控的理论方法,注重城乡特色、推进城乡等值化、实现城乡要素交流融合。
Re-recognition of precondition and driving mechanism of new-type urbanization
[J].
DOI:10.11821/dlyj020180444
[本文引用: 1]
This paper analyzes the precondition of urbanization, and concludes that the premise that urban area is better than rural area began to change. The result may be the one-way urbanization process from rural to urban area changes into a reverse or two-way process between rural and urban areas. This paper discusses the driving force and evolving mechanism of the new-type urbanization, and believes that the main driving force of urbanization came from the economies of scale under industrialized production in the early period, which gradually expands from industrial sectors to non-agricultural industries, and changes the organization pattern that the bigger the size is, the better the town is. The paper believes that the organization model of the market in "flow" space under the information condition presents the trend of decentralized layout, which will change the scale-hierarchy structure of traditional space. The paper concludes that the new trend of the mutual integration between industries will change the setting of traditional single-use functions, while emphasizing the complex response of function and space. The paper does not believe that the changes in preconditions and driving mechanisms for urbanization means that urbanization is an inevitable process, and that the higher the level of urbanization, the better, and the larger the city size, the better. The paper finds that the goal of urban development has shifted from economic benefits to comprehensive benefits. The paper concludes that the city level depends on its own attraction and the function based on it, instead of size. The paper does not believe that the residents who are engaged in non-agricultural industries and enjoy non-agricultural lifestyle in new type of rural areas be counted as farmers, but as "semi-urbanization" population. The paper believes that the socio-economic patterns are very complex and highly integrated with each other, so it is difficult to rationally distinguish the connotations of cities or villages from the simple definition of urbanization. The paper proposes that in the semi-urbanized areas, local resources should be used as an advantage, and the main employment forms, public service and infrastructure conditions, lifestyle, and community culture should be promoted in close proximity to the urbanization area. The paper believes that in the future, it is necessary to revise and improve the theory and method of urbanization mode, path, planning and regulation, pay attention to urban and rural characteristics, promote urban and rural equivalent development, and realize the integration of urban and rural factors.
Quantifying urbanization levels on the Tibetan Plateau with high-resolution nighttime light data
[J].DOI:10.1016/j.geosus.2020.08.004 URL [本文引用: 1]
Coupling and coordinated development of new urbanization and agro-ecological environment in China
[J].DOI:10.1016/j.scitotenv.2021.145837 URL [本文引用: 1]
Beyond city expansion:Multi-scale environmental impacts of urban megaregion formation in China
[J].
整合DMSP/OLS和NPP/VIIRS夜间灯光遥感数据的长江三角洲城市格局时空演化研究
[J].
DOI:10.12082/dqxxkx.2021.200380
[本文引用: 7]
本文基于1992—2012年DMSP/OLS和2012—2018年NPP/VIIRS夜间灯光遥感数据,对长江三角洲城市群时空演化格局进行监测。考虑到不同卫星夜间灯光遥感数据之间的不一致性以及城市核心区亮度过饱和问题,对DMSP/OLS和NPP/VIIRS数据进行连续性校正、去饱和处理和一致性校正,构建长江三角洲区域1992—2018年长时间序列多源夜间灯光遥感数据集。利用二分法基于该数据逐年提取长江三角洲城市群各城市建成区空间分布,计算加权标准差椭圆和Zipf系数进行重心变化和方向性分布变化、规模体系变化等监测。结果表明: ① 本研究采用的连续性校正、去饱和处理和一致性校正方法能够构建稳定的长时间序列多源夜间灯光遥感数据集; ② 基于二分法提取的建成区面积平均绝对误差为6.85 km<sup>2</sup>,平均相对误差为8.10%; ③ 长三角城市群重心较为稳定,始终在苏州市境内的太湖沿岸附近,呈现出向东南方向移动的趋势城市群呈西北—东南方向分布,且分布方向有向南北方向转动的趋势,标准差椭圆的扁率持续减小,表明城市群的方向性分布减弱; ④ Zipf系数始终在1附近且呈缓慢降低的趋势,城市规模分布较为均衡。
Study on the spatio-temporal evolution of the Yangtze River Delta urban agglomeration by integrating DMSP/OLS and NPP/VIIRS nighttime light data
[J].
中国城市群空间结构研究进展
[J].
Review and prospect of research on spatial structure of China’s urban agglomerations
[J].
Spatial-temporal pattern and formation mechanism of county urbanization on the Chinese Loess Plateau
[J].DOI:10.1007/s11629-020-6282-1 [本文引用: 3]
京津冀地区不透水表面覆盖率的时空演变及其对植被的影响
[J].
DOI:10.11821/dlyj020200509
[本文引用: 1]
基于不透水表面和MODIS增强型植被指数(EVI)数据,辅以分段线性回归、趋势分析等方法,定量分析2000—2018年京津冀不透水表面覆盖率(ISP)的时空演变及其对植被的影响。结果表明:① 京津冀ISP呈显著增加的趋势,增速为0.024%/a(P<0.01)。分阶段来看,2000—2010年和2011—2018年ISP均呈显著增加趋势,增速分别为0.019%/a(P<0.01)和0.037%/a(P<0.01),后一阶段的增速快于前一阶段;② 空间上,ISP快速增加的区域主要位于城市和近郊,缓慢增加和增加的区域主要位于主城区和农村;③ 从不同ISP区域ΔEVI的时间变化趋势来看,城区、近郊和远郊的ΔEVI均呈显著下降趋势(P<0.05)的地市分别有6个、6个和3个。主城区的ΔEVI呈显著增加趋势的地市有3个(P<0.05)。从EVI的空间变化趋势来看,显著增加的区域主要位于北京、天津等市的主城区,显著减少的区域主要位于北京、天津、石家庄等地市的近郊和远郊;④ 从EVI随ISP的空间变化趋势看,所有地市EVI随ISP的增加均呈显著减小的趋势(P<0.01)。减小趋势最大和最小的地市分别为秦皇岛和张家口,其下降速率为-0.0081/a和-0.0043/a。从时间变化来看,京津冀的EVI与ISP呈显著负相关,其相关系数为-0.4912。研究结果可为中国城市快速扩张过程中的植被变化提供理论参考和科学实践。
Spatiotemporal evolution of impervious surface percentage and its impact on vegetation in Beijing-Tianjin-Hebei region
[J].
DOI:10.11821/dlyj020200509
[本文引用: 1]
Exploring the urbanization effects on vegetation is crucial for the urban ecological management and green space planning. Moderate Resolution Imaging Spectroradiometer Enhanced Vegetation Index (MODIS-EVI) and impervious surface data from 2000 to 2018 were utilized to assess the spatiotemporal impervious surface percentage (ISP) and its impact on vegetation by the piecewise regression model, trend analysis, and correlation analysis. Results indicated that (1) During the whole period, the ISP significantly increased (P<0.01), with the linear tendency being 0.024%/a. There existed two distinct periods with different increasing trends, with the linear tendency being 0.0019/a (P<0.01) and 0.0037/a (P<0.01) in terms of 2000-2010 and 2011-2018, respectively. The ISP from 2011 to 2018 increased faster than that from 2000 to 2010. (2) Rapid increases in the ISP were mainly distributed in the urban (0.5<ISP≤0.75) and suburban (0.25<ISP≤0.5) areas. Slow increases in the ISP were mainly distributed in the urban core (0.75<ISP≤1) and rural areas (0<ISP≤0.05). (3) From the perspective of change trends of rural EVI and the ΔEVI in urban areas, the areas with significant decreased ISP were mainly distributed in the urban, suburban, and exurban areas. The ΔEVI decreased significantly in urban, suburban and exurban areas for 6 of 13 cities, 6 of 13 cities and 3 of 13 cities, respectively (P<0.05). By contrast, the areas with increased ISP were mainly distributed in the urban core, and increased significantly for cities of Beijing, Tianjin and Baoding (P<0.05). The stable or even significant increase trend of ΔEVI in the urban core (0.75<ISP≤1) in most cities in Beijing-Tianjin-Hebei region could primarily be attributed to the positive effects derived from the urban ecological environment, and improvement of the preservation and construction of the urban green space. In terms of spatial variation, EVI increased significantly in the urban cores of Beijing and Tianjin, and decreased significantly in the suburban and exurban areas of Beijing, Tianjin and Shijiazhuang. (4) As for spatial trends, the annual maximum EVI from 2000 to 2018 decreased significantly (P<0.05) with elevating ISP for all the cities in the Beijing-Tianjin-Hebei region. The highest decaying rate was observed in Qinhuangdao (-0.0081/a), while the lowest decaying rate was found in Zhangjiakou (-0.0043/a). From the view of temporal variation, significant negative correlation between ISP and EVI was found in the study region and the correlation coefficient was -0.4912. The results can provide scientific and theoretical basis for research on vegetation change in the process of rapid urban expansion in China.
基于DMSP-OLS与NPP-VIIRS整合数据的中国三大城市群城市空间扩展时空格局
[J].
DOI:10.12082/dqxxkx.2020.190711
[本文引用: 4]
通过拟合最优幂函数模型,将NPP-VIIRS影像模拟为DMSP-OLS影像,构建了京津冀、长江三角洲(简称长三角)和珠江三角洲(简称珠三角)三大城市群1992—2017年长时间序列夜间灯光影像集。参考城市建成区统计数据确定夜间灯光最佳阈值提取城市范围,有效剥离统计数据中包含的经济活力不足的城市空间,识别出不属于统计范围的低等级、高活力城镇区,创新了数据应用视角。研究表明:① 县级城镇和市级以上城市对三大城市群城市范围的贡献度不同。京津冀腹地广阔,县级城镇是区域经济活力的重要组成部分,整体上贡献度最大;1990s初期长三角部分县级城镇经济活力较强,大量撤县设市后县级城镇数量减少,逐渐在2005年后低于京津冀;珠三角受到社会经济发展条件和行政单元划分的影响,县级城镇对城市范围的贡献在3个城市群中始终最小。② 三大城市群城市扩展非均衡性特征存在差异。京津冀城市扩展为京、津主导下的“双核”模式,非均衡性显著,尚未形成完善的城市规模体系;长三角和珠三角城市集聚特征明显,均衡性更强。重心迁移的路径、方向和距离反映各城市群不同的扩展强度和作用模式。③ 城市空间扩展格局整体均呈现热点区不断扩大、冷点区不断缩小的特征。其中京津冀热点和冷点区相对稳定,热点区向心集聚作用较强;长三角和珠三角空间格局变化较大,区域核心城市带动作用较强。
Study on urban spatiotemporal expansion pattern of three first-class urban agglomerations in China derived from integrated DMSP-OLS and NPP-VIIRS nighttime light data
[J].
夜间灯光遥感数据应用综述和展望
[J].
DOI:10.18306/dlkxjz.2019.02.005
[本文引用: 2]
在遥感应用研究中,夜间灯光遥感作为发展活跃的一个重要分支,近年来受到越来越多来自自然科学领域和社会经济领域的关注。与传统的光学遥感卫星获取地物辐射信息不同,夜间灯光遥感是获取夜间无云条件下地表发射的可见光-近红外电磁波信息。相比于普通的遥感卫星影像,夜间灯光遥感所使用的夜间灯光影像记录的地表灯光强度信息更直接反映人类活动差异,因而被广泛应用于城市化进程研究、不透水面提取、社会经济指标空间化估算、重大事件评估、生态环境评估等领域。目前,虽然基于夜间灯光数据的应用研究成果正在不断积累,但对成果的系统性总结、整理的研究目前存在着覆盖面不全、时效性不强等不足。基于此,论文通过对近几十年来有关夜间灯光数据的研究成果的详细梳理,从数据处理与技术方法、应用研究等方面进行归纳总结。最后,文章从多源数据融合、应用领域拓展和短周期地表灯光监测3个方面指出了未来的研究热点。
Review and prospect of application of nighttime light remote sensing data
[J].
夜间灯光遥感与城市问题研究: 数据、方法、应用和展望
[J].
Nighttime light remote sensing and urban studies: Data,methods,applications,and prospects
[J].DOI:10.11834/jrs.20211018 URL [本文引用: 3]
Study on urban spatial pattern based on DMSP/OLS and NPP/VIIRS in Democratic People’s Republic of Korea
[J].
DOI:10.3390/rs13234879
URL
[本文引用: 1]
In recent years, much attention has been given to the current situation and trend regarding economic development in the Democratic People’s Republic of Korea (DPRK), of which urbanization is an important indicator. In the present study, (i) the urbanized area is estimated using DMSP/OLS and NPP/VIIRS, (ii) the current spatial pattern and the change characteristics of typical cities are revealed, and (iii) the scale and developmental stage of major cities in the DPRK are judged through comparison. Although the DPRK is relatively closed, the financial crisis in 2008 indirectly affected its economic development, and a large gap remains between the urbanization level of the DPRK and that of China and the Republic of Korea. The large cities in the DPRK are located mainly in its eastern coastal areas and western plains, and there has been no significant expansion in Pyongyang, Chungjin, and Hamhung in the past 28 years. Although economic construction has begun again recently in the DPRK, further reform and opening are required. As the DPRK’s relations with its neighbors and countries around the world improve, its economic development and urban construction will present a new pattern.
黄河流域能源消费碳排放时空格局演变及影响因素——基于DMSP/OLS与NPP/VIIRS夜间灯光数据
[J].
DOI:10.11821/dlyj020200646
[本文引用: 1]
科学估算并动态监测长时间序列区域能源消费碳排放发展态势,是制定、实施及评估地区碳减排策略的科学依据和基础保障。基于构建的长时间序列可相互比较的DMSP/OLS与NPP/VIIRS两种夜间灯光数据集,本文模拟了2000—2018年黄河流域能源消费碳排放的时空变化特征,并从流域地理分异的角度对其影响因素进行解析。结果表明:① 2000—2018年黄河流域能源消费碳排放呈现总量不断上升但增长速率下降的态势,整体表现出收敛趋势,但还未达到碳峰值;流域内部碳排放总量呈中游>下游>上游的地理分异特征。② 以黄河干流及主要支流为串联的核心城市形成了若干规模不一的高密度碳排放中心。③ 黄河流域碳排放呈显著的正的全局空间自相关,并形成了以晋陕蒙资源型城市为依托的中上游碳排放高-高集聚,以及上游甘青宁地区为主的碳排放低-低集聚。④ 经济发展水平对碳排放空间分异的影响力始终最强,其次为城镇化水平与人口规模,“GDP+”能源结构、能源强度与产业结构所主导的交互作用是导致碳排放持续增长的主要推动力。从构建流域生命共同体的视角出发,结合黄河流域自然环境特点与经济社会特征,并统筹上下游、左右岸、干支流之间的关系,分区施策与分时施策并行,对实现以碳减排为目标的黄河流域生态保护与可持续发展意义重大。
Spatio-temporal evolution and influencing factors of energy-related carbon emissions in the Yellow River basin:Based on the DMSP/OLS and NPP/VIIRS nighttime light data
[J].
Mapping the population density in Mainland China using NPP/VIIRS and points-of-interest data based on a random forests model
[J].
DOI:10.3390/rs12213645
URL
[本文引用: 1]
Understanding the spatial distribution of populations at a finer spatial scale has important value for many applications, such as disaster risk rescue operations, business decision-making, and regional planning. In this study, a random forest (RF)-based population density mapping method was proposed in order to generate high-precision population density data with a 100 m × 100 m grid in mainland China in 2015 (hereafter referred to as ‘Popi’). Besides the commonly used elevation, slope, Normalized Vegetation Index (NDVI), land use/land cover, roads, and National Polar Orbiting Partnership/Visible Infrared Imaging Radiometer Suite (NPP/VIIRS), 16,101,762 records of points of interest (POIs) and 2867 county-level censuses were used in order to develop the model. Furthermore, 28,505 township-level censuses (74% of the total number of townships) were collected in order to evaluate the accuracy of the Popi product. The results showed that the utilization of multi-source data (especially the combination of POIs and NPP/VIIRS data) can effectively improve the accuracy of population mapping at a finer scale. The feature importances of the POIs and NPP/VIIRS are 0.49 and 0.14, respectively, which are higher values than those obtained for other natural factors. Compared with the Worldpop population dataset, the Popi data exhibited a higher accuracy. The number of accurately-estimated townships was 19,300 (67.7%) in the Popi product and 16,237 (56.9%) in the Worldpop product. The Root Mean Squared Error (RMSE) and Mean Absolute Error (MAE) were 14,839 and 7218, respectively, for Popi, and 18,014 and 8572, respectively, for Worldpop. The research method in this paper could provide a reference for the spatialization of other socioeconomic data (such as GDP).
Using DMSP/OLS and NPP/VIIRS images to analyze the expansion of 21 urban agglomerations in mainland China
[J].
黄土高原城镇化过程及其生态环境响应格局
[J].
Urbanization process and its eco-logical environment response pattern on the Loess Plateau,China
[J].
黄土高原人口密集区城镇扩张对生境质量的影响——以兰州、西安—咸阳及太原为例
[J].
DOI:10.13287/j.1001-9332.202101.019
[本文引用: 2]
快速城镇化过程极大改变了区域生境的空间格局和功能要素,深刻影响生境斑块之间的物质流和能量流,同时对生境和生物多样性造成严重威胁。本研究采用InVEST模型、景观指数及多元线性回归,系统分析了1990—2018年黄土高原全域及人口密集区城镇化对生境质量影响的时空格局特征与因素。结果表明: 黄土高原城镇扩张显著影响生境质量,1990—2018年间建设用地面积增幅49.6%,导致生境斑块的总面积减少5.2%。2010年后,城镇斑块面积上升,斑块密度和破碎度下降,使城镇生境质量呈现出“外高中低”的空间格局。人口密集区城镇扩张速率与生境质量呈现显著负相关,区域内生境质量平均值下降2.7%,生境退化水平上升33.4%。生境质量等级不稳定,高等级生境易转为低一等级,兰州、西安-咸阳和太原转化率分别为12.9%、2.9%和1.7%。本研究所用8个影响因素能有效解释生境质量的空间变化(R<sup>2</sup>=68.7%),其中,人口密度和距道路距离是导致生境破碎化的主要因素,坡度、GDP及降水对生境空间格局优化具有积极作用。
Effects of urban expansion on habitat quality in densely populated areas on the Loess Plateau:A case study of Lanzhou,Xi’an-Xianyang and Taiyuan,China
[J].
Hydrogeomorphic ecosystem responses to natural and anthropogenic changes in the Loess Plateau of China
[J].DOI:10.1146/earth.2017.45.issue-1 URL [本文引用: 1]
Spatiotemporal dynamics of ecosystem water use efficiency over the Chinese Loess Plateau base on long-time satellite data
[J].DOI:10.1007/s11356-021-15801-6 [本文引用: 2]
黄河流域城市群形成发育的空间组织格局与高质量发展
[J].
Spatial organization pattern and high-quality development of urban agglomeration in the Yellow River basin
[J].DOI:10.2307/142170 URL [本文引用: 2]
An extended time series (2000—2018) of global NPP-VIIRS-like nighttime light data from a cross-sensor calibration
[J].
DOI:10.5194/essd-13-889-2021
URL
[本文引用: 2]
. The nighttime light (NTL) satellite data have been widely\nused to investigate the urbanization process. The Defense Meteorological\nSatellite Program Operational Linescan System (DMSP-OLS) stable nighttime\nlight data and Suomi National Polar-orbiting Partnership Visible Infrared\nImaging Radiometer Suite (NPP-VIIRS) nighttime light data are two widely\nused NTL datasets. However, the difference in their spatial resolutions and\nsensor design requires a cross-sensor calibration of these two datasets for\nanalyzing a long-term urbanization process. Different from the traditional\ncross-sensor calibration of NTL data by converting NPP-VIIRS to\nDMSP-OLS-like NTL data, this study built an extended time series (2000–2018)\nof NPP-VIIRS-like NTL data through a new cross-sensor calibration from\nDMSP-OLS NTL data (2000–2012) and a composition of monthly NPP-VIIRS NTL\ndata (2013–2018). The proposed cross-sensor calibration is unique due to the\nimage enhancement by using a vegetation index and an auto-encoder model.\nCompared with the annual composited NPP-VIIRS NTL data in 2012, our product\nof extended NPP-VIIRS-like NTL data shows a good consistency at the pixel\nand city levels with R2 of 0.87 and 0.95, respectively. We also found\nthat our product has great accuracy by comparing it with DMSP-OLS radiance-calibrated NTL (RNTL) data in 2000, 2004, 2006, and 2010. Generally, our\nextended NPP-VIIRS-like NTL data (2000–2018) have an excellent spatial\npattern and temporal consistency which are similar to the composited\nNPP-VIIRS NTL data. In addition, the resulting product could be easily\nupdated and provide a useful proxy to monitor the dynamics of demographic\nand socioeconomic activities for a longer time period compared to existing\nproducts. The extended time series (2000–2018) of nighttime light data is\nfreely accessible at https://doi.org/10.7910/DVN/YGIVCD (Chen et\nal., 2020).\n
基于夜间灯光数据估算安徽省县级尺度城镇化水平
[J].
DOI:10.12082/dqxxkx.2020.190515
[本文引用: 2]
城镇化是地区经济发展和社会进步的重要标志,研究城镇化水平对城镇科学发展和政府高效决策具有重要意义。夜间灯光数据包含了人类活动和经济社会发展等信息,弥补了指标法的不确定性和滞后性等不足,可以更加直观地反映城镇化水平,为城镇化研究提供了新的思路。现有的研究,已经有用夜间灯光数据分析宏观尺度的城镇化水平,但由于DMSP-OLS数据和NPP-VIIRS数据的时间范围均较短,且2种数据的时间尺度不连续,且空间分辨率和辐射分辨率不一致,因此目前主要集中于使用一种夜间灯光数据研究城镇化水平,且研究的时间跨度较短。此外,虽然已有研究表明,大尺度的社会经济活动与夜间光照情况有较强的相关关系,但在较小尺度下,这种相关性受地区经济发展以及灯光数据分辨率的影响较大,对估算精度有更高的要求,因此需要使用实际数据证明使用夜间灯光数据估算县级城镇化水平的合理性。本文使用DMSP_OLS和NPP_VIIRS夜间灯光数据,估算了2006—2015年安徽省县级尺度城镇化水平,为夜间灯光数据在长时间序列的城镇化研究中提供理论支撑。首先分别计算DMSP-OLS和NPP-VIIRS平均夜间灯光指数,以NPP-VIIRS灯光指数为自变量,以DMSP-OLS灯光指数为因变量,对2012年和2013年的2种灯光指数年数据进行曲线拟合,建立2种灯光数据的对应关系,得到2006—2015年安徽省各区县的DMSP-OLS平均夜间灯光指数;然后从人口、经济、社会生活和农业机械化4个方面选取城镇化指标,使用层次分析法计算基于统计数据的城镇化水平;最后将灯光指数与基于统计数据的城镇化水平进行相关性分析和线性回归分析,讨论了安徽省各区县灯光指数和基于统计数据的城镇化水平的时空分布的异同点,分析了同时使用两种灯光指数估算长时间序列城镇化水平的合理性。研究结果显示,灯光指数和基于统计数据的城镇化水平在县级尺度上具有高度相关性,相关系数为0.91(P<0.05),线性回归的拟合优度R<sup>2</sup>=0.82。灯光指数和基于统计数据的城镇化水平的时空分布基本一致,空间上,安徽省城镇化水平整体分布不均衡,呈现出东高西低的规律;时间上,2006—2015年城镇化水平呈现逐年增长的趋势,合肥市辖区、马鞍山市辖区等发达城区的城镇化水平增长速度较快,而霍丘县、寿县等经济欠发达地区增长较缓慢。
County urbanization level estimated from nighttime light data in Anhui Province
[J].
黄河中游城镇化与生态系统服务耦合关系的时空变化
[J].
Spatio-temporal changes of the coupling relationship between urbanization and ecosystem services in the Middle Yellow River
[J].
DOI:10.31497/zrzyxb.20210109
[本文引用: 2]
Urbanization is an important factor affecting the pattern of regional ecological security. Clarifying the relationship between urbanization and ecosystem services can provide decision-making references for promoting ecological protection and high-quality development in the Middle Yellow River. Based on the analysis of the spatio and temporal patterns of urbanization and ecosystem services in the Middle Yellow River from 2000 to 2018, the study uses the coupling coordination degree model to analyze the spatio-temporal characteristics of the coupling relationship between urbanization and ecosystem services in the study area. The results show that between 2000 and 2018, the comprehensive urbanization level increased by 72.24%, and the spatial distribution was generally "high in the south and low in the north", with economically developed counties decreasing outward. Grain production, water resource conservation, soil conservation and carbon sequestration services all showed an increasing trend in different spatial distribution trends. Generally, the degree of coupling coordination between grain production, water resource conservation, soil conservation and carbon sequestration services and comprehensive urbanization level is on the rise, but the degree of coupling coordination in the Fenhe-Weihe Plain is low, while that in economically developed counties is high.
Constructing a new inter-calibration method for DMSP-OLS and NPP-VIIRS nighttime light
[J].
DOI:10.3390/rs12060937
URL
[本文引用: 1]
The anthropogenic nighttime light (NTL) data that are acquired by satellites can characterize the intensity of human activities on the ground. It has been widely used in urban development assessment, socioeconomic estimate, and other applications. However, currently, the two main sensors, Defense Meteorological Satellite Program’s Operational Linescan System (DMSP-OLS) and Suomi National Polar-orbiting Partnership Satellite’s Visible Infrared Imaging Radiometer Suite (NPP-VIIRS), provide inconsistent data. Hence, the application of NTL for long-term analysis is hampered. This study constructed a new inter-calibration method for DMSP-OLS and NPP-VIIRS nighttime light to solve this problem. First, NTL data were processed to obtain vicarious site across China. By comparing different candidate models, it is discovered the Biphasic Dose Response (BiDoseResp) model, which is a weighted combination of sigmoid functions, can best perform the regression between DMSP-OLS and logarithmically transformed NPP-VIIRS. The coefficient of determination of BiDoseResp model reaches 0.967. It’s residual sum of squares is 6.136 × 10 5, which is less than 6.199 × 10 5 of Logistic function. After obtaining the BiDoseResp-calibrated VIIRS (BDRVIIRS), we smoothed it by a filter with optimal parameters to maximize the consistency. The result shows that the consistency of NTL data is greatly enhanced after calibration. In 2013, the correlation coefficient between DMSP-OLS and original NPP-VIIRS data in the China region is only 0.621, while that reaches to 0.949 after calibration. Finally, a consistent NTL dataset of China from 1992 to 2018 was produced. When compared with the existing methods, our method is applicable to the full dynamic range of DMSP-OLS. Besides, it is more suitable for country or larger scale areas. It is expected that this method can greatly facilitate the development of research that is based on the historical NTL archive.
Building a series of consistent night-time light data (1992—2018) in Southeast Asia by integrating DMSP-OLS and NPP-VIIRS
[J].DOI:10.1109/TGRS.36 URL [本文引用: 1]
基于DMSP/OLS数据的中国城市化过程研究——反映区域城市化水平的灯光指数的构建
[J].
The study on urbanization process in China based on DMSP/OLS data:Development of a light index for urbanization level estimation
[J].
青藏高原城镇化与生态环境交互影响关系分析
[J].
DOI:10.11821/dlxb202007005
[本文引用: 2]
科学评估青藏高原城镇化与生态环境交互影响的总体状况,对优化城镇化速度和质量,修复和提升生态环境状态具有重要意义。在梳理青藏高原城镇化与生态环境交互影响研究进展基础上,本文尝试构建一套完整的城镇化与生态环境交互影响分析模型体系,实现从综合评价指数分析、耦合协调度量化、耦合类型识别、解耦路径探索到未来趋势预测的全过程解析。以青藏高原及其省域、地级单元多尺度分析对比为手段,尝试厘清尺度之间的差异性,识别出问题区域,并提出针对性的改进措施。研究发现,青藏高原不同尺度间城镇化综合评价指数呈阶段性上升趋势,青海的整体城镇化指数高于西藏;生态环境指数变化趋势不同,青海呈下降态势,西藏则趋向平稳,各地级单元生态环境指数存在分层现象。青藏高原不同尺度城镇化与生态环境耦合协调度总体呈上升趋势,协调类型由失调衰退类向濒临失调衰退类转变,最后转为勉强协调发展类,基本属于城镇化滞后型。城镇化指数与生态环境指数呈现出强脱钩、弱脱钩交互出现的波动态势,说明不同尺度间存在城镇化与生态环境的负相互作用,消极城镇化现象突出。通过预测,青藏高原各地级单元在未来10年内,系统耦合协调度将稳步上升,但各地增长速度将存在显著差距。
Interaction between urbanization and eco-environment in Tibetan Plateau
[J].
DOI:10.11821/dlxb202007005
[本文引用: 2]
Scientifically assessing the interaction between urbanization and eco-environment in the Tibetan Plateau is critical for optimization of urbanization speed and quality, and for the restoration and improvement of the eco-environment. Based on previous studies about the interaction between urbanization and eco-environment in the Tibetan Plateau, we established complete analysis models to examine the overall process, including comprehensive evaluation index analysis, coupling coordination degree measurement, coupling type identification, decoupling path exploration, and future trend prediction. We used a multi-scale comparison analysis method to clarify the differences between scales (across the Tibetan Plateau and its provinces and prefecture-level cities), identify the problem regions, and propose customized improvement measures. Here we show that the comprehensive evaluation index of urbanization has experienced a staged upward trend in different scales, and the overall urbanization index of Qinghai is higher than that of Tibet. However, the changing trends of the eco-environment index are different. The changes in eco-environment index of Qinghai show a decreasing trend, whereas Tibet's changes tend to be stable. The eco-environment index of prefecture-level cities is stratified. We also found that the changing trends of coupling coordination degree of urbanization and eco-environment in different scales were overall rising. The coupling type has changed from imbalanced recession type to nearly imbalanced recession type, and finally to grudgingly coordinated development type. However, most of these types are lagged urbanization types. The alternate change trend between strong decoupling and weak decoupling indicates a negative interaction between urbanization and the eco-environment at different scales. Thus, it can be inferred that the lagged urbanization is a prominent phenomenon. The result of predication shows that in the next 10 years the coupling coordination degree of urbanization and eco-environment will increase steadily in all geographic units, but there will be a gap in the growth rate.
基于夜间灯光数据的甘青宁城市扩展及其建成区植被变化特征研究
[J].
Characteristics of urban expansion and vegetation change in built-up areas of Gan-Qing-Ning based on nighttime light data
[J].
Coupling coordination relationship between urban sprawl and urbanization quality in the West Taiwan Strait urban agglomeration,China:Observation and analysis from DMSP/OLS nighttime light imagery and panel data
[J].
DOI:10.3390/rs12193217
URL
[本文引用: 3]
Urban sprawl is the most prominent characteristic of urbanization, and increasingly affects local and regional sustainable development. The observation and analysis of urban sprawl dynamics and their relationship with urbanization quality are essential for framing integrative urban planning. In this study, the urban areas of the West Taiwan Strait Urban Agglomeration (WTSUA) were extracted using nighttime light imagery from 1992 to 2013. The spatio-temporal characteristics and pattern of urban sprawl were quantitatively analyzed by combining an urban expansion rate index and a standard deviation ellipse model. The urbanization quality was assessed using an entropy weight model, and its relationship with urban sprawl was calculated by a coupling coordination degree model. The results showed that the urban area in the WTSUA experienced a significant increase, i.e., 18,806.73 km2, during the period 1992–2013. The central cities grew by 11.08% and noncentral cities by 27.43%, with a general uneven city rank-size distribution. The urban sprawl showed a circular expansion pattern, accompanied by a gradual centroid migration of urban areas from the southeast coast to the central-western regions. The coupling coordination level between urban expansion and urbanization quality increased from serious incoordination in 1992 to basic coordination in 2013. Dual driving forces involving state-led policies and market-oriented land reform had a positive influence on the harmonious development of urban sprawl and urbanization quality of the WTSUA. This research offers an effective approach to monitor changes in urban sprawl and explore the coupling coordination relationship between urban sprawl and urbanization quality. The study provides important scientific references for the formulation of future policies and planning for sustainable development in urban agglomerations.
基于DMSP/OLS夜间灯光数据的环渤海城市群时空演变研究
[J].
Study of spatio-temporal evolution of the circum-Bohai urban agglomeration based on DMSP/OLS night-time light data
[J].
20世纪90年代中国城市时空变化特征——基于灯光指数CNLI方法的探讨
[J].
Application of compound night light index derived from DMSP/OLS data to urbanization analysis in China in the 1990s
[J].
基于夜间灯光的1992—2012年甘肃省城市空间扩展研究
[J].
Spatial expansion of cities at county-level or above in Gansu Province from 1992 to 2012 based on DMSP nighttime light images
[J].
基于夜光遥感的宁夏沿黄城市群时空演变
[J].
Spatio - temporal evolution of Ningxia urban agglomeration along the Yellow River based on nighttime light remote sensing
[J].
基于夜间灯光影像数据的黄河流域中心城市建成区空间扩展及动力因子分析
[J].
DOI:10.7522/j.issn.1000-694X.2021.00126
[本文引用: 1]
研究黄河流域建成区扩展特征有助于透视用地开发效果和践行中心城市高质量发展规划。基于1992、1997、2002、2007、2012、2018年6期夜间灯光影像与统计数据,提取建成区范围,采用扩展强度指数、紧凑度指数、协调发展系数与灰色关联分析,探究1992—2018年黄河流域8个中心城市扩展的时空格局、质量及动力因子。结果表明:(1)黄河流域中心城市建成区面积分化明显,中下游城市扩展规模和强度大,扩展形态呈紧凑度普遍下降趋势。(2)夜间灯光影像数据刻画的西安建成区综合水平高、西宁水平低,银川综合发展快、兰州慢;除西宁、呼和浩特与太原外,其他中心城市平均夜间灯光指数在1997—2018年呈下降趋势,反映城市扩展水平降低。(3)中心城市人口-土地协调发展系数均呈波动下降趋势,除呼和浩特、太原和济南外,人口-土地由基本协调型向土地过快扩展型转变;中心城市经济-土地协调发展系数呈波动下降趋势,经济年均增长率降低,建成区面积年均扩展率增加,基本由经济过快增长型向经济-土地协调发展型转变。(4)中心城市空间扩展主要受经济发展(地区生产总值)影响;从中心城市整体看,全时段(1996—2018年)行政力(固定资产投资)和内源力(人口规模)影响作用较大,分时段(1996—2002年、2002—2012年与2012—2018年)行政力影响系数亦较高,市场力(社会消费品零售总额)与外向力(实际利用外资额)影响作用程度随时间增加明显。新时期黄河流域中心城市空间扩展应注重内部提质增效,提高建设用地利用效率,促进城市高质量发展。
Study on spatial expansion and dynamic factors of built-up area of central cities in the Yellow River basin based on night-time light data
[J].
2000年以来宁波城市空间扩展特征及其驱动力分析
[J].
Spatial expansion characteristics of Ningbo City and its driving forces since 2000
[J].
