

0 引言
目前,中等空间分辨率遥感影像在石漠化监测中应用较为广泛,以美国陆地卫星Landsat8为例,Wang等[10]利用无人机和Landsat8卫星对兴仁县进行基岩信息提取,得到基岩裸露率分布图,并提出基于多尺度遥感数据的基岩暴露率定量提取方法; 王明明等[11]利用2期Landsat TM数据与1期Landsat8数据对后寨河流域进行石漠化信息提取,揭示了该地区不同等级石漠化的时空演变规律; 郑惠茹等[12]基于Landsat8数据对重庆东北部地区进行不同类型植被信息的提取,掌握了该地区不同植被的空间分布特征与规律。上述研究都利用Landsat8数据对研究区石漠化信息进行提取,为研究区石漠化监测治理做出贡献,但其中存在一个相同问题: 数据空间分辨率不高,从而导致石漠化信息获取有限,影响石漠化信息提取精度。因此,为了提高石漠化信息提取精度,更好服务于石漠化监测工作,亟需分辨率更高的卫星作为数据源。高分六号卫星(GF-6)的宽幅相机数据(wide field of view,WFV)拥有16 m的空间分辨率,且具有特殊的红边波段,能为遥感监测提供更精准信息。目前,利用GF-6提取石漠化信息的研究相对较少,将Landsat8与GF-6数据相对比,可为GF-6的石漠化提取能力和技术应用提供参考。
目前,遥感技术提取石漠化信息主要利用遥感影像的光谱特性构建石漠化评价因子指数,如构建归一化植被指数(normalized difference vegetation index,NDVI)[13-14]、归一化岩石指数(normalized difference rock index,NDRI)[14]和遥感植被指数[15]等。但上述研究中,石漠化提取方法多样,导致石漠化提取效果不统一,且石漠化提取方法无统一标准,不利于研究结果间的对比。混合像元分解能够提取纯净像元的特性,而在石漠化信息提取过程中提取的石漠化评价因子(植被与基岩)都可看作为纯净端元,因此混合像元分解可作为一种石漠化信息提取的方法。近年来,许多学者专家对混合像元分解方法进行了深入研究,Yang等[16]利用纯净像元指数法(pure pixel index,PPI)对江汉平原2015—2017年油菜种植面积进行估算; 陈姣等[17]利用混合调谐匹配滤波法(mixture tuned matched filtering,MTMF)对不透水面特征进行提取; 刘蓉姣等[18]利用PPI对其研究区进行空间分布变化的分析; 杨明星等[19]利用PPI、连续最大角凸锥(sequential maximum angle convex cone,SMACC) 和几何顶点方法对植被端元波谱进行提取,并比较了方法之间的优劣; 方凌江等[20]利用顶点成分分析法(vertex component analysis,VCA)提取端元光谱信息。相较于PPI和SMACC等端元提取方法,VCA方法具有简便高效的特征。
本研究基于GF-6与Landsat8遥感数据,利用VCA与完全约束最小二乘法(fully constrained least squares,FCLS)相结合的混合像元分解方法,提取研究区石漠化信息,探究GF-6红边波段对石漠化信息提取的影响,对比GF-6与Landsat8石漠化信息提取能力的差异,并为GF-6进行石漠化监测工作提供技术参考。
1 研究区概况及其数据源
1.1 研究区概况
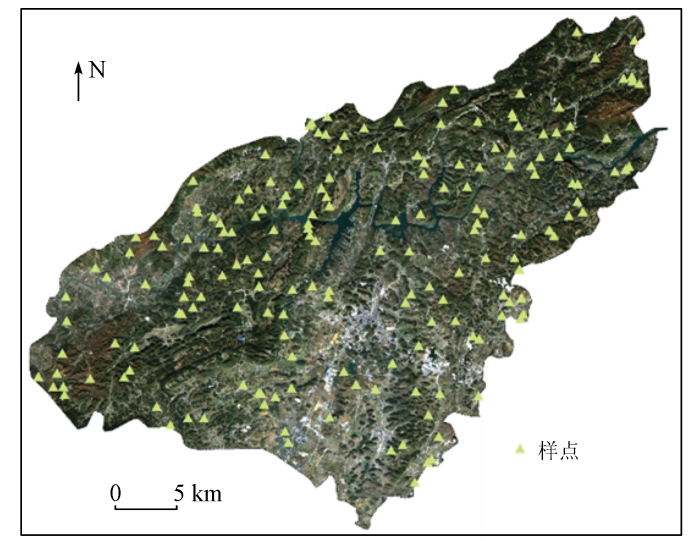
本研究选取普定县(E105°27'49″~E105°58'51″,N26°26'36″~N26°31'42″)为研究区(图1),其位于贵州省西南部的安顺市,约1 091 km2,属中亚热带季风湿润气候,年均气温为15.1℃,年均降水为1 378.2 mm,北部与南部地势陡峭,中部地势相对平缓,全县碳酸盐岩广泛分布,约占全县总面积的85%,喀斯特石漠化显著。据全国第三次石漠化监测公报显示,截至2016年底贵州省石漠化土地约有247.01万hm2,比2011年底的第二次石漠化监测结果减少55.37万hm2,石漠化状况得到改善,但贵州省仍是全国石漠化最为严重的省份,石漠化治理工作仍十分严峻,而普定县是贵州省石漠化最为严重的县域之一。
图1
1.2 数据源
选取GF-6与Landsat8卫星遥感数据(表1)作为数据源,并结合来自国家基础地理信息中心的矢量边界,进行实验研究。考虑到植被的生长周期,同时便于实验的对比,2组数据都选择了在冬季,但是受云量与卫星运行周期的影响,未能获取拍摄日期相同或相近的影像,本研究所使用的GF-6 WFV与Landsat8 OLI遥感影像分别拍摄于2020年11月14日和2019年12月17日。
表1 GF-6与Landsat8波段对应信息
Tab.1
| 波段编号 | GF-6 WFV | Landsat8 OLI | ||
|---|---|---|---|---|
| 波长范围/μm | 空间分 辨率/ m | 波长范围/μm | 空间分 辨率/ m | |
| Band1 | 0.45~0.52 | 16 | 0.433~0.453 | 30 |
| Band2 | 0.52~0.60 | 0.450~0.515 | ||
| Band3 | 0.63~0.69 | 0.525~0.600 | ||
| Band4 | 0.76~0.90 | 0.630~0.680 | ||
| Band5 | 0.69~0.73 (红边波段Ⅰ) | 0.845~0.885 | ||
1.560~1.660 | ||||
| Band6 | 0.73~0.77 (红边波段Ⅱ) | 2.100~2.300 | ||
— | ||||
| Band7 | 0.40~0.45 | |||
| Band8 | 0.59~0.63 | |||
2 研究方法
本研究技术路线如图2所示。首先,在ENVI5.6软件中对GF-6与Landsat8遥感数据进行预处理,主要包括辐射定标、大气校正、正射校正与影像裁剪等操作; 然后,在PIE-HYP平台利用混合像元分解方法对经过预处理的影像进行石漠化信息端元的提取,并结合ArcGIS10.8平台对端元提取结果进行等级划分,得到植被端元分布、基岩端元分布与石漠化等级分布; 最后,利用混淆矩阵与均方根误差对所得结果进行精度评价。
图2

2.1 混合像元分解
遥感卫星数据主要以栅格像元进行记录,但由于受其自身分辨率与自然界地物复杂性的影响,所获得的影像数据中含有大量混合像元,即一个像元中包含了多种地类,而纯净像元是指一个像元中只包含一种地类,因此可以通过识别纯净像元来判断地类。将一个像元内不同“组分”进行分解,求得像元中各个地类所占比例的方法叫做混合像元分解。
2.1.1 纯净端元提取
本研究基于PIE-HYP平台使用VCA方法对纯净端元进行提取,其具体操作可分为以下2步: ①通过PIE-HYP平台对经过预处理的遥感影像进行端元数目估算; ②使用PIE-HYP平台的VCA模块,并输入端元的估算数目进行纯净端元的提取。
2.1.2 丰度反演
通过对纯净端元的提取,得到相应提取端元的波谱曲线,将其与FCLS方法相结合,对预处理影像进行丰度反演,得到植被与基岩丰度图像,最后结合分类标准将丰度图像进行重分类可得到植被端元与基岩端元的空间分布。本文选用的FCLS方法的约束条件为:
式中:
2.2 石漠化程度等级评价方法
表2 石漠化等级评价指标与标准
Tab.2
| 编号 | 石漠化程度 | 植被覆盖率/% | 基岩裸露率/% | 等级 |
|---|---|---|---|---|
| 1 | 无石漠化 | (70,100] | (0,20] | 1 |
| 2 | 潜在石漠化 | (50,70] | (20,30] | 2 |
| 3 | 轻度石漠化 | (30,50] | (30,50] | 3 |
| 4 | 中度石漠化 | (20,30] | (50,70] | 4 |
| 5 | 重度石漠化 | (10,20] | (70,90] | 5 |
| 6 | 极重度石漠化 | (0,10] | (90,100] | 6 |
2.3 精度验证
本研究通过实地勘察获得178个样点(图1),并与Google Earth人工目视解译相结合,建立遥感解译标志(表3)。实地勘察样点过程中,由于普定县已实施大量石漠化治理工程,其境内石漠化状况得到明显改善。因此,在本研究所选取的样点中,重度与极重度石漠化样点较少。本研究利用混淆矩阵计算Kappa系数、总体精度(overall accuracy,OA)、制图精度(producer’s accuracy,PA)、用户精度(user’s accuracy,UA)并结合均方根误差(root mean squared error,RMSE)等评价指标对GF-6与Landsat8提取结果进行精度评价。其中,Kappa系数表示预测结果与真实值之间的匹配程度; OA能够直观地体现预测结果与真实类别之间的正确匹配情况; PA为某一类验证样本被正确分类的概率; UA则为某一类别预测结果正确代表实际真值的概率; RMSE能够表示观测值与真实值的偏差大小。其公式分别为:
式中:
表3 遥感解译标志
Tab.3
| 石漠化等级 | 遥感影像 | 植被覆盖度/% | 基岩裸露率/% | 说明 | 实际调查照片 | 样点个数 |
|---|---|---|---|---|---|---|
| 无石漠化 |  | (70,100] | (0,20] | 影像为饱和度很高的绿色,有明显的颗粒状地物且分布密集 |  | 4 |
| 潜在石漠化 |  | (50,70] | (20,30] | 影像为饱和度较高的浅绿色,有颗粒状地物但分布稀疏 |  | 14 |
| 轻度石漠化 |  | (30,50] | (30,50] | 影像为中度饱和度的浅绿色,几乎无颗状地物分布 |  | 29 |
| 中度石漠化 |  | (20,30] | (50,70] | 影像为饱和度较低的浅绿色,无颗粒状地物分布,有明显的人类活动迹象 |  | 109 |
| 重度石漠化 |  | (10,20] | (70,90] | 影像为棕色,无颗粒状地物分布,有人类活动的迹象但不明显 |  | 20 |
| 极重度石漠化 |  | (0,10] | (90,100] | 影像颜色偏银色,无明显地物分布,无人类活动迹象 |  | 2 |
2.4 地理探测器模型
式中:
3 结果与分析
3.1 石漠化信息端元波谱特征差异
图3

3.2 石漠化信息端元空间分布特征差异与评价
3.2.1 植被端元空间分布特征差异
图4

图4
GF-6和与Landsat8植被端元分布
Fig.4
Distribution of vegetation endmembers in GF-6 and Landsat8
3.2.2 基岩端元空间分布特征差异
图5

图5
GF-6和Landsat8基岩端元分布
Fig.5
Distribution of bedrock endmembers in GF-6 and Landsat8
3.2.3 石漠化信息端元评价
植被端元和基岩端元精度验证结果如图6所示。通过图6发现,GF-6提取的植被端元与基岩端元精度要优于Landsat8,这表明GF-6在石漠化信息端元提取能力强于Landsat8。单从植被端元的验证结果精度来看,GF-6和Landsat8提取结果的OA分别为0.63和0.45,Kappa系数分别为0.50和0.29,RMSE分别为1.19和1.71; 单从基岩端元精度来看,GF-6与Landsat8提取结果的OA分别为0.79和0.61,Kappa系数分别为0.63和0.42,RMSE分别为0.54和0.88。总体来说,GF-6和Landsat8提取的基岩端元精度要高于植被端元,导致这种结果的原因可能是由于目视解译存在着的人为误差以及实地勘测时间与影像拍摄时间的差异。
图6

图6
植被端元和基岩端元精度验证
Fig.6
Accuracy verification of vegetation endmember and bedrock endmember
3.3 石漠化等级空间分布特征与评价
3.3.1 石漠化等级空间分布特征
通过对植被端元与基岩端元的独立分析发现,GF-6提取石漠化信息端元的精度优于Landsat8。为了进一步检验GF-6与Landsat8石漠化信息提取能力的强弱,本研究将植被端元与基岩端元相结合,利用地理探测器模型得出植被端元与基岩端元的贡献率分别为0.56与0.44,因此将植被端元与基岩端元按0.56与0.44的权重进行矢量叠加,得到研究区石漠化等级评价分布(图7),并计算出各等级石漠化的面积占比,从整体的角度对GF-6与Landsat8石漠化信息提取能力做出评价。通过图7发现,研究区整体主要以中度石漠化为主,且石漠化程度由北向南逐渐加深,由西向东逐渐加深,且在人类活动的周边区域石漠化程度普遍偏高,其主要原因是受人类活动的影响。在图7(a)中,无石漠化区域主要分布在北部与南部且分布比较集中,但在图7(b)中,无石漠化区域分布较为零散,但也集中在北部与南部区域; 在图7(a)中,研究区中部与南部主要以中度石漠化与重度石漠化为主,其中重度石漠化分布较为零散,但在图7(b)中,研究区中部与南部以中度石漠化为主,而重度石漠化在此区域分布较少。为了进一步了解GF-6与Landsat8提取石漠化等级的差异,本研究对比各等级石漠化面积发现,2种遥感数据源提取中度石漠化面积差异最大,GF-6提取面积比Landsat8提取面积高16.7百分点,约为165.99 km2; 轻度石漠化面积差异最小,GF-6提取面积比Landsat8提取面积低2.5百分点,约为16.14 km2。
图7

图7
GF-6和Landsat8各等级石漠化分布与石漠化面积占比
Fig.7
Distribution of grade and the percentage of rocky desertification area in GF-6 and Landsat8
3.3.2 石漠化等级评价
为了检验各级石漠化分类精度,本研究利用实际样点对石漠化等级分布进行了精度评价,如表4所示。由于在对研究区石漠化等级评价过程中发现,极重度石漠化区域面积占比很小,且分布零散。因此,本研究在对石漠化等级提取精度分析过程中,未考虑极重度石漠化状况。通过表4可知,GF-6提取结果OA为0.76,Kappa系数为0.56,而Landsat8提取结果OA为0.59,Kappa系数为0.38,且GF-6提取结果的RMSE要低于Landsat8,这说明GF-6石漠化信息提取能力要优于Landsat8。在表4中,GF-6提取中度石漠化的UA最高为0.87,而重度石漠化的UA最低为0.45,无石漠化的PA最高为1,重度石漠化的PA最低为0.38; Landsat8提取中度石漠化的UA最高为0.65,而无石漠化的UA最低为0.25,无石漠化的PA最高为1,重度石漠化的PA最低为0.26。
表4 GF-6与Landsat8各等级石漠化精度评价
Tab.4
| 石漠化等级 | GF-6 | Landsat8 | ||||||||
|---|---|---|---|---|---|---|---|---|---|---|
| UA | PA | OA | Kappa 系数 | RMSE | UA | PA | OA | Kappa 系数 | RMSE | |
| 无石漠化 | 0.75 | 1.00 | 0.76 | 0.56 | 0.64 | 0.25 | 1.00 | 0.59 | 0.38 | 1.27 |
| 潜在石漠化 | 0.79 | 0.61 | 0.36 | 0.71 | ||||||
| 轻度石漠化 | 0.59 | 0.94 | 0.48 | 0.70 | ||||||
| 中度石漠化 | 0.87 | 0.84 | 0.65 | 0.86 | ||||||
| 重度石漠化 | 0.45 | 0.38 | 0.64 | 0.26 | ||||||
4 讨论
本研究基于GF-6与Landsat8遥感数据和混合像元分解方法对贵州省普定县进行石漠化信息的提取,结果表明GF-6石漠化信息评价能力要优于Landsat8,其中GF-6植被端元识别的能力尤为突出,且混合像元分解方法可以作为一种石漠化监测手段应用于实际,但本研究仍有改进之处。
1)从混合像元分解提取方法上看,研究是基于线性混合模型,将VCA与FCLS相结合对遥感数据进行石漠化信息的提取。VCA是一种纯数学的方法,在混合像元分解的过程中易忽略影像的空间信息从而造成误差,后续的研究中可以采用何晓宁等[27]提出的改良后的VCA或者其他端元提取方法,如PPI和SMACC等,来提高提取的精度。
2)从GF-6的红边波段上看,本研究通过对比提取植被、基岩与土壤端元波谱曲线,发现GF-6植被端元波谱曲线在红边波段范围内相较于土壤、基岩端元有显著变化趋势,而Landsat8植被端元波谱曲线在相应的波谱范围内无变化趋势, 因此GF-6相较于Landsat8更容易识别出植被端元。本研究中未对GF-6搭载的红边波段的具体作用做出定量化评价,GF-6植被端元提取精度要高于Landsat8,但GF-6空间分辨率高于Landsat8,无法判断出红边波段对植被端元提取精度影响的大小。在后续的研究中可以利用红边波段构建植被指数,并与其他卫星波段构成的植被指数相比较,研究其在植被信息提取方面的差异,从而做出更为精准的评价。
3)从石漠化信息端元上看,植被与基岩端元在空间分布上具有相似的特征,但提取精度上,GF-6所提取的植被端元OA与Kappa系数分别比Landsat8提取精度高0.18与 0.21,RMSE低0.52,GF-6所提取的基岩端元OA比Landsat8高0.18,Kappa系数高0.21,RMSE低0.34,即GF-6石漠化信息端元提取精度要优于Landsat8,而这与Pu等[28]得出的结果恰恰相反。从植被端元看,GF-6加入了红边波段使得其提取结果精度大大提高; 从基岩端元看,Landsat8有进行碳酸盐岩识别的短波红外波段,能更好地提取基岩端元,但其提取精度却不如GF-6提取结果,这可能是由于卫星的空间分辨率与影像的拍摄时间所导致,但其具体原因还需进行进一步的研究。
4)从石漠化等级评价上看,本研究将混合像元分解所得到的植被与基岩端元分布图按0.56与0.44的权重进行矢量叠加,得到石漠化等级分布情况,发现GF-6提取石漠化等级精度要优于Landsat8。本研究只考虑植被覆盖度与基岩裸露率2种因子对石漠化状况的影响,而实际中影响石漠化状况的因子还有土壤和坡度等。习慧鹏等[26]在进行石漠化等级评价时加入了坡度表征因子,其OA达到了80%,高于本研究提取结果。在后续研究中可以加入其他影响石漠化状况的因子,从而提高石漠化提取精度。
5 结论
本研究利用混合像元分解方法对GF-6和Landsat8提取石漠化信息能力进行比较与评价得到以下结论:
1)在红边波段范围内,GF-6植被端元波谱变化明显区别于基岩与土壤端元,而Landsat8植被、基岩与土壤端元在此范围内无明显差异特征。因此在混合像元分解时,GF-6在区分植被、基岩与土壤端元上更有效。
2)石漠化信息端元提取精度上,GF-6和Landsat8提取植被端元OA分别为0.63和0.45,Kappa系数分别为0.50和0.29,RMSE分别为1.19和1.71; GF-6和Landsat8提取基岩端元OA分别为0.79和0.61,Kappa系数分别为0.63和0.42,RMSE分别为0.54和0.88,表明GF-6提取石漠化信息端元精度高于Landsat8。
3)石漠化等级评价上,GF-6和Landsat8提取石漠化等级OA分别为0.76和0.59,Kappa系数分别为0.56和0.38,RMSE分别为0.64和1.27,表明GF-6提取石漠化等级精度高于Landsat8。在后续研究中可以利用SMACC和PPI等端元提取方法和增加其他石漠化影响因子提高石漠化提取精度,利用红边波段构建植被指数对GF-6红边波段进行定量评价。
参考文献
喀斯特石漠化概念演绎及其科学内涵的探讨
[J].
Concept deduction and its connotation of Karst rocky desertification
[J].
中国西南喀斯特石漠化研究进展与展望
[J].
DOI:10.11820/dlkxjz.2014.01.009
[本文引用: 1]

石漠化是与北方荒漠化和黄土高原水土流失并列的中国三大土地退化问题之一。根据石漠化领域内的相关研究,系统总结了石漠化空间格局及动态过程研究、石漠化发展演化的机理研究等方面的进展与不足,提出构建基于中高分辨率遥感数据的石漠化时序轨迹新方法,并在此基础上进行长时间序列的石漠化过程分析,从时间和空间上定量、定位追踪石漠化的发展演化过程,不仅可以查明石漠化的发生地点及程度,还可以分析其发生和演化机理。将石漠化格局、过程与成因定量分析相结合,可以从更长的时间段内,更加精确地研究石漠化的时空变化规律,全面系统地揭示石漠化演化机制。
Progress and prospect of Karst rocky desertification research in Southwest China
[J].
DOI:10.11820/dlkxjz.2014.01.009
[本文引用: 1]
Karst rocky desertification is the third severe land degradation in China, following desertification in the north and soil and water loss in the Loess Plateau. This paper reviewed the progress and problems in the studies of Karst rocky desertification, and proposed a new method, which is temporal trajectory analysis based on high-resolution remote sensing data. At present, we have achieved great progress in the fields such as karst geology and geomorphology, restoration and reconstruction of Karst ecosystem, spatial pattern and dynamic changes of rocky desertification, evolution mechanism of karst rocky desertification as well as monitoring methods based on remote sensing. However, there are still a number of problemsin the studies of evolutional process of karst rocky desertification: (1) Current studies are mainly focusing on the spatial pattern of the rocky desertification based on remote sensing data and have successfully described the degree of severity of land degradation, but few of them are concerning the evolutional process of karst rocky desertification; (2) Most of the studies on the evolutional mechanism of Karst rocky desertification are qualitative descriptions and few of them are quantitative analyses; (3) The remote sensing monitoring methods normally are the double temporal variation detection method based on the "two time cycle" scales; only the information of "change/no change" or "what changes from what" can be acquired. Therefore, a new method, temporal trajectory analysis based on middle/high resolution remote sensing data, is introduced in this paper. This methodfocuses on "continuous" variations in a long time scale, and it is concerning not only what has changed between two time points, but also "where" and "how" the changes happened. By the temporal trajectory analysis method, the rocky desertification process in a long time series can be investigated, and the development of rocky desertification can be quantitatively and spatiallytracked, so that we can know where, how and why the rocky desertification has happened. Temporal trajectory analysis method has advantages in discovering the evolutional process of rocky desertification. Moreover, quantitative analysis ofthe pattern, process and evolutional mechanism of Karst rocky desertification will be the trend in the future.
Optimization of rocky desertification classification model based on vegetation type and seasonal characteristic
[J].
DOI:10.3390/rs13152935
URL
[本文引用: 1]
Building a high-precision, stable, and universal automatic extraction model of the rocky desertification information is the premise for exploring the spatiotemporal evolution of rocky desertification. Taking Guizhou province as the research area and based on MODIS and continuous forest inventory data in China, we used a machine learning algorithm to build a rocky desertification model with bedrock exposure rate, temperature difference, humidity, and other characteristic factors and considered improving the model accuracy from the spatial and temporal dimensions. The results showed the following: (1) The supervised classification method was used to build a rocky desertification model, and the logical model, RF model, and SVM model were constructed separately. The accuracies of the models were 73.8%, 78.2%, and 80.6%, respectively, and the kappa coefficients were 0.61, 0.672, and 0.707, respectively. SVM performed the best. (2) Vegetation types and vegetation seasonal phases are closely related to rocky desertification. After combining them, the model accuracy and kappa coefficient improved to 91.1% and 0.861. (3) The spatial distribution characteristics of rocky desertification in Guizhou are obvious, showing a pattern of being heavy in the west, light in the east, heavy in the south, and light in the north. Rocky desertification has continuously increased from 2001 to 2019. In conclusion, combining the vertical spatial structure of vegetation and the differences in seasonal phase is an effective method to improve the modeling accuracy of rocky desertification, and the SVM model has the highest rocky desertification classification accuracy. The research results provide data support for exploring the spatiotemporal evolution pattern of rocky desertification in Guizhou.
The challenge and future of rocky desertification control in Karst areas in southwest China
[J].
DOI:10.5194/se-7-83-2016
URL
[本文引用: 1]
. Karst rocky desertification occurs after vegetation deteriorates as a result of intensive land use, which leads to severe water loss and soil erosion and exposes basement rocks, creating a rocky landscape. Karst rocky desertification is found in humid areas in southwest China, the region most seriously affected by rocky desertification in the world. In order to promote ecological restoration and help peasants out of poverty, the Chinese government carried out the first phase of a rocky desertification control project from 2006 to 2015, which initially contained the expansion of rocky desertification. Currently, the Chinese government is prepared to implement the second phase of the rocky desertification control project, and therefore it is essential to summarise the lessons learned over the last 10 years of the first phase. In this paper, we analyse the driving social and economic factors behind rocky desertification, summarise the scientific research on rocky desertification in the region, and finally identify the main problems facing rocky desertification control. In addition, we put forward several policy suggestions that take into account the perspective of local peasants, scientific research, and China's economic development and urbanisation process. These suggestions include promoting the non-agriculturalization of household livelihoods, improving ecological compensation, strengthening the evaluation of rocky desertification control and dynamic monitoring, and strengthening research on key ecological function recovery technologies and supporting technologies.\n
Spectral analysis of seasonal rock and vegetation changes for detecting Karst rocky desertification in southwest China
[J].DOI:10.1016/j.jag.2021.102337 URL [本文引用: 1]
中国西南喀斯特石漠化治理现状及对策
[J].
DOI:10.11988/ckyyb.20210453
[本文引用: 1]
我国西南喀斯特地区石漠化问题严重,虽然通过石漠化治理措施遏制了整体扩张趋势,但是治理形势并不乐观,生态环境质量有待进一步改善。针对中国西南石漠化治理存在的治理成果难以有效维持、无法彻底消除人地矛盾、治理难度不断提高等问题,在系统梳理西南喀斯特地区的特殊性、石漠化成因、西南喀斯特地区石漠化综合治理模式的基础上,从重视区域整体治理与系统修复、探索喀斯特生态产品价值实现机制与途径、加强喀斯特地区生态补偿、探索喀斯特地区社会-生态系统的协同机制四方面,提出了面向区域整体治理与绿色发展的对策建议,为我国西南地区生态环境和社会经济协同高质量发展提供科学参考。
Current situation and measures of Karst rocky desertification control in Southwest China
[J].
西南岩溶地区石漠化综合治理研究
[J].
The experience and practice of desertification control in Karst region of southwest China
[J].
The evolution of a Karst rocky desertification land ecosystem and its driving forces in the Houzhaihe area,China
[J].DOI:10.4236/oje.2015.510041 URL [本文引用: 1]
Quantifying the effectiveness of ecological restoration projects on long-term vegetation dynamics in the Karst regions of Southwest China
[J].DOI:10.1016/j.jag.2016.09.013 URL [本文引用: 1]
Quantitative extraction of the bedrock exposure rate based on unmanned aerial vehicle data and Landsat8 OLI image in a Karst environment
[J].DOI:10.1007/s11707-017-0681-9 [本文引用: 1]
典型小流域喀斯特石漠化演变特征及其关键表征因子与驱动因素
[J].
Evolution characteristics of Karst rocky desertification in typical small watershed and the key characterization factor and driving factor
[J].
基于面向对象的石漠化山区植被信息提取及分布特征研究
[J].
Research on vegetation information extraction and distribution characteristics of rocky desertification area by means of object oriented approach
[J].
面向对象的喀斯特地区石漠化遥感信息提取研究——以贵州省大方地区为例
[J].
Object-oriented remote sensing information extraction method for rocky desertification in Karst area: A case study of Dafang County,Guizhou
[J].
基于Google Earth Engine的典型峰丛洼地石漠化时空演变与驱动因子分析——以西畴县为例
[J].
Analysis of the spatial and temporal evolution and driving factors of rocky desertification in typical cluster depression areas in the past 30 years based on Google Earth Engine:Taking Xichou County as an example
[J].
遥感植被指数增强石漠化信息研究
[J].
Research on the enhancement of stony desertification information by remote sensing vegetation indexes
[J].
Estimation of rape-cultivated area based on decision tree and mixed pixel decomposition
[J].DOI:10.1007/s12524-021-01309-6 [本文引用: 1]
多季相混合像元部分分解特征的不透水面分类
[J].
Impervious surface area classification based on partial unmixing of multi-season mixed pixels
[J].
基于混合像元分解的香格里拉市高山松空间分布变化研究
[J].
Spatial distribution changes of the pinus densata forests in Shangrila City based on mixed pixel decomposition
[J].
基于Landsat8的云南松光谱端元选择与评价研究
[J].
Evaluation on spectral endmember of pinus yunnanensis based on Landsat8
[J].
基于顶点成分分析的高光谱图像端元提取算法
[J].
Endmembers extraction for hyperspectral images based on vertex component analysis
[J].
顶点成分分析法应用于高光谱图像端元提取
[J].
Application of vertex component analysis in end member extraction for hyperspectral image
[J].
贵州喀斯特石漠化分类分级探讨
[J].
Discussion on classification and gradation of Karst rocky desertification in Guizhou Province
[J].
遥感石漠化信息的提取
[J].石漠化信息提取是多种信息综合分析、反馈的过程。通过分析当前石漠化分级体系,对比喀斯特地区与石漠化范围、土地利用与石漠化关系,并结合当前石漠化信息提取关键技术研究认为:目前的石漠化分级体系在划分级别、分级指标、分级区域等方面存在巨大差异,将尺度划分引入石漠化等级体系是统一石漠化等级划分差异的有力途径;充分利用基于内容的特征识别算法进行喀斯区的圈定可以有效提高石漠化信息提取精度;利用已有的土地利用矢量数据,通过合理转换进行石漠化信息提取是重要研究思路;传统的建立石漠化解译标志、改进植被指数模型以及建立波谱关系模型等石漠化信息提取方法无法很好融合石漠化综合指征,提出基于遥感的石漠化综合指标度进行石漠化信息的提取方法。
Information extraction of Karst rocky desertification using remote sensing
[J].
基于地理探测器的珠江流域NDVI时空变化及驱动力分析
[J].
Spatiotemporal varitation NDVI and its driving forces in the Pearl River basin based on geodetector
[J].
西南典型喀斯特地区石漠化时空演变特征——以贵州省普定县为例
[J].
Spatio-temporal characteristics of rocky desertification in typical Karst area of Southwest China:A case study of Puding Country,Guizhou Province
[J].
基于顶点成分分析法的端元提取改进算法
[J].顶点成分分析(VCA)算法没有考虑图像的空间信息,对于噪声较大的高光谱图像其有效性可能会降低;同时其算法需要预先确定端元数量,显然端元数的正确性对丰度分解具有较大风险;另外由于算法迭代投影的初始基准具有随机性,因此导致了多次运行结果不稳定。针对以上三方面问题,本文利用图像空间信息排除噪声,确定候选端元;并对候选端元集进行病态矩阵规避判断,确保候选端元矩阵的有效性;经过改进迭代,端元矩阵趋近完整、稳定,自适应获得端元个数。实验表明,该方法正确有效,改进了VCA算法缺陷。
An improved algorithm of endmember extraction based on vertex component analysis
[J].顶点成分分析(VCA)算法没有考虑图像的空间信息,对于噪声较大的高光谱图像其有效性可能会降低;同时其算法需要预先确定端元数量,显然端元数的正确性对丰度分解具有较大风险;另外由于算法迭代投影的初始基准具有随机性,因此导致了多次运行结果不稳定。针对以上三方面问题,本文利用图像空间信息排除噪声,确定候选端元;并对候选端元集进行病态矩阵规避判断,确保候选端元矩阵的有效性;经过改进迭代,端元矩阵趋近完整、稳定,自适应获得端元个数。实验表明,该方法正确有效,改进了VCA算法缺陷。
Extracting information on rocky desertification from satellite images:A comparative study
[J].
DOI:10.3390/rs13132497
URL
[本文引用: 1]
Rocky desertification occurs in many karst terrains of the world and poses major challenges for regional sustainable development. Remotely sensed data can provide important information on rocky desertification. In this study, three common open-access satellite image datasets (Sentinel-2B, Landsat-8, and Gaofen-6) were used for extracting information on rocky desertification in a typical karst region (Guangnan County, Yunnan) of southwest China, using three machine-learning algorithms implemented in the Python programming language: random forest (RF), bagged decision tree (BDT), and extremely randomized trees (ERT). Comparative analyses of the three data sources and three algorithms show that: (1) The Sentinel-2B image has the best capability for extracting rocky desertification information, with an overall accuracy (OA) of 85.21% using the ERT method. This can be attributed to the higher spatial resolution of the Sentinel-2B image than that of Landsat-8 and Gaofen-6 images and Gaofen-6’s lack of the shortwave infrared (SWIR) bands suitable for mapping carbonate rocks. (2) The ERT method has the best classification results of rocky desertification. Compared with the RF and BDT methods, the ERT method has stronger randomness in modeling and can effectively identify important feature factors for extracting information on rocky desertification. (3) The combination of the Sentinel-2B images and the ERT method provides an effective, efficient, and free approach to information extraction for mapping rocky desertification. The study can provide a useful reference for effective mapping of rocky desertification in similar karst environments of the world, in terms of both satellite image sources and classification algorithms. It also provides important information on the total area and spatial distribution of different levels of rocky desertification in the study area to support decision making by local governments for sustainable development.
