

0 引言
高光谱数据凭借其狭窄波段和近似连续的谱形,可供详细和定量地分析地物特征,在地质调查尤其是地质找矿领域拥有得天独厚的技术优势[1⇓⇓⇓⇓-6]。以往限于高光谱遥感数据的匮乏,主要是利用机载高光谱遥感数据开展小面积调查应用; 随着国产高光谱卫星的陆续发射,极大丰富了高光谱遥感数据源。资源一号02D(ZY-1 02D)卫星于2019年9月12日发射升空,该星作为中国自主建造并成功运行的首颗民用高光谱业务卫星,是国家民用空间基础设施中新型对地观测卫星发展的又一重要成果。其高光谱载荷可实现166个谱段的数据同时获取和下传,在矿物信息提取和岩性-构造识别等地质调查应用评价中取得了较好的应用效果[7]。具有同样高光谱载荷的ZY-1 02E卫星已于2021年12月26日发射升空,目前已经完成在轨测试分析工作,并已投入在轨业务运行,这将进一步提高地质应用的卫星高光谱数据源保障。利用高光谱遥感数据开展地质应用,特别是矿物识别,主要是依据高光谱遥感反射率产品,根据不同岩矿反射光谱诊断特征的差异,对其进行区分和识别。因此,反射率产品的精度直接影响矿物识别的精度和效果。
在高光谱遥感数据矿物信息识别应用中,对短波红外精细光谱特征识别和提取具有很高的要求,而不同的大气校正模型因原理和参数设置等方面的不同,其大气校正结果会有所差异,对后续的应用产生一定影响。王正海等[15]基于线性回归经验模型和辐射传输模型(FLAASH和ACORN)对Hyperion数据进行大气校正,评价其校正效果认为辐射传输模型更简便、实用和精确; Kruse[16]分别利用ATREM,ACORN和FLAASH等3种基于辐射传输模型的大气校正方法对AVIRIS机载高光谱数据进行大气校正,发现FLAASH模型在确保反演精度的同时使用更灵活,对数据格式、数据大小等限制较少; Rani等[17]评价了FLAASH和QUAC这2种大气校正模型对于Hyperion数据矿物填图的影响,认为FLAASH模型能获得较好的大气校正效果,但当缺少相应的参数时,QUAC模型更适合; 田青林等[18]在利用WorldView-3影像对比分析FLAASH和ATCOR大气校正效果时,得出了ATCOR模型优于FLAASH模型的结论,但对比分析重点集中在目视效果、光谱整体谱形及分类精度方面,对地质应用尤其重要的局部光谱吸收特征及对矿物信息提取的影响则尚未提及。因此,本文在以往研究的基础上,采用精度相对较高的FLAASH,QUAC和ATCOR等3种大气校正模型,对ZY-1 02D高光谱数据进行大气校正; 并从校正影像的目视效果、典型地物波谱特征分析以及矿物信息识别精度3个层次进行对比分析,以较全面地评估3种大气校正模型的应用效果,为后续ZY-1 02D和02E业务高光谱卫星数据的推广应用提供技术支持。
1 研究区概况与数据源
1.1 研究区概况
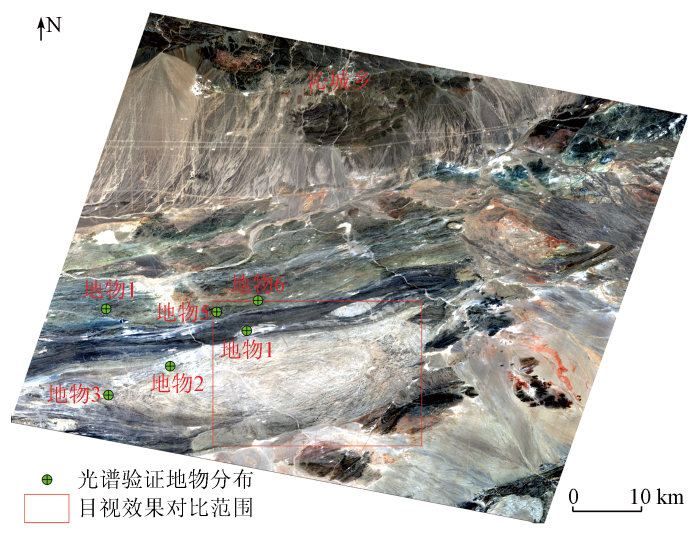
研究区位于新疆东天山哈密市东南(图1),总体地势南高北低,海拔在500~1 500 m左右,属丘陵、沙漠、砾石戈壁地貌,干燥少雨,植被稀梳。区内基岩裸露,由于受内生及表生地质作用的影响较大,侵入岩普遍蚀变较强,其中基性岩和超基性岩的褐铁矿化、绿泥石化、绿帘石化或蛇纹石化等较发育,而中酸性岩体的白云母化、绢云母化、绿泥石化、高岭石化和黄铁矿化等也较发育[19]。矿产资源相对丰富,主要为铜镍硫化物矿床、钒钛磁铁矿和金矿。也正因为研究区较独特的自然地貌和地质特征,被建设为国内第一个遥感地质试验场,用于遥感技术基础理论研究、技术试验、有效载荷指标的论证及评价、遥感影像质量的评价等[20]。因此,本文特选取该区域作为研究区。
图1
1.2 数据源
ZY-1 02D光学卫星搭载了可见光—近红外相机和高光谱相机,平均轨道高度为778 km,幅宽为60 km,空间分辨率为30 m,共获取波段数166个,其中可见光—近红外波段范围76个波段,光谱范围为395~1 040 nm,光谱分辨率为10 nm; 短波红外波段范围90个波段,光谱范围为1 005~2 501 nm,光谱分辨率为20 nm。
2 研究方法
2.1 FLAASH模型
FLAASH(fast line-of-sight atmospheric analysis of spectral hypercubes)基于MODTRAN4+辐射传输模型,涵盖可见光、近红外及短波红外波段。通过对辐射定标后的影像进行大气校正,精确补偿大气影响,并引入大气点扩散函数有效消除邻域效应,获得较高的地物反射率精度。FLAASH模型假设地表为标准平面朗伯体,传感器接收的像元光谱辐射亮度的计算公式为[21]:
式中:
2.2 QUAC模型
QUAC模型是以经验为依据,通过影像像元光谱特征估计大气状况; 不需要额外的参数信息,只需要在参数设置中选择传感器类型,便可自动从影像内收集不同地物的波谱信息以获取大气补偿参数和经验值,实现快速大气校正。在理想情况下,其计算结果绝对精度近似 FLAASH 或者其他基于辐射传输模型的大气校正方法[22]。本次试验中传感器类型选择 Unknown,其他参数选择默认设置。
2.3 ATCOR模型
ATCOR 大气校正模型最早由德国Wessling光电研究所Richter博士于1990年研究提出,并且是经过大量验证的一种快速大气校正算法。ATCOR模型包含2种模式: 一种是ATCOR4模式,适用于航空遥感影像的大气校正; 另一种是ATCOR2/3模式,适用于卫星遥感影像的大气校正。本次研究使用的ATCOR2模型,其算法核心是一个以MODTRAN4程序计算辐射传输方程的数据库,通过输入传感器的几何条件、光谱特征及成像时气溶胶等参数,对生成的动态查找表进行插值计算,从而实现快速准确的大气校正[23]。
2.4 矿物信息提取方法
采用光谱角(spectral angle mapping,SAM)矿物信息提取算法,进行研究区的典型矿物信息提取。SAM是把影像中每个像元的光谱视为一个N维向量,通过计算2个向量间的夹角来度量光谱间的相似性,夹角越小,2个光谱越相似,属于同类地物的可能性越大,因而可根据SAM的数值大小来辨别未知数据的类别[24]。其计算公式为:
式中:
3 结果与分析
3.1 目视效果
为了更好地对比3种不同大气校正模型处理后的ZY-1 02D高光谱数据目视效果,选取纹理复杂、色调差异较大的高亮岩体地区(图1红框范围),大气校正后结果如图2所示。相较于原始影像,大气校正后的影像在视觉效果上均有所提升,尤其是在反射率较强的高亮岩体区域,原始影像由于受大气气溶胶、水汽等因素的影响,影像整体偏亮,地物的明暗差异对比度较低,细小的条状纹理特征模糊,与背景较难区分; FLAASH(图2(a))和QUAC(图2(b))大气校正效果有所改善,但相较于原始影像改善效果不明显; ATCOR(图2(c))大气校正目视效果略微优于FLAASH和QUAC,影像整体信息更丰富一些,色调差异明显加强,纹理更清晰,影像上发育的大面积复杂节理等岩性信息更易于识别,对后续的岩性—构造解译等工作实用性较强。
图2
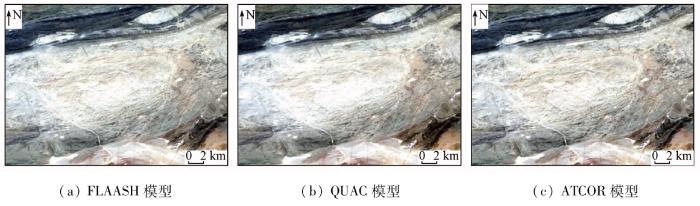
图2
3种模型大气校正后真彩色影像
(ZY-1 02D B29(R),B19(G),B8(B)真彩色合成影像)
Fig.2
True color images after atmospheric correction for the FLAASH, QUAC and ATCOR models
3.2 地物波谱分析
表1 典型地物影像光谱与ASD光谱相关系数对比分析
Tab.1
| 模型 | 地物1 | 地物2 | 地物3 | 地物4 | 地物5 | 地物6 | 平均值 | 标准差 |
|---|---|---|---|---|---|---|---|---|
| FLAASH | 0.937 | 0.636 | 0.633 | 0.939 | 0.979 | 0.985 | 0.851 5 | 0.154 5 |
| QUAC | 0.791 | 0.372 | 0.340 | 0.893 | 0.954 | 0.949 | 0.716 5 | 0.260 6 |
| ATCOR | 0.926 | 0.775 | 0.775 | 0.954 | 0.962 | 0.965 | 0.892 8 | 0.084 3 |
FLAASH和ATCOR大气校正结果较好,6种地物相关系数平均值达到0.85以上,以绿泥石为主的暗地物(地物4—6)相关系数更是在0.9以上。QUAC大气校正结果稳定性较差,暗地物验证点(地物4—6)影像光谱与ASD光谱的相关系数也达到0.9左右,但亮地物验证点相关系数较低,地物2和地物3只有0.3左右。
地物验证点影像光谱与ASD光谱对比如图3所示,地物1—3(亮地物)FLAASH大气校正和ATCOR大气校正影像光谱与实测ASD光谱相比整体谱形具有较高的一致性,但在可见光—近红外波段范围,FLAASH大气校正结果较准确,ATCOR影像光谱在1 000 nm左右陡坎现象严重,QUAC影像光谱表现出与ASD光谱不一致的高反射现象,两者结果均会影响铁染矿物的识别。2 100~2 400 nm短波红外波段范围内,3种方法在2 199 nm处均表现出绢云母的吸收特征,但特征吸收深度有所差异,ATCOR大气校正效果要优于FLAASH和QUAC。地物4—6(暗地物)3种大气校正影像光谱与实测ASD光谱相比整体谱形相似性也较高,可见光—近红外波段范围与亮地物类似,FLAASH大气校正结果较准确,ATCOR影像光谱在1 000 nm左右依然存在陡坎现象,QUAC影像光谱虽然反射率较高,但谱形和ASD光谱保持一致。2 100~2 400 nm短波红外波段范围内,3种大气校正模型在2 250 nm和2 334 nm处表现出绿泥石矿物特有的双吸收特征,且吸收深度相差不大。
图3
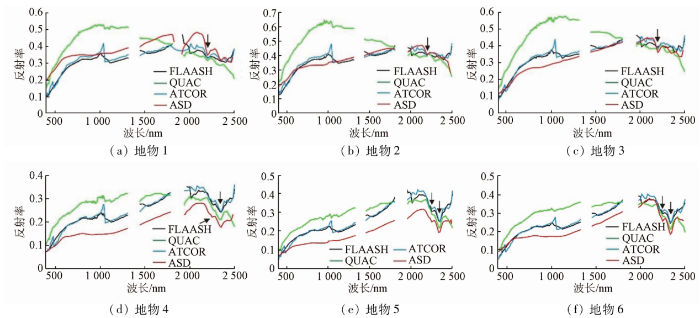
图3
地物验证点ASD光谱与大气校正后光谱对比
Fig.3
Comparison of ASD spectra of ground objects with atmospherically corrected spectra
综上可见,3种大气校正模型均能得到具有一定精度的典型亮、暗地物的反射率反演产品,可为地质调查应用提供可靠的基础反射率数据。然而,利用高光谱反射率数据开展矿物识别时,矿物的诊断特征吸收深度是矿物含量的一种直观反映,且诊断特征吸收深度越深越利于识别; 因此,从这个角度来看,结合以上分析,当识别矿物吸收特征位于可见光—近红外波段时,可选择FLAASH大气校正模型; 当识别矿物吸收特征位于短波红外波段,ATCOR模型较则略有优势。
3.3 典型矿物信息提取
图4

图4
3种模型大气校正矿物信息提取
Fig.4
Mineral information extraction by three atmospheric correction models
图5
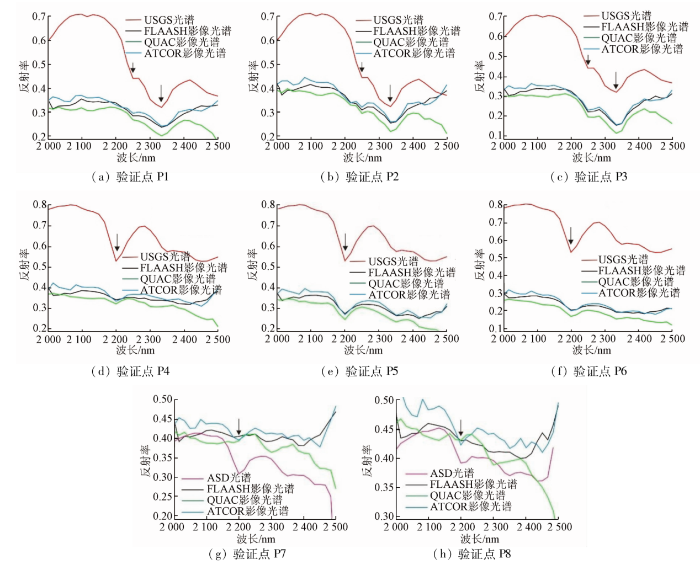
图5
影像光谱与USGS光谱及ASD光谱对比
Fig.5
Comparison of image spectra with USGS spectra and ASD spectra
综上,3种模型大气校正后影像提取的绢云母和绿泥石矿物信息准确率较高。但是观察三者的矿物分布情况发现,绿泥石矿物信息提取结果分布范围大致相同,而绢云母信息提取结果有明显差异,ATCOR模型提取的绢云母信息明显要比FLAASH和QUAC模型提取的绢云母信息分布范围广。因此,在FLAASH和QUAC模型未提取出绢云母但ATCOR模型提取出绢云母区域,选取2个验证点P7和P8进行野外实测ASD光谱验证。经分析发现(如图5中P7和P8所示),ASD光谱和ATCOR模型影像光谱均具有绢云母吸收特征,而FLAASH和QUAC模型影像光谱绢云母特征很微弱,因此会造成在相同阈值和参数设置的条件下,FLAASH和QUAC大气校正模型会造成部分绢云母信息的漏提。
3.4 讨论
1)利用FLAASH,QUAC和ATCOR等3种大气校正模型提取的绿泥石和绢云母2种矿物信息较准确,其中绿泥石信息与ASD光谱一致性较高,而绢云母信息一致性偏低。与地面测试光谱对比发现,FLAASH和QUAC模型大气校正后影像会有部分绢云母信息的漏提。通过分析3种大气校正模型的绢云母信息相对浓度(图6)可以看出,FLAASH和QUAC模型大气校正绢云母信息漏提的区域基本为绢云母浓度较低的区域,在这些区域FLAASH和QUAC模型相比ATCOR大气校正结果,其影像光谱对绢云母的诊断吸收光谱特征表现较弱(图5中P7和P8),因此在相同的阈值和参数设置条件下,会造成3种大气校正模型不同的矿物信息提取结果。
图6
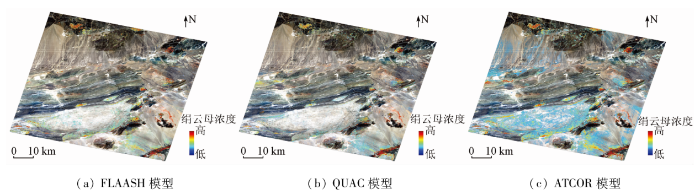
图6
3种模型大气校正绢云母浓度
Fig.6
Sericite concentration by three atmospheric correction models
2)从大气校正策略差异上分析,认为造成上述现象的原因可能是: ATCOR模型在大气、几何等参数反演过程中,采用循环迭代的方式,查找表动态更新[23],反演的参数可能更接近相同大气环境的实测数据。因此,ATCOR大气校正的反演结果比FLAASH和QUAC模型在一些波段的准确性略高,如文中对比发现的2 199 nm波段。
3)矿物的诊断光谱特征吸收深度对于矿物识别具有重要指示或参考意义,反演的遥感反射率数据的光谱谱形特征和诊断光谱特征吸收深度均越接近地物真实光谱特征,就更易于被识别,同时矿物定量反演精度更高。如2 199 nm波段是绢云母等矿物的诊断特征吸收波长位置,不同的大气校正反演结果,在识别结果上表现出较明显的差异。
4)本研究中对比发现FLAASH和QUAC模型在2 199 nm波段位置的反演精度相较ATCOR略低,致使地面绢云母含量较低区域的漏识率较高。因此,在开展矿物填图应用中,ATCOR模型大气校正结果对矿物弱信息识别更具优势。
4 结论
1)通过影像大气校正的目视效果分析,ATCOR,FLAASH和QUAC等3种模型均能有效消除大气气溶胶、水汽等因素的影响,而ATCOR模型要优于FLAASH和QUAC模型。
2)通过对比研究区典型亮暗地物反射率光谱,发现对于亮地物的大气校正ATCOR模型和FLAASH模型要优于QUAC模型,对于暗地物的大气校正则3种模型精度均比较高。且当识别矿物吸收特征位于可见光—近红外波段时,可选择FLAASH大气校正模型; 当识别矿物吸收特征位于短波红外波段时,ATCOR模型则略有优势。
3)从提取的绿泥石和绢云母2种矿物信息分析,绿泥石提取结果一致性较高,绢云母提取结果一致性偏低。其主要原因是FLAASH和QUAC模型在2 199 nm波段吸收深度相较ATCOR模型略低,致使在绢云母含量较低区域,会有部分信息漏识别。
综上所述,3种模型对ZY-1 02D高光谱反射率反演结果均能较好地满足地质调查应用需求。本研究结合研究区发育的典型矿物,对比了ATCOR,FLAASH和QUAC模型的矿物识别应用效果,虽然对比发现在部分具有矿物诊断吸收特征波段位置,ATCOR模型较FLAASH和QUAC模型总体上反演结果更准确,但后续还需要开展多种矿物、多区域实验验证,从不同地貌、不同大气模式以及模型处理效率等多个方面进一步综合、全面地评价3种模型在不同场景应用中的适用性。
参考文献
高光谱遥感异常信息在阿尔金索拉克地区铜金矿找矿工作中的应用
[J].
Application of hyperspectral remote sensing data-based anomaly extraction in copper-gold prospecting in the Solake area in the Altyn metallogenic belt,Xinjiang
[J].
高光谱在甘肃红山多金属找矿模型构建中的应用
[J].
Application of hyperspectral spectroscopy to constructing polymetallic prospecting model in Hongshan,Gansu Province
[J].
基于航空高光谱遥感的沉积变质型铁矿找矿预测——以北祁连镜铁山地区为例
[J].
Prospecting prediction of sedimentary metamorphic type iron deposits based on airborne hyperspectral remote sensing:A case study of the Jingtieshan area in the northern Qilian Mountains
[J].
Characterization of the hydrothermal systems associated with Archean VMS-mineralization at Panorama,Western Australia,using hyperspectral,geochemical and geothermometric data
[J].DOI:10.1016/j.oregeorev.2011.07.001 URL [本文引用: 1]
Imaging spectroscopy of jarosite cement in the Jurassic Navajo Sandstone
[J].DOI:10.1016/j.rse.2010.05.002 URL [本文引用: 1]
Hyperspectral remote sensing applied to mineral exploration in southern Peru:A multiple data integration approach in the Chapi Chiara gold prospect
[J].DOI:10.1016/j.jag.2017.05.004 URL [本文引用: 1]
资源一号02D卫星高光谱数据地质调查应用评价
[J].
Application evaluation of ZY-1-02D satellite hyperspectral data in geological survey
[J].
Toward atmospheric correction algorithms for Sentinel-3/OLCI images of productive waters
[J].
DOI:10.3390/rs14153663
URL
[本文引用: 1]

Atmospheric correction of remote sensing imagery over optically complex waters is still a challenging task. Even algorithms showing a good accuracy for moderate and extremely turbid waters need to be tested when being used for eutrophic inland basins. Such a test was carried out in this study on the example of a Sentinel-3/OLCI image of the productive waters of the Gorky Reservoir during the period of intense blue-green algal bloom using data on the concentration of chlorophyll a and remote sensing reflectance measured from the motorboat at many points of the reservoir. The accuracy of four common atmospheric correction (AC) algorithms was examined. All of them showed unsatisfactory accuracy due to incorrect determination of atmospheric aerosol parameters and aerosol radiance. The calculated aerosol optical depth (AOD) spectra varied widely (AOD(865) = 0.005 − 0.692) even over a small area (up to 10 × 10 km) and correlated with the measured chlorophyll a. As a result, a part of the high water-leaving signal caused by phytoplankton bloom was taken as an atmosphere signal. A significant overestimation of atmospheric aerosol parameters, as a consequence, led to a strong underestimation of the remote sensing reflectance and low accuracy of the considered AC algorithms. To solve this problem, an algorithm with a fixed AOD was proposed. The fixed AOD spectrum was determined in the area with relatively “clean” water as 5 percentiles of AOD in all water pixels. The proposed algorithm made it possible to obtain the remote sensing reflectance with high accuracy. The slopes of linear regression are close to 1 and the intercepts tend to zero in almost all spectral bands. The determination coefficients are more than 0.9; the bias, mean absolute percentage error, and root-mean-square error are notably lower than for other AC algorithms.
Remote sensing of water vapor in the near IR from EOS/MODIS
[J].DOI:10.1109/36.175321 URL [本文引用: 1]
The use of the empirical line method to calibrate remotely sensed data to reflectance
[J].DOI:10.1080/014311699211994 URL [本文引用: 1]
Imaging spectrometry:Spectral resolution and analytical identification of spectral features
[C]//
Estimation of spectral resolution of imaging spectrometers from Fraunhofer lines with the MODTRAN atmospheric model
[J].DOI:10.1134/S1024856019060101 [本文引用: 1]
Atmospheric correction of airborne hyperspectral CASI data using polymer,6S and FLAASH
[J].
DOI:10.3390/rs13245062
URL
[本文引用: 1]
Airborne hyperspectral data play an important role in remote sensing of coastal waters. However, before their application, atmospheric correction is required to remove or reduce the atmospheric effects caused by molecular and aerosol scattering and absorption. In this study, we first processed airborne hyperspectral CASI-1500 data acquired on 4 May 2019 over the Uljin coast of Korea with Polymer and then compared the performance with the other two widely used atmospheric correction approaches, i.e., 6S and FLAASH, to determine the most appropriate correction technique for CASI-1500 data in coastal waters. Our results show the superiority of Polymer over 6S and FLAASH in deriving the Rrs spectral shape and magnitude. The performance of Polymer was further evaluated by comparing CASI-1500 Rrs data with those obtained from the MODIS-Aqua sensor on 3 May 2019 and processed using Polymer. The spectral shapes of the derived Rrs from CASI-1500 and MODIS-Aqua matched well, but the magnitude of CASI-1500 Rrs was approximately 0.8 times lower than MODIS Rrs. The possible reasons for this difference were time difference (1 day) between CASI-1500 and MODIS data, higher land adjacency effect for MODIS-Aqua than for CASI-1500, and possible errors in MODIS Rrs from Polymer.
Removing atmospheric effects for multi spectral images (OLI 8) using ATCOR model
[J].
DOI:10.1088/1757-899X/757/1/012072
[本文引用: 1]
The atmospheric correction of satellite images is an important first step for different remote sensing applications such as estimation of vegetation indices. In atmospheric corrections, most uncertainties arise from temporal and spatial variations in aerosol types and quantities. Thus, considered validation estimate Aerosol is an essential step in the validation atmospheric correction algorithms. In the current study, two models of atmospheric correction algorithms ATCOR (ATCOR 3 and ATCOR 2) were applied to remove atmospheric effects of test sites in Middle part of Iraq. Statistical results of ATCOR 2 was shown to be successful in the urban parts to remove effective type of aerosol which could be chosen to process satellite images in areas under investigation.
基于波谱匹配的Hyperion数据大气校正方法对比研究
[J].
Comparative study on atmospheric correction methods of Hyperion data based on spectral matching
[J].
Comparison of ATREM,ACORN,and FLAASH atmospheric corrections using low-altitude AVIRIS data of Boulder,CO
[J/OL].
Evaluation of atmospheric corrections on hyperspectral data with special reference to mineral mapping
[J].DOI:10.1016/j.gsf.2016.06.004 URL [本文引用: 1]
WorldView-3卫星影像大气校正方法应用对比研究
[J].
Comparison research on the application of atmospheric correction methods for WorldView-3 satellite imagery
[J].
哈密遥感地质资源评价综合应用野外试验场建设进展
[J].
Progress in construction of remote sensing and geological test field for comprehensive application and resources evaluation in Hami,Xinjiang
[J].
国内外遥感试验场建设进展
[J].
Introduction of the remote sensing test field site construction progress at home and abroad
[J].
Atmospheric correction of spectral imagery:Evaluation of the FLAASH algorithm with AVIRIS data
[C]//
Evaluation of atmospherically gases using models FLAASH and QUAC to hyper-spectral imagery
[J].
基于模拟多光谱遥感影像的大气校正方法比较研究
[J].
Comparison of atmospheric correction methods based on simulated multi-spectral remote sensing images
[J].
Urban house fetection using SAM and SIFT on hyperspectral remote sensing images
[J].
DOI:10.1088/1742-6596/1237/3/032029
[本文引用: 1]
The detection and identification of urban object targets have always been a research hotspot. In recent years, the spectral, spatial and temporal resolution of remote sensing images have been continuously increased, making hyperspectral remote sensing images widely used in urban object recognition. We proposed a new method for urban house detection by combining the spectral mapping results and spatial features. Firstly, the target spectral information is used to distinguish the targets in spectral domain. Then, the spatial SIFT feature algorithm is used on the results of spectral mapping, which can improve the accuracy of urban housing target recognition.
