

0 引言
联合国政府间气候变化专门委员会(intergovernmental panel on climate change,IPCC)发布的第六次评估报告第三工作组报告显示[1],1850年以来二氧化碳(CO2)累积净排放总量持续增加,2010—2019年全球温室气体(greenhouse gas,GHG)年均排放量达到人类历史最高水平。在现有计划的化石燃料基础设施服役期限内,若不额外减排,将无法完成全球温升控制在1.5 ℃以内的目标。抑制全球气候变化、减少CO2排放刻不容缓。能源生产和消费相关活动会产生大量CO2[2],我国化石能源碳排放约占总排放量80%以上[3],是当前世界上最大的CO2排放国[4]。为应对CO2增加导致气候变化和生态环境恶化的问题,我国明确提出2030年前碳达峰、2060年前碳中和的目标[5],大力推动能源领域碳减排,以加快构建现代能源体系[2]。太阳能清洁无污染、取用不竭,被认为是未来最具价值的能源之一[6]。
太阳能资源的评估是其开发利用的重要条件,国内外学者对太阳能资源的时空分布特征、变化趋势和开发潜力等方面进行了大量研究[7⇓⇓-10]; 太阳能资源的开发与利用主要包括光伏开发适宜性分析[11⇓⇓-14]、光伏电站的选址研究[15-16]和光伏发电潜力评估[17-18]等方面。其中,光伏开发适宜性分析是光伏电站建设的基础性工作[13],而光伏发电潜力评估有利于能源政策制定和光伏产业的健康发展[18]。同时,相关研究表明,光伏发电有利于建设地区节能减排[19-20]。2021年9月底,我国累计光伏装机容量为2.78亿kW,发电为2 486亿kWh[21]。然而,在光伏产业迅速发展的同时,盲目建设电站问题日渐显现,如何选择合适的光伏电站厂址成为光伏开发的重要问题。
国外关于光伏开发适宜性的研究较多,评价指标主要包括气象、地形、位置、植被和人文等方面[11,14,22-23],而国内研究多集中于气象、地形和位置等[13,20],较少把植被、河流和保护区距离等作为评价指标。不同评价指标采用的数据有所不同,遥感数据具有时间序列长、覆盖范围广和成本低等优势[24],已有文献将其作为评价指标进行光伏开发相关研究[11,13,20]。此外,光伏电站多建设在地形平坦的区域,忽视了发电潜力较高的山区和丘陵地带[25],同时随着光伏电站装机规模不断增加,太阳能资源丰富、地形平坦和地理位置等优越的土地资源不断减少[26]。《四川省“十四五”能源发展规划》[27]强调重点推进三州一市光伏发电基地建设,“十四五”期间拟新增太阳能发电1 000万KW以上。鉴于此,本研究以川西高原为研究区,通过构建光伏开发适宜性评价指标体系,评估光伏开发适宜性区域,进而估算川西高原光伏发电潜力和减排效应。
1 研究区概况及数据源
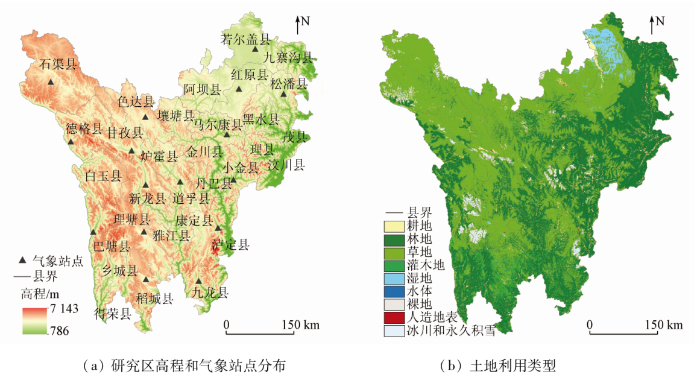
1.1 研究区概况
图1
1.2 数据来源及处理
1)遥感数据。整体水平辐照数据 (global horizontal irradiance, GHI)来自Global Solar Atl-as 2.0 (
3)基础地理要素数据。道路、居民点、河流和保护区数据来源于1∶100万全国基础地理数据库(全国地理信息资源目录服务系统,
4)地形数据。DEM(digital elevation model)数据来自地理空间数据云平台(
5)社会经济数据。2019年四川省电力消费来自四川省统计年鉴[32]。
本研究所使用的数据(DEM,GHI和NDVI等)均经过投影变换、裁剪、重采样等数据处理,地理参考为WGS_1984_UTM_zone_47N,空间分辨率统一为500 m×500 m。
1.3 评价指标选取
光伏电站建设受到诸多因素影响,选取气象、地形、位置和植被作为一级指标,进一步将一级指标分为若干二级指标。气象指标包括太阳辐射、气温、日照时数和降水量4个二级指标。太阳辐射是评价光伏开发适宜性的重要指标,直接决定了光伏电站的发电量。日照时数会影响太阳能资源稳定度。气温和降水量间接影响太阳辐射,从而降低电站发电效率。地形分为坡度和坡向2个指标。坡度、坡向对太阳辐射和日照时数产生很大影响,川西高原位于北半球,南向和平面所获取的太阳辐射值较大,坡度和海拔高低则会影响建设成本和运维难度。居民点距离、河流距离、道路距离和保护区距离属于位置指标。距居民点距离越近,越靠近消费市场,可减少电力运输成本和运输带来的电力损耗。光伏电站运行中,太阳能电池表面尘埃会降低光伏电站工作效率[13],定期对光伏电站表面清洗耗水量较大,故河流距离越近越好。道路距离则影响光伏电站前期修建以及后期运营维护。作为我国西部重要的生态屏障,川西高原各类自然保护区50余处,是四川省重要的生态保护红线区[33]和旅游开发胜地[34],光伏电站建设应避开保护区位置。NDVI为植被的二级指标,NDVI大小表示研究区植被覆盖度情况。NDVI值范围在[-1,1]之间,小于或等于0,代表无植被覆盖; 值越接近1,植被覆盖度越高。光伏电站的建设宜选择植被覆盖度低的地区,以保护川西高原的生物多样性。
2 研究方法
2.1 层次分析法
式中: Pij为第i个指标相对于第j个指标的重要性程度判断值; Pji=1/Pij(i,j=1,2,…,n); n为指标个数。若i=j, Pij=Pji=1。
采用特征值法求解最大特征根及特征向量,再对判断矩阵进行一致性检验,公式为:
式中: CR为一致性比率; RI为随机一致性指标(表1) ; CI为一致性指标; λmax为最大特征根。若CR<0.1,表示通过一致性检验,对特征向量归一化处理得到指标权重,否则需对判断矩阵进行修正。
本研究运用层次分析法对一、二级指标构建判断矩阵,最终得到各指标的权重(表2)。
表2 研究区光伏开发适宜性评价指标及其权重
Tab.2
| 目标层 | 一级指标 | 权重Wk | 二级指标 | 权重Wkl |
|---|---|---|---|---|
| 光伏 开发A | 气象A1 | 0.55 | 太阳辐射A11 | 0.51 |
| 气温A12 | 0.15 | |||
| 日照时数A13 | 0.26 | |||
| 降水量A14 | 0.08 | |||
| 地形A2 | 0.23 | 坡度A21 | 0.67 | |
| 坡向A22 | 0.33 | |||
| 位置A3 | 0.14 | 道路距离A31 | 0.28 | |
| 居民点距离A32 | 0.50 | |||
| 保护区距离A33 | 0.15 | |||
| 河流距离A34 | 0.07 | |||
| 植被A4 | 0.08 | NDVI A41 | 1.00 |
2.2 太阳能资源稳定度计算
式中: K为太阳能资源稳定度; max()和min()表示最大和最小值的标准函数;Day1,Day2,…,Day12分别为1—12月各月日照大于6 h的天数。
表3 太阳能资源丰富程度分级
Tab.3
| 年总辐射量/(kWh·m-2) | 分级 | 分级编号 |
|---|---|---|
| ≥1 750 | 最丰富 | Ⅰ |
| [1 400,1 750) | 很丰富 | Ⅱ |
| [1 050,1 400) | 较丰富 | Ⅲ |
| <1 050 | 一般 | Ⅳ |
表4 太阳能资源稳定程度分级
Tab.4
| 太阳能资源稳定度指标 | 稳定程度 |
|---|---|
| <2 | 稳定 |
| [2,4] | 较稳定 |
| >4 | 不稳定 |
2.3 光伏开发适宜性计算
式中: S为光伏开发适宜性指数; Wk为第k个一级指标的权重(k=1,2,…,r); r为一级指标个数; Wkl为第k个一级指标下第l个二级指标的权重(l=1,2,…,s); s为一级指标下二级指标个数; Gkl为第k个一级指标下第l个分级后的二级指标。
2.4 光伏发电潜力估算
发电潜力评估是光伏电站建设前的重要环节,计算公式为[20]:
SEGP=ASR SA AF PE (1-LO) (1-AP),
式中: SEGP为光伏发电潜力,KWh; ASR为年平均太阳总辐射,kWh·m-2; SA为适合光伏开发的占地面积,m2; AF为面积因子,表示区域内太阳能可利用比例,本研究取值为0.35; PE为电池板的发电效率,光伏板的种类会影响总能量的输出,本研究采用多晶硅光伏板发电效率,取值为16.5%; LO为损耗率,本研究取值为7.5%[40]; AP为弃光率,本研究取值为3% (
2.5 CO2减排潜力估算
本研究不考虑光伏电站生命周期其他阶段(光伏部件制造和建设等)的影响,采用光伏发电潜力作为发电量估算CO2减排潜力[41],公式为:
C=SEGP EF,
3 结果与分析
3.1 太阳能资源分析
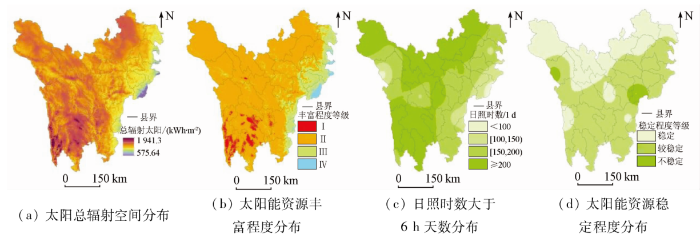
川西高原各县年太阳总辐射多年平均值在575.64~1 941.3 kWh/m2之间(图2(a)),年辐射值在1 400 kWh/m2以上的有乡城县、得荣县和理塘县等25个县,其中乡城县年总辐射量最大1 675 kWh/m2。川西高原太阳能资源丰富程度(图2(b))大致呈现出西高东低的特点,理塘县、巴塘县和稻城县等县为太阳能资源最丰富地区。资源很丰富地区分布范围较广,包括川西高原西部、北部和南部大部分地区,资源较丰富和不丰富地区主要分布在川西高原东部。年内日照时数大于6 h的天数统计结果表明(图2(c)),川西高原除德格县西部和汶川县东部以外,日照时数大于6 h的天数均在100 d以上,其中北部、西北部以及西南部地区大于200 d。川西高原太阳能资源稳定程度分布中(图2(d)),不稳定区域位于德格县西部和小金县东部,北部为稳定地区,其余地区为较稳定地区,分布范围最广。
图2
3.2 评价指标分级及分布规律
川西高原太阳辐射分级整体上表现为西部高于东部的空间分布特征(图3(a)),西南部的理塘县、雅江县、稻城县、巴塘县一带和北部的石渠县、色达县、甘孜县、若尔盖县分级高。太阳辐射分级较低区主要分布在川西高原东部,包括泸定县、汶川县、茂县东南部、松潘县东部和九寨沟县。川西高原气温(图3(b))和降水量(图3(c))指标分级呈东南向西北逐渐增加的趋势。日照时数(图3(d))总体分级较高,但分布不均匀。理塘县中部、稻城县北部、乡城县东北部、理塘县与雅江县交界处以及石渠县北部日照时数长,分级高。而川西高原东部和德格县西部等10个县域日照时数较短,属于低分级区,其中日照时数最短地区出现在汶川县东南部。坡度(图3(e))分级较高区域主要分布在川西高原东北部的红原县和若尔盖县一带的沼泽化高平原、石渠县和色达县丘状高原、巴塘县、白玉县和理塘县交界处的沙鲁里山丘状高原以及康定县西部丘状高原等地区,其余地区坡高谷深,分级较低。川西高原位于北半球,坡向指标分级(图3(f))南方向和平面所对应的指标分级最大,北方向对应的分级最小。道路距离(图3(g))、居民点距离(图3(h))和河流距离分级(图3(i))都较密集,差别较小。川西高原保护区较多,大部分地区离保护区位置近,分级较低 (图3(j))。NDVI分级较高的区域(图3(k))多分布在高海拔区域,包括石渠县东北部和西南部、德格县中部、甘孜县南部、新龙县与白玉县交界边缘、理塘县与巴塘县交界处、康定县南部、黑水县与红原县交界处、松潘县东部、九寨沟县南部以及小金县、理县和汶川县的交界地带。而分级较低区域多出现在海拔3 000 m以下的东部和南部地区,主要分布在泸定县东部、丹巴县东部、雅江县中部、九寨沟县东部、若尔盖县西南部以及大渡河、雅砻江和岷江流域。总体而言,各二级评价指标空间分布特征差异明显。
图3
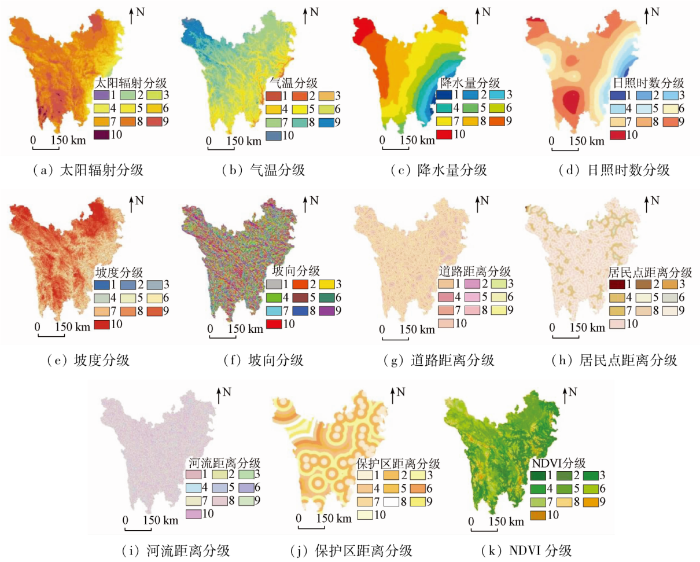
图3
研究区光伏开发适宜性评价二级指标分级(图例数字代表分级序数)
Fig.3
Classification of the secondary indicators of photovoltaic development suitability analysis in the study area
3.3 光伏开发适宜性分析
剔除限制区后,光伏开发适宜性评估区域占川西高原总面积的57.43%,光伏开发适宜性指数范围在(3.64,9.26)之间,主要表现为西高东低的空间分布特征。依据等间隔距离法将该指数划分为低适宜(3.64,4.76]、较低适宜(4.76,5.89]、适宜(5.89,7.01]、较高适宜(7.01,8.13]和高适宜(8.13,9.26)5级(图4)。低适宜区面积约占研究区总面积的0.10%,较低适宜区面积约占研究区总面积的1.29%。低适宜区和较低适宜区分布相对较少,主要分布在川西高原东部边缘各县域; 适宜区、较高适宜区面积占比分别为7.65%和39.43%,适宜区分布范围最广,在川西高原各县均有分布。较高适宜区面积占比最大,分布范围包括川西高原中部、西部、西北部和北部地区,其中,石渠县较高适宜区面积最大; 高适宜区面积约2.07×10⁴ km2,面积占比为8.96%,主要分布在川西高原西南和西北地区,西南部包括理塘县、稻城县北部、雅江县西北部、乡城县和巴塘县部分地区,西北部为石渠县、色达县和甘孜县,东北部若尔盖县分布较多,其他县域也有少量分布。石渠县高适宜区面积最大,理塘县次之(图5)。高程限制区涉及理塘县西部、巴塘县中部、泸定县和康定县交界处、石渠县西南部、德格县中部和甘孜县南部; 土地覆盖限制区主要分布在川西高原东部、南部和西部部分县域。
图4
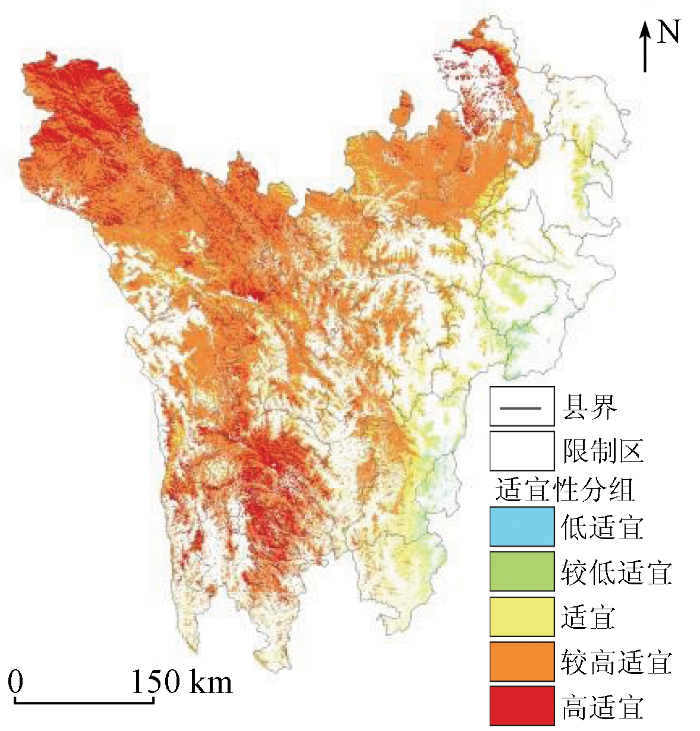
图4
研究区光伏开发适宜性分级
Fig.4
Classification of photovoltaic development suitability of the study area
图5
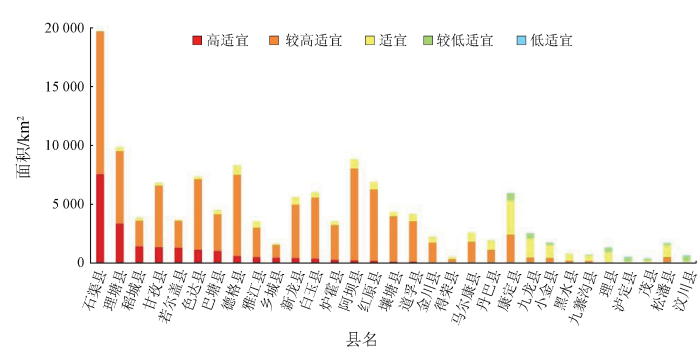
图5
研究区不同县域光伏开发适宜性分级面积
Fig.5
Photovoltaic development suitability classification area in different counties of the study area
高适宜区光伏开发优势明显,是最佳光伏电站建设场所,区内植被覆盖度较低,土地利用类型主要以草地为主,用地成本较低,年太阳总辐射在1 300 kWh/m2以上,年日照时数高于1 500 h,保障了发电量和发电效率,坡度相对缓和,位于0~33.92°之间,有利于大规模集中式光伏电站建设,距居民点和道路距离适中有利于降低建设和运维成本,河流距离较近保证充足水源对光伏电站表面定期清洗,同时避开了保护区位置。较高适宜区和适宜区用地类型主要为草地,年太阳总辐射较强(869 kWh/m2以上),年日照时数较长(1 000 h),坡度较为平缓,距居民点、主要道路、河流以及保护区距离较为适中,光伏开发的优势较为明显。较低适宜区和低适宜区,年总太阳辐射和平均日照时数条件相对较差,坡度较陡,不适宜大规模光伏建设,距居民点和主要道路距离较远增加了光伏建设成本,河流距离较远、保护区距离太近对光伏表面清洁以及研究区生态保护造成一定影响。
3.4 发电潜力和减排效应分析
川西高原光伏发电潜力整体上西部高于东部地区,高适宜区全部开发情景下发电潜力为17 197.97亿kWh,相当于新型冠状病毒疫情发生前四川省2019年电力消费总量的6.52倍,开发利用15.33%,即可满足2019年四川省的全年用电需求。县域层面(表5),石渠县发电潜力最大,达到6 203.25亿kWh,其次为理塘县,小金县发电潜力较小,为0.38亿kWh。九寨沟县、潘松县和黑水县等东部7个县不具有光伏发电潜力。新型冠状病毒疫情发生前,2019年我国CO2排放总量为97.95 亿t,四川省为3.15亿t [44⇓⇓-47]。高适宜区全部开发情景下CO2减排潜力为12.45亿t(表6),约为我国2019年CO2排放总量的12.71%,是四川省的3.95倍。传统火力发电每发电1 kWh,对应消耗标准煤0.335 kg,同时排放二氧化硫(SO2)0.03 kg、炭粉灰0.272 kg、氮氧化物(NOX)0.015 kg[48]。川西高原高适宜区光伏资源100%开发利用情景下(表7),可节约5.76亿t标准煤,减排炭粉灰4.68亿t,SO20.52亿t和NOX0.26亿t; 参考卢霞[48]对荒漠戈壁区光伏电站建设重金属减排效应的研究,川西高原高适宜区多晶硅电池板重金属As,Cr,Pb,Hg,Ni,Cd减排量分别约为2 875.50 t,6 902.41 t,7 441.56 t,83.41 t,8 061.89 t和114.8 t(表8)。
表5 各县高适宜区光伏发电潜力 (亿kWh)
Tab.5
| 县名 | 发电潜力 | 县名 | 发电潜力 | |
|---|---|---|---|---|
| 石渠县 | 6 203.25 | 炉霍县 | 230.61 | |
| 理塘县 | 2 886.88 | 阿坝县 | 191.06 | |
| 稻城县 | 1 218.30 | 红原县 | 166.31 | |
| 甘孜县 | 1 114.34 | 壤塘县 | 107.74 | |
| 若尔盖县 | 1 092.23 | 道孚县 | 103.93 | |
| 色达县 | 943.05 | 金川县 | 24.48 | |
| 巴塘县 | 884.99 | 得荣县 | 20.09 | |
| 德格县 | 481.37 | 马尔康县 | 17.90 | |
| 雅江县 | 431.86 | 丹巴县 | 16.96 | |
| 乡城县 | 383.20 | 康定县 | 9.09 | |
| 新龙县 | 362.06 | 九龙县 | 1.14 | |
| 白玉县 | 306.76 | 小金县 | 0.38 |
表6 高适宜区不同开发强度情景下发电潜力和CO2减排潜力
Tab.6
| 开发比例/% | 发电潜力/亿kWh | CO2/亿t |
|---|---|---|
| 100 | 17 197.97 | 12.45 |
| 75 | 12 898.48 | 9.34 |
| 50 | 8 598.99 | 6.23 |
| 25 | 4 299.49 | 3.11 |
表7 高适宜区不同开发强度情景下煤炭与常规污染物减排潜力 (亿t)
Tab.7
| 开发比例/% | 标准煤 | 炭粉灰 | SO2 | NOX |
|---|---|---|---|---|
| 100 | 5.76 | 4.68 | 0.52 | 0.26 |
| 75 | 4.32 | 3.51 | 0.39 | 0.19 |
| 50 | 2.88 | 2.34 | 0.26 | 0.13 |
| 25 | 1.44 | 1.17 | 0.13 | 0.06 |
表8 高适宜区不同开发强度情景下重金属减排潜力 (t)
Tab.8
| 开发 比例/% | As | Cr | Pb | Hg | Ni | Cd |
|---|---|---|---|---|---|---|
| 100 | 2 875.50 | 6 902.41 | 7 441.56 | 83.41 | 8 061.89 | 114.8 |
| 75 | 2 156.63 | 5 176.81 | 5 581.17 | 62.56 | 6 046.42 | 86.1 |
| 50 | 1 437.75 | 3 451.20 | 3 720.78 | 41.71 | 4 030.95 | 57.4 |
| 25 | 718.88 | 1 725.60 | 1 860.39 | 20.85 | 2 015.47 | 28.7 |
4 讨论与结论
4.1 讨论
川西高原发电潜力巨大,预期节能减排效果显著。然而,光伏开发挑战与机遇并存。川西高原属于少数民族地区,人口少,电力供过于求,容易产生电力消纳问题。此外,川西地区电网及其配套设施薄弱,电力输送困难。《四川省“十四五”能源发展规划》 [27]提出“优化布局三州一市送出通道,实施 500 kV输变电加强工程”的重要部署。规划实施有望促进川西能源基础设施建设,进而缓解东部电力紧张问题,促进川西地区融入东部地区经济发展。同时,光伏发电存在间歇性、波动性和发电不稳定的缺点。近年来,中央和各级地方政府颁布了一系列利好政策,包括建设抽水蓄能电站、优化电力调度机制等[27]。将推动川西高原光伏产业快速发展,有望弥补光伏发电的不足。
已有研究表明,大规模建设光伏电站会对自然环境[50]、生物多样性[51]和气候[52-53]等方面造成一定的影响,其影响存在于光伏电站不同生命阶段(建设、运行、报废) [54]。翟波等[51]认为草原地区光伏电站的建设会影响当地自然环境和植物群落特征; 而王涛等[55]认为光伏板的遮阴作用有利于耐荫性植物生长。光伏电站的布设也可以增加相对湿度、改变风向、降低风速和土壤温度等[52]。川西高原生态环境脆弱,如何在不破坏生态环境的情况下建设光伏电站?光伏电站建设对地表、植被和区域小气候会产生怎样的影响?其影响是正向还是负向?亟待解决。此外,居民态度、变电站距离、技术等其他因素在一定程度上也会影响光伏电站选址,在今后研究中,需拓展评价指标体系以确保分析结果更加客观合理。
4.2 结论
本研究围绕光伏开发适宜性、发电潜力和减排效应展开相关研究,主要结论如下:
1)川西高原光伏电站建设高适宜区面积约2.07×10⁴ km2,主要分布在川西高原西南和西北地区。石渠县高适宜区面积最大,理塘县次之。高适宜区年太阳总辐射值在1 300 kWh/m2以上,年日照时数高于1 500 h。
2)川西高原发电潜力巨大,高适宜区全部开发情景下发电潜力为17 197.97亿kWh,相当于新型冠状病毒疫情发生前四川省2019年电力消费总量的6.52倍,开发利用15.33%即可满足四川省2019年的全年用电需求。
3)与传统火力发电相比,川西高原高适宜区光伏发电每年潜在CO2减排量为12.45亿t,约为新型冠状病毒疫情发生前我国2019年CO2排放总量的12.71%,是四川省的3.95倍。同时,可节约5.76亿t标准煤,减排炭粉灰4.68亿t,SO20.52亿t,NOX0.26亿t,重金属As,Cr,Pb,Hg,Ni,Cd减排量分别为2 875.50 t,6 902.41 t,7 441.56 t,83.41 t,8 061.89 t,114.8 t。
参考文献
关于完善能源绿色低碳转型体制机制和政策措施的意见(发改能源〔2022〕206号)
[EB/OL].(
Policies and measures to improve the mechanism for a green-oriented transition of energy
[EB/OL].(
“十四五”中国光伏行业绿色低碳发展关键问题分析
[J].
Analysis on key issues of green and low-carbon development in Chinese photovoltaic industry during the 14th Five-Year plan period
[J].
中国实现2030年前碳达峰目标及主要途径
[J].
China’s goal of achieving carbon peak by 2030 and its main approaches
[J].
在第七十五届联合国大会一般性辩论上的讲话
[EB/OL].(
Speech at the general debate of the 75th session of the United Nations General Assembly
[EB/OL].(
中国陆地太阳能资源开发潜力区域分析
[J].
Analysis on mainland China’s mainland’s solar energy distribution and potential to utilize solar energy as an alternative energy source
[J].
Solar radiation changes in the United States during the twentieth century:Evidence from sunshine duration measurements
[J].
DOI:10.1175/JCLI3354.1
URL
[本文引用: 1]

Changes in sunshine duration (SS) measured in the conterminous United States during the past century were used as a proxy to explore changes in shortwave forcing at the earth’s surface when and where accurate measurements of global irradiance (Eg) were not available. Yearly totals of SS from the 106 Weather Bureau stations with 70 or more years of complete measurements between 1891 and 1987 were analyzed after establishing that the two changes in instrumentation during that period had not significantly influenced the measurements. Annual totals of SS were highly correlated (r2 = 0.86) with annual totals of global irradiance (Eg↓) measured at the 26 U.S. pyranometer stations during the 1977–80 period when the Solar Radiation Network (SOLRAD) was operating at its maximum accuracy. The linear relationship between annual totals of Eg↓ and SS was highly significant (P < 0.001), with each additional hour of sunshine duration equivalent to an increase of 0.0469 ± 0.002 W m−2 (or 1.48 ± 0.07 MJ m−2 solar radiation per year). The error term of annual values of Eg↓ estimated from SS was 5%.
First effort for constructing a direct solar radiation data set in China for solar energy applications
[J].DOI:10.1002/jgrd.v123.3 URL [本文引用: 1]
High-resolution assessment of solar radiation and energy potential in China
[J].DOI:10.1016/j.enconman.2021.114265 URL [本文引用: 1]
1990—2019年中国北方沙区太阳能资源评估
[J].
DOI:10.7522/j.issn.1000-0534.2021.00058
[本文引用: 1]
沙漠地区太阳能资源丰富且地表植被稀疏, 非常适于太阳能资源开发。然而目前针对中国北方沙漠地区太阳能资源的评估仍然较少。本研究利用中国北方沙区(含沙漠、 沙地、 戈壁和盐碱地)46个太阳辐射站和189个常规气象站数据, 基于极端梯度提升算法(xgboost)估算了太阳总辐射量, 分析了总辐射量年、 季和月的时空分布并进行太阳能资源评估。结果表明, 中国北方沙区1990 -2019年平均日照时数和太阳总辐射量为2927.90 h和5888.39 MJ·m<sup>-2</sup>, 且以分别以22.48 h·(10a)<sup>-1</sup>和8.66 MJ·m<sup>-2</sup>·(10a)<sup>-1</sup>的速率减少, 但这种趋势并不显著(p>0.05)。日照时数和太阳总辐射量空间分布呈现出东西低中部高的特点, 青海和甘肃河西的沙区总辐射量最高, 在6300 MJ·m<sup>-2</sup>以上, 东北地区的沙地总辐射量最低, 不足5300 MJ·m<sup>-2</sup>。季节变化表现为夏季太阳总辐射量最大, 春季次之, 秋冬季最低。总体上看, 青海和河西走廊西部沙区太阳能资源丰富, 其他沙区较丰富, 但就太阳能资源稳定度而言, 仅青海、 河西走廊南部沙区为较稳定, 其他沙区为欠稳定或一般。因此, 青海和甘肃河西沙区太阳能资源开发潜力最大, 应加大对该区太阳能资源的开发投入, 提高区域经济发展水平, 改善沙区生态环境。
Evaluation to the solar energy resources in the sandy regions of northern China from 1990 to 2019
[J].
DOI:10.7522/j.issn.1000-0534.2021.00058
[本文引用: 1]
The solar radiation, as a kind of clean energy, is increasingly being developed in recent years under the background of energy crisis and global climate warming.An evaluation of the spatial patterns and storage of solar energy is of great importance for potential solar energy resources development.The deserts in northern China are characterized by abundant solar energy resources and sparse vegetation cover, which are very suitable for solar energy resources development.However, as the number of solar radiation observation stations in sandy regions of northern China is very limited, dedicated evaluation to solar energy resources in the sandy regions of northern China is still characterized by large uncertainties.In this study, data from 46 solar radiation stations and 189 common weather stations in the sandy regions (including deserts, sandy lands, Gobi, and salinity lands) of northern China were employed to estimate the global solar radiation based on a high-efficient machine learning model, i.e., the xgboost algorithm.The solar resources were assessed by analyzing the spatiotemporal patterns of annual, seasonal, and monthly radiation.The results showed that the average sunshine duration and global solar radiation from 1990 to 2019 are 2927.90 h and 5888.39 MJ·m<sup>-2</sup>, respectively.The average decreasing rates of sunshine hours and solar radiation over the past thirty years were 22.48 h·(10a)<sup>-1</sup> and 8.66 MJ·m<sup>-2</sup>, respectively, which were not significant at the 0.05 level.The spatial patterns of sunshine duration and total solar radiation were characterized by higher values occurring in the middle parts while lower values in the east and west parts of northern China.The radiation was maximal in the deserts of Qinghai and Hexi Corridor with values higher than 6300 MJ·m<sup>-2</sup>, while minimum in the sandy lands of Northeast China with values less than 5300 MJ·m<sup>-2</sup>.The solar radiation was maximal in summer, followed by spring, and the lowest in autumn and winter.Generally, solar energy in deserts of the Qinghai and west Hexi Corridor were ranked as the most abundant level, while other sandy regions were very abundant level.However, in terms of the stability of solar energy, only deserts in the Qinghai and the southern Hexi Corridor were ranked as a relatively stable level, and other sandy regions are fewer stable levels.Therefore, the potential of solar energy resources in the sandy regions of Qinghai and Hexi Corridor was maximal, and should be given priority in terms of solar resources development, to promote the regional economic development and further improve the ecological environment of sandy regions.
Evaluation of natural conditions for site selection of ground-mounted photovoltaic power plants in Serbia
[J].DOI:10.1016/j.energy.2017.03.140 URL [本文引用: 5]
A GIS-AHP combination for the sites assessment of large-scale CSP plants with dry and wet cooling systems.Case study:Eastern Morocco
[J].DOI:10.1016/j.solener.2018.03.038 URL [本文引用: 2]
基于遥感数据和多因子评价的中国地区建设光伏电站的适宜性分析
[J].
DOI:10.12082/dqxxkx.2018.170393
[本文引用: 6]
中国属于太阳能资源丰富的国家之一,光伏装机量位居世界第一,未来其装机量仍会不断增加。本文拟利用遥感技术获取区域太阳能资源的时空分布,采用多因子评价模型对中国地区大型光伏电站区域适宜性进行评估,以期为光伏电站的选址提供科学依据。结合太阳总辐射、日照时数的稳定程度、离路网的距离、离城镇的距离和坡向5个因子,通过设定海拔以及土地覆盖类型对应的限制区域,利用MuSyQ辐射产品、DEM、道路网数据、VIIRS夜间灯光数据、土地覆盖产品得到因子图层,使用层次分析法确定各因子在模型中的权重,借助GIS进行叠加分析并分为“低适宜”、“较适宜”、“适宜”、“非常适宜”和“限制区”5类,得到光伏电站建设的空间适宜性分布。研究结果表明,西北地区的适宜区占全国的53.0%,“非常适宜”区占全国的47.3%,其累计光伏电站装机量占全国的45.6%。建设光伏电站的“适宜”和“非常适宜”区面积的大小与装机量的多少没有明显的线性关系。“非常适宜”区作为光伏电站的最佳建设场所,光伏发电潜力大于2016年全国发电量的5倍。同时,国家政策制定的装机规模指标以及光电补贴政策对光伏电站的选址也起了一定的指向作用。
Suitability analysis of photovoltaic power plants in China using remote sensing data and multi criteria evaluation
[J].
A geographical information system-based multi-criteria method for the evaluation of solar farms locations:A case study in Souss-Massa area,southern Morocco
[J].
DOI:10.1016/j.energy.2019.06.063
[本文引用: 2]
It is now well established that solar energy is a reliable alternative way to reduce greenhouse gas emissions and to mitigate climate change effects. In Morocco, solar energy investments are rapidly rising since 2009 and are expected to grow dramatically in the next decade. Site selection is a critical issue when large-scale solar plants are being planned. In this paper, the multi-criteria evaluation method is used to identify suitable sites to host Photovoltaic projects in southern Morocco. For this purpose, geographical information systems and analytic hierarchy process methods were combined to represent a high-resolution map that compares the potential of the studied region to host large-scale Photovoltaic projects. HOMER software was then used for modeling and simulating a 10 MW grid-connected PV system. The optimum scheme is analyzed to assess the economic feasibility in the most suitable site in the Souss-Massa region. The findings from this study confirm that 24.08% of the studied area offers suitable sites to host the Photovoltaic farms. The HOMER simulation has clearly shown that the grid connected Photovoltaic system is beneficial in the long run, although its initial capital is higher than the grid supply only. Also, the cost of electricity generated from Photovoltaic panels is affordable. (C) 2019 Elsevier Ltd.
Comparative TOPSIS-ELECTRE TRI methods for optimal sites for photovoltaic solar farms.Case study in Spain
[J].DOI:10.1016/j.jclepro.2016.04.005 URL [本文引用: 1]
Selecting photovoltaic generation sites in Tibet using remote sensing and geographic analysis
[J].DOI:10.1016/j.solener.2016.03.069 URL [本文引用: 1]
Spatial matching of large-scale grid-connected photovoltaic power generation with utility demand in Peninsular Malaysia
[J].DOI:10.1016/j.apenergy.2017.01.087 URL [本文引用: 1]
Potential assessment of photovoltaic power generation in China
[J].DOI:10.1016/j.rser.2021.111900 URL [本文引用: 2]
Assessment of geographical distribution of photovoltaic generation in China for a low carbon electricity transition
[J].DOI:10.1016/j.jclepro.2018.12.045 URL [本文引用: 1]
京津冀地区光伏开发空间适宜性及减排效益评估
[J].
DOI:10.11821/dlxb202203012
[本文引用: 4]
京津冀地区作为中国重要的能源消费基地,近年在产业转型与发展中对清洁能源的需求不断增加。光伏发电是中国“十四五”期间加速能源结构转型,早日实现碳中和目标的关键举措与重要抓手。本文以京津冀为研究区,通过构建“地形—气象—成本”光伏开发适宜性综合评价指标体系,计算了光伏开发适宜性指数,刻画出京津冀地区2018年光伏开发适宜性的空间格局特征,进而定量评估不同开发适宜性情景下光伏发电潜力与减排效益。研究表明:① 京津冀地区光伏开发适宜区占到区域总面积的22%,一般适宜区面积最广,“燕山—太行山”一线是适宜区与不适宜区的主要分界线,各类适宜区主要分布在承德、张家口和保定市3个市。 ② 京津冀地区光伏发电发展潜力巨大,开发非常适宜区和较适宜区的年发电潜力是2018年京津冀地区电力消耗的3倍。③ 光伏发电节能减排效果显著。在将非常适宜区和较适宜区全部开发情景下碳减排量为京津冀2018年排放量的47%。④ 土地利用限制、大型输电网络和储能系统是制约光伏发展的主要因素。总体来看,虽然大规模光伏开发仍存在一定的限制条件与技术瓶颈,但在全球气候变化加剧和社会经济发展进入“低碳脱碳”新常态的背景下,京津冀地区的大规模光伏开发仍是助力区域早日实现碳中和目标、优化能源结构和提升人民福祉的重要途径。
Evaluation of suitability and emission reduction benefits of photovoltaic development in Beijing-Tianjin-Hebei region
[J].
DOI:10.11821/dlxb202203012
[本文引用: 4]
As a fundamental energy consumption base in China, the Beijing-Tianjin-Hebei (BTH) region has experienced an increasing demand for clean energy in recent years. Photovoltaic power generation is a key for accelerating the transformation of energy infrastructure in China and achieving the goal of carbon neutrality during the 14th Five-Year Plan period (2021-2025). Taking the BTH region as a study area, we construct a comprehensive evaluation index system of "terrain-weather-cost" to calculate a photovoltaic development suitability index. We subsequently analyze the spatial pattern characteristics of photovoltaic development suitability in the study area in 2018 and quantitatively examine power generation potential and emission reduction effect under different scenarios of photovoltaic development suitability. Results indicate that: (1) The suitable areas for photovoltaic development account for 22% of the total area of this region, and the largest portion of this area is moderately suitable for photovoltaic development. The "Yanshan-Taihang mountains" line geographically divides the areas that are suitable and unsuitable for photovoltaic development, and a range of potential areas are distributed in prefecture-level cities of Chengde, Zhangjiakou and Baoding. (2) Photovoltaic power generation in the BTH region has great potential. Specifically, the annual power generation potential of the extremely and highly suitable areas is about three times more than the total power consumption in the same year of 2018. (3) The energy-saving and emission reduction effects of photovoltaic power generation are remarkable. If the extremely and highly suitable areas are used for photovoltaic development, there will be an approximate 47% reduction in carbon emissions across the whole region, according to the data of 2018. (4) Despite being restricted by limited land resources and the absence of an advanced transmission network or energy storage system, large-scale photovoltaic development is still a viable solution to energy supply issues. It still improves energy infrastructure, achieves the goal of carbon neutrality, and enhances the well-being of citizens in the context of global climate change and the new low-carbon economy.
国家能源局2021年四季度网上新闻发布会文字实录
[EB/OL].(
Transcript of the online press conference of the National Energy Administration in the fourth quarter of 2021
[EB/OL].(
Optimization solar site selection by fuzzy logic model and weighted linear combination method in arid and semi-arid region:A case study Isfahan-IRAN
[J].DOI:10.1016/j.rser.2015.07.014 URL [本文引用: 1]
Analysis of insolation potential of Knjaževac Municipality (Serbia) using multi-criteria approach
[J].DOI:10.1016/j.rser.2015.11.056 URL [本文引用: 1]
尺度和密度约束下基于YOLOv3的风电塔架遥感检测方法
[J].
Detection of wind turbine towers in remote sensing based on YOLOv3 model under scale and density constraints
[J].
光伏发电潜力分析——以山西省为例
[J].
The analysis of PV electricity generation potential:A case study in Shanxi
[J].
四川省“十四五”能源发展规划(川府发〔2022〕8号)
[EB/OL].(
The 14th Five-Year plan for energy developent in Sichuan Province
[EB/OL].(
四种气温空间插值方法适用性分析
[J].
Applicability analysis of four spatial interpolation methods for air temperature
[J].
基于空间插值技术的西藏日照时数时空变化特征及其影响因素
[J].
Temporal-spatial change characteristics of sunshine duration in Tibet based on spatial interpolation technique and its influence factors
[J].
川西高原植被NDVI动态变化特征及对气候因子的响应
[J].
Dynamic characteristics of NDVI values and its response to climatic factors in Western Sichuan Plateau
[J].
2000—2015年川西高原植被EVI海拔梯度变化及其对气候变化的响应
[J].
Change of vegetation EVI with altitude gradient and its response to climate change in the Western Sichuan Plateau from 2000 to 2015
[J].
川西高原区农村可持续发展评价
[J].
Evaluation of rural sustainable development in Western Sichuan Plateau area
[J].
Decision making with the analytic hierarchy process
[J].DOI:10.1504/IJSSCI.2008.017590 URL [本文引用: 1]
基于地形分布式模拟的四川省太阳能资源评估
[J].
Assessment of solar energy resource in Sichuan based on distributed modeling on rugged terrains
[J].
并网太阳能光伏电站选址研究述评
[J].太阳能光伏发电在能源战略中具有重要地位,太阳能光伏电站位置的选择对发电成本有直接影响,已成为一个亟待解决的重要课题。文中系统阐述了太阳能光伏发电的发展历史及未来趋势,并从并网光伏电站选址的宏观影响因素、微观影响因素以及方法与模型3方面综述了并网光伏电站选址国内外最新的研究进展,并展望了未来的研究重点和发展方向,以期促进中国在该领域的研究,并为政府和企业在太阳能光伏电站选址、建设及长期规划等方面提供参考,达到科学合理建设光伏电站、有效利用太阳能的目的。
Review on optimal site selection for grid-connected solar photovoltaic plants
[J].
Global reduction of solar power generation efficiency due to aerosols and panel soiling
[J].DOI:10.1038/s41893-020-0553-2 [本文引用: 1]
Cost and CO2 reductions of solar photovoltaic power generation in China:Perspectives for 2020
[J].DOI:10.1016/j.rser.2014.07.027 URL [本文引用: 1]
Assessment to China’s recent emission pattern shifts
[J].
China CO2 emission accounts 2016—2017
[J].
DOI:10.1038/s41597-020-0393-y
[本文引用: 1]
Despite China’s emissions having plateaued in 2013, it is still the world’s leading energy consumer and CO2 emitter, accounting for approximately 30% of global emissions. Detailed CO2 emission inventories by energy and sector have great significance to China’s carbon policies as well as to achieving global climate change mitigation targets. This study constructs the most up-to-date CO2 emission inventories for China and its 30 provinces, as well as their energy inventories for the years 2016 and 2017. The newly compiled inventories provide key updates and supplements to our previous emission dataset for 1997–2015. Emissions are calculated based on IPCC (Intergovernmental Panel on Climate Change) administrative territorial scope that covers all anthropogenic emissions generated within an administrative boundary due to energy consumption (i.e. energy-related emissions from 17 fossil fuel types) and industrial production (i.e. process-related emissions from cement production). The inventories are constructed for 47 economic sectors consistent with the national economic accounting system. The data can be used as inputs to climate and integrated assessment models and for analysis of emission patterns of China and its regions.
China CO2 emission accounts 1997—2015
[J].
DOI:10.1038/sdata.2017.201
URL
[本文引用: 1]
China is the world’s top energy consumer and CO2 emitter, accounting for 30% of global emissions. Compiling an accurate accounting of China’s CO2 emissions is the first step in implementing reduction policies. However, no annual, officially published emissions data exist for China. The current emissions estimated by academic institutes and scholars exhibit great discrepancies. The gap between the different emissions estimates is approximately equal to the total emissions of the Russian Federation (the 4th highest emitter globally) in 2011. In this study, we constructed the time-series of CO2 emission inventories for China and its 30 provinces. We followed the Intergovernmental Panel on Climate Change (IPCC) emissions accounting method with a territorial administrative scope. The inventories include energy-related emissions (17 fossil fuels in 47 sectors) and process-related emissions (cement production). The first version of our dataset presents emission inventories from 1997 to 2015. We will update the dataset annually. The uniformly formatted emission inventories provide data support for further emission-related research as well as emissions reduction policy-making in China.
New provincial CO2 emission inventories in China based on apparent energy consumption data and updated emission factors
[J].DOI:10.1016/j.apenergy.2016.03.073 URL [本文引用: 1]
全球首个超高海拔光伏实证项目启动
[EB/OL].(
The world’s first ultra-high altitude photovoltaic demonstration project was launched
[EB/OL].(
Environmental impacts from the solar energy technologies
[J].DOI:10.1016/S0301-4215(03)00241-6 URL [本文引用: 1]
光伏电板对羊草群落特征及多样性的影响
[J].草原地区大规模建设光伏电站会对当地自然环境造成影响,进而影响植物群落特征。本研究以土默特左旗羊草草原为对象,通过对光伏电板下各位置的植被进行调查取样,分析了物种多样性以及当地建群种羊草的生长状况。结果表明:(1)光伏电板下共发现7科13属14种植物,其中羊草广泛分布于光伏电板下方及周围各位置处。(2)光伏电板下物种Patrick丰富度指数、Shannon多样性指数、Pielou均匀度指数、Simpson优势度指数均表现为电板正下方显著高于电板前后檐。(3)电板下羊草的高度、盖度、密度和基径也均表现为电板正下方显著高于电板前后檐,对照组由南向北对应位置的相应指标均无较大变化。(4)电板正下方羊草的生物量显著高于电板前后檐,对照组由南向北的羊草生物量无显著差异。本研究可为草原地区光伏电站的生态恢复提供依据。
Effects of photovoltaic panels on the characteristics and diversity of leymus chinensis community
[J].
大型光伏电站对共和盆地荒漠区微气候的影响
[J].
Effect of large photovoltaic power station on microclimate of desert region in Gonghe basin
[J].
The potential for climate impacts from widespread deployment of utility-scale solar energy installations:An environmental remote sensing perspective
[J].
Discussion on environment impact assessment in the lifecycle of PV systems
[J].DOI:10.1016/j.egypro.2012.01.039 URL [本文引用: 1]
