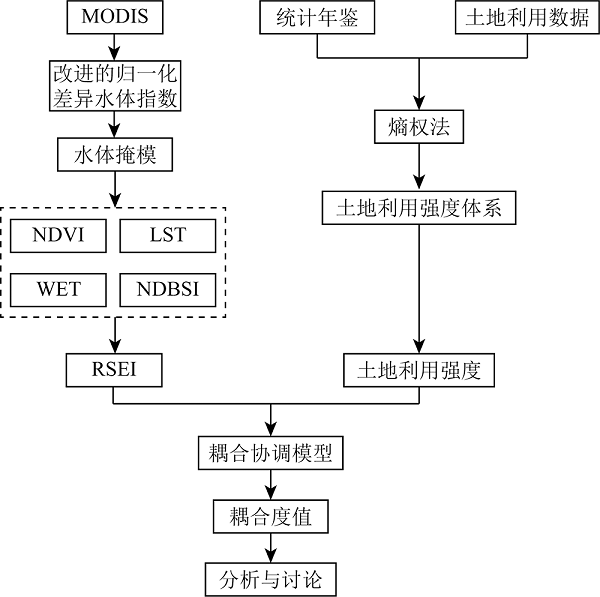
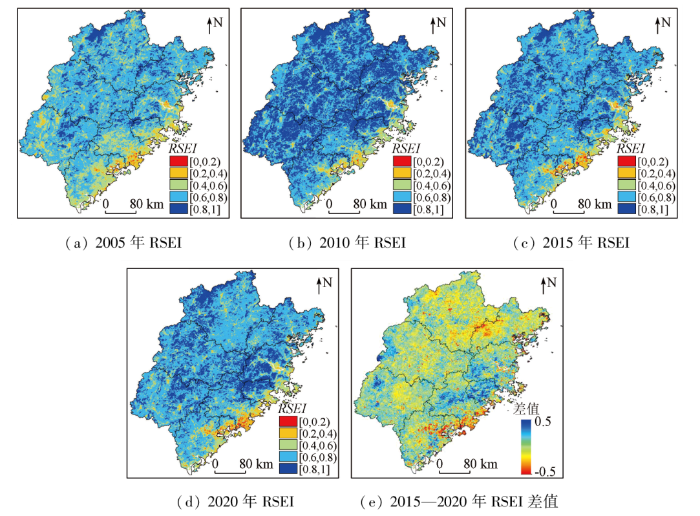
This study aims to explore the origin of the excellent ecology in Fujian Province in the past 15 years. First, a land use intensity system with a five-year time interval was constructed using the 2005—2020 MODIS images and land use data of Fujian as data sources. Then, the coupling relationship between the remote sensing ecological index (RSEI) and land use intensity was analyzed based on a coupled coordination model. Finally, the spatio-temporal evolution analysis was conducted for the ecological health of Fujian from 2005 to 2020. The results show that: ① The ecological environment of Fujian manifested an improvement-degradation-degradation trend, with an average RSEI value of 0.704 8 in 2020, suggesting a sound ecological environment; ② The land use intensity of Fujian displayed an increasing trend, with a growth rate of 26.00%. Most especially, Sanming City demonstrated a maximum increase of 160.91% in land use intensity; ③ The coupled coordination degree of Fujian increased by 0.729 0, suggesting high coordination. All cities in Fujian exhibited increased coupled coordination degrees, except for Xiamen City, where the coupled coordination degree decreased by 0.131 0, implying a slight imbalance. This study fills the gap in the research on the interactions between ecosystem health and land use intensity. It also provides a new perspective for ecological civilization construction and ecosystem health assessment in Fujian and even China.
Keywords:Fujian;
land use intensity;
ecosystem health;
coupled coordination
CAO Delong, TANG Tingyuan, LIN Zhen, XU Zheng, YAN Xu. Coupled assessment and spatio-temporal evolution analysis of ecosystem health in Fujian Province[J]. Remote Sensing for Land & Resources, 2024, 36(1): 137-145 doi:10.6046/zrzyyg.2023081
20世纪70年代以来,对生态系统健康程度评价的研究逐渐成为国内外学界研究的热点,与生态系统健康程度的相关研究逐渐增多,但大多数研究仅基于单一维度或特定维度对生态系统健康程度进行定性或者定量的评估,例如使用归一化差异植被指数(normalized difference vegetation index,NDVI)[3⇓⇓-6]、叶面积指数(leaf area index,LAI)[7-8]和净初级生产力(net primary productivity,NPP)[9]评估植被的生长; 基于遥感影像热红外波段的地表温度探测城市热岛监测[10]; 构建各种干旱指数以评估区域干旱状况[11⇓-13]。由于生态系统的复杂性,单一指标往往无法对生态系统进行全面有效的分析与评估[14]。遥感技术具有大范围、周期性监测等优点,被广泛用于生态系统健康程度评价。目前基于遥感的生态指数中遥感生态指数(remote sensing ecological index,RSEI)使用主成分分析方法耦合了NDVI、湿度指数(wetness index,WET)[15]、归一化建筑和不透水面指数(normalized difference based built and impervious surface index,NDBSI)[16-17]和地表温度(land surface temperature,LST)[18]4个生态指标,可以对区域生态系统健康程度进行系统性评价[19],已得到越来越多的专家学者实验证明[16⇓⇓-19]。人类世中世界最大的问题,就是人类如何应对“社会—经济—环境”三者的耦合,社会、经济以及环境已经成为一个密不可分的研究整体。量化区域生态环境与经济发展的关系,鲁钰等[20]利用生态压力指数、生态协调系数和生态足迹多样性指数等指标,采用STIRPAT(stochastic impacts by regression on population, affluence, and technology)扩展模型结合主成分回归模型分析三维生态足迹演变的主要驱动因素; 熊曦[21]将欧洲环境局的即驱动力—压力—状态—影响—响应(DPSIR)环境管理模型引入到其生态文明建设分析评价,运用粗糙集理论和方法,就其生态文明建设展开分析评价; Gao等[22]构建土地利用强度指标体系和耦合协调度模型,探讨生态服务价值与土地利用强度的关系以及其变化原因。因此,为了更加全面地对福建省生态系统健康程度进行分析评估,就要探究社会、经济发展对生态环境的综合影响,本研究将从社会与经济的维度构建福建省土地利用强度体系。
Enhancing sustainability of grassland ecosystems through ecological restoration and grazing management in an era of climate change on Qinghai-Tibetan Plateau
[J]. Agriculture,Ecosystems and Environment, 2020, 287:106684.
Remote sensing monitoring and analysis of the vegetation phenological characteristics of the Qinling Mountains-Huanghuai Plain ecotone from 2002 to 2020
[J]. Remote Sensing for Natural Resources, 2022, 34(4):225-234.doi:10.6046/zrzyyg.2021400.
WuS.Remote sensing monitoring and evaluation of ecological environment in coal mine subsidence area[D]. Xuzhou: China University of Mining and Technology, 2021.
Analysis and evaluation of ecological civilization construction in national ecological civilization pilot area based on DPSIR model:Taking the source of Xiangjiang River as an example
Spatial-temporal analysis of ecosystem services value and research on ecological compensation in Taihu Lake basin of Jiangsu Province in China from 2005 to 2018
[J]. Journal of Cleaner Production, 2021, 317:128241.
. Land cover (LC) determines the energy exchange, water and carbon cycle between Earth's spheres. Accurate LC information is a fundamental parameter for the environment and climate studies. Considering that the LC in China has been altered dramatically with the economic development in the past few decades, sequential and fine-scale LC monitoring is in urgent need. However, currently, fine-resolution annual LC dataset produced by the observational images is generally unavailable for China due to the lack of sufficient training samples and computational capabilities. To deal with this issue, we produced the first Landsat-derived annual China land cover dataset (CLCD) on the Google Earth Engine (GEE) platform, which contains 30 m annual LC and its dynamics in China from 1990 to 2019. We first collected the training samples by combining stable samples extracted from China's land-use/cover datasets (CLUDs) and visually interpreted samples from satellite time-series data, Google Earth and Google Maps. Using 335 709 Landsat images on the GEE, several temporal metrics were constructed and fed to the random forest classifier to obtain classification results. We then proposed a post-processing method incorporating spatial–temporal filtering and logical reasoning to further improve the spatial–temporal consistency of CLCD. Finally, the overall accuracy of CLCD reached 79.31 % based on 5463 visually interpreted samples. A further assessment based on 5131 third-party test samples showed that the overall accuracy of CLCD outperforms that of MCD12Q1, ESACCI_LC, FROM_GLC and GlobeLand30. Besides, we intercompared the CLCD with several Landsat-derived thematic products, which exhibited good consistencies with the Global Forest Change, the Global Surface Water, and three impervious surface products. Based on the CLCD, the trends and patterns of China's LC changes during 1985 and 2019 were revealed, such as expansion of impervious surface (+148.71 %) and water (+18.39 %), decrease in cropland (−4.85 %) and grassland (−3.29 %), and increase in forest (+4.34 %). In general, CLCD reflected the rapid urbanization and a series of ecological projects (e.g. Gain for Green) in China and revealed the anthropogenic implications on LC under the condition of climate change, signifying its potential application in the global change research. The CLCD dataset introduced in this article is freely available at https://doi.org/10.5281/zenodo.4417810 (Yang and Huang, 2021).
The impact of land use intensity on the diversity of arbuscular mycorrhizal fungi (AMF) was investigated at eight sites in the "three-country corner" of France, Germany, and Switzerland. Three sites were low-input, species-rich grasslands. Two sites represented low- to moderate-input farming with a 7-year crop rotation, and three sites represented high-input continuous maize monocropping. Representative soil samples were taken, and the AMF spores present were morphologically identified and counted. The same soil samples also served as inocula for "AMF trap cultures" with Plantago lanceolata, Trifolium pratense, and Lolium perenne. These trap cultures were established in pots in a greenhouse, and AMF root colonization and spore formation were monitored over 8 months. For the field samples, the numbers of AMF spores and species were highest in the grasslands, lower in the low- and moderate-input arable lands, and lowest in the lands with intensive continuous maize monocropping. Some AMF species occurred at all sites ("generalists"); most of them were prevalent in the intensively managed arable lands. Many other species, particularly those forming sporocarps, appeared to be specialists for grasslands. Only a few species were specialized on the arable lands with crop rotation, and only one species was restricted to the high-input maize sites. In the trap culture experiment, the rate of root colonization by AMF was highest with inocula from the permanent grasslands and lowest with those from the high-input monocropping sites. In contrast, AMF spore formation was slowest with the former inocula and fastest with the latter inocula. In conclusion, the increased land use intensity was correlated with a decrease in AMF species richness and with a preferential selection of species that colonized roots slowly but formed spores rapidly.
AbeckerA, BernardiA, MausH, et al.
Information supply for business processes:Coupling workflow with document analysis and information retrieval
C4 grasses prosper as carbon dioxide eliminates desiccation in warmed semi-arid grassland
1
2011
... 20世纪70年代以来,对生态系统健康程度评价的研究逐渐成为国内外学界研究的热点,与生态系统健康程度的相关研究逐渐增多,但大多数研究仅基于单一维度或特定维度对生态系统健康程度进行定性或者定量的评估,例如使用归一化差异植被指数(normalized difference vegetation index,NDVI)[3⇓⇓-6]、叶面积指数(leaf area index,LAI)[7-8]和净初级生产力(net primary productivity,NPP)[9]评估植被的生长; 基于遥感影像热红外波段的地表温度探测城市热岛监测[10]; 构建各种干旱指数以评估区域干旱状况[11⇓-13].由于生态系统的复杂性,单一指标往往无法对生态系统进行全面有效的分析与评估[14].遥感技术具有大范围、周期性监测等优点,被广泛用于生态系统健康程度评价.目前基于遥感的生态指数中遥感生态指数(remote sensing ecological index,RSEI)使用主成分分析方法耦合了NDVI、湿度指数(wetness index,WET)[15]、归一化建筑和不透水面指数(normalized difference based built and impervious surface index,NDBSI)[16-17]和地表温度(land surface temperature,LST)[18]4个生态指标,可以对区域生态系统健康程度进行系统性评价[19],已得到越来越多的专家学者实验证明[16⇓⇓-19].人类世中世界最大的问题,就是人类如何应对“社会—经济—环境”三者的耦合,社会、经济以及环境已经成为一个密不可分的研究整体.量化区域生态环境与经济发展的关系,鲁钰等[20]利用生态压力指数、生态协调系数和生态足迹多样性指数等指标,采用STIRPAT(stochastic impacts by regression on population, affluence, and technology)扩展模型结合主成分回归模型分析三维生态足迹演变的主要驱动因素; 熊曦[21]将欧洲环境局的即驱动力—压力—状态—影响—响应(DPSIR)环境管理模型引入到其生态文明建设分析评价,运用粗糙集理论和方法,就其生态文明建设展开分析评价; Gao等[22]构建土地利用强度指标体系和耦合协调度模型,探讨生态服务价值与土地利用强度的关系以及其变化原因.因此,为了更加全面地对福建省生态系统健康程度进行分析评估,就要探究社会、经济发展对生态环境的综合影响,本研究将从社会与经济的维度构建福建省土地利用强度体系. ...
Enhancing sustainability of grassland ecosystems through ecological restoration and grazing management in an era of climate change on Qinghai-Tibetan Plateau
1
2020
... 20世纪70年代以来,对生态系统健康程度评价的研究逐渐成为国内外学界研究的热点,与生态系统健康程度的相关研究逐渐增多,但大多数研究仅基于单一维度或特定维度对生态系统健康程度进行定性或者定量的评估,例如使用归一化差异植被指数(normalized difference vegetation index,NDVI)[3⇓⇓-6]、叶面积指数(leaf area index,LAI)[7-8]和净初级生产力(net primary productivity,NPP)[9]评估植被的生长; 基于遥感影像热红外波段的地表温度探测城市热岛监测[10]; 构建各种干旱指数以评估区域干旱状况[11⇓-13].由于生态系统的复杂性,单一指标往往无法对生态系统进行全面有效的分析与评估[14].遥感技术具有大范围、周期性监测等优点,被广泛用于生态系统健康程度评价.目前基于遥感的生态指数中遥感生态指数(remote sensing ecological index,RSEI)使用主成分分析方法耦合了NDVI、湿度指数(wetness index,WET)[15]、归一化建筑和不透水面指数(normalized difference based built and impervious surface index,NDBSI)[16-17]和地表温度(land surface temperature,LST)[18]4个生态指标,可以对区域生态系统健康程度进行系统性评价[19],已得到越来越多的专家学者实验证明[16⇓⇓-19].人类世中世界最大的问题,就是人类如何应对“社会—经济—环境”三者的耦合,社会、经济以及环境已经成为一个密不可分的研究整体.量化区域生态环境与经济发展的关系,鲁钰等[20]利用生态压力指数、生态协调系数和生态足迹多样性指数等指标,采用STIRPAT(stochastic impacts by regression on population, affluence, and technology)扩展模型结合主成分回归模型分析三维生态足迹演变的主要驱动因素; 熊曦[21]将欧洲环境局的即驱动力—压力—状态—影响—响应(DPSIR)环境管理模型引入到其生态文明建设分析评价,运用粗糙集理论和方法,就其生态文明建设展开分析评价; Gao等[22]构建土地利用强度指标体系和耦合协调度模型,探讨生态服务价值与土地利用强度的关系以及其变化原因.因此,为了更加全面地对福建省生态系统健康程度进行分析评估,就要探究社会、经济发展对生态环境的综合影响,本研究将从社会与经济的维度构建福建省土地利用强度体系. ...
基于无人机高光谱影像的NDVI估算植被盖度精度分析
1
2021
... 20世纪70年代以来,对生态系统健康程度评价的研究逐渐成为国内外学界研究的热点,与生态系统健康程度的相关研究逐渐增多,但大多数研究仅基于单一维度或特定维度对生态系统健康程度进行定性或者定量的评估,例如使用归一化差异植被指数(normalized difference vegetation index,NDVI)[3⇓⇓-6]、叶面积指数(leaf area index,LAI)[7-8]和净初级生产力(net primary productivity,NPP)[9]评估植被的生长; 基于遥感影像热红外波段的地表温度探测城市热岛监测[10]; 构建各种干旱指数以评估区域干旱状况[11⇓-13].由于生态系统的复杂性,单一指标往往无法对生态系统进行全面有效的分析与评估[14].遥感技术具有大范围、周期性监测等优点,被广泛用于生态系统健康程度评价.目前基于遥感的生态指数中遥感生态指数(remote sensing ecological index,RSEI)使用主成分分析方法耦合了NDVI、湿度指数(wetness index,WET)[15]、归一化建筑和不透水面指数(normalized difference based built and impervious surface index,NDBSI)[16-17]和地表温度(land surface temperature,LST)[18]4个生态指标,可以对区域生态系统健康程度进行系统性评价[19],已得到越来越多的专家学者实验证明[16⇓⇓-19].人类世中世界最大的问题,就是人类如何应对“社会—经济—环境”三者的耦合,社会、经济以及环境已经成为一个密不可分的研究整体.量化区域生态环境与经济发展的关系,鲁钰等[20]利用生态压力指数、生态协调系数和生态足迹多样性指数等指标,采用STIRPAT(stochastic impacts by regression on population, affluence, and technology)扩展模型结合主成分回归模型分析三维生态足迹演变的主要驱动因素; 熊曦[21]将欧洲环境局的即驱动力—压力—状态—影响—响应(DPSIR)环境管理模型引入到其生态文明建设分析评价,运用粗糙集理论和方法,就其生态文明建设展开分析评价; Gao等[22]构建土地利用强度指标体系和耦合协调度模型,探讨生态服务价值与土地利用强度的关系以及其变化原因.因此,为了更加全面地对福建省生态系统健康程度进行分析评估,就要探究社会、经济发展对生态环境的综合影响,本研究将从社会与经济的维度构建福建省土地利用强度体系. ...
天津市重要生态空间的生态变化遥感监测分析
1
2020
... 20世纪70年代以来,对生态系统健康程度评价的研究逐渐成为国内外学界研究的热点,与生态系统健康程度的相关研究逐渐增多,但大多数研究仅基于单一维度或特定维度对生态系统健康程度进行定性或者定量的评估,例如使用归一化差异植被指数(normalized difference vegetation index,NDVI)[3⇓⇓-6]、叶面积指数(leaf area index,LAI)[7-8]和净初级生产力(net primary productivity,NPP)[9]评估植被的生长; 基于遥感影像热红外波段的地表温度探测城市热岛监测[10]; 构建各种干旱指数以评估区域干旱状况[11⇓-13].由于生态系统的复杂性,单一指标往往无法对生态系统进行全面有效的分析与评估[14].遥感技术具有大范围、周期性监测等优点,被广泛用于生态系统健康程度评价.目前基于遥感的生态指数中遥感生态指数(remote sensing ecological index,RSEI)使用主成分分析方法耦合了NDVI、湿度指数(wetness index,WET)[15]、归一化建筑和不透水面指数(normalized difference based built and impervious surface index,NDBSI)[16-17]和地表温度(land surface temperature,LST)[18]4个生态指标,可以对区域生态系统健康程度进行系统性评价[19],已得到越来越多的专家学者实验证明[16⇓⇓-19].人类世中世界最大的问题,就是人类如何应对“社会—经济—环境”三者的耦合,社会、经济以及环境已经成为一个密不可分的研究整体.量化区域生态环境与经济发展的关系,鲁钰等[20]利用生态压力指数、生态协调系数和生态足迹多样性指数等指标,采用STIRPAT(stochastic impacts by regression on population, affluence, and technology)扩展模型结合主成分回归模型分析三维生态足迹演变的主要驱动因素; 熊曦[21]将欧洲环境局的即驱动力—压力—状态—影响—响应(DPSIR)环境管理模型引入到其生态文明建设分析评价,运用粗糙集理论和方法,就其生态文明建设展开分析评价; Gao等[22]构建土地利用强度指标体系和耦合协调度模型,探讨生态服务价值与土地利用强度的关系以及其变化原因.因此,为了更加全面地对福建省生态系统健康程度进行分析评估,就要探究社会、经济发展对生态环境的综合影响,本研究将从社会与经济的维度构建福建省土地利用强度体系. ...
Effects of permafrost thawing on vegetation and soil carbon pool losses on the Qinghai-Tibet Plateau,China
1
2008
... 20世纪70年代以来,对生态系统健康程度评价的研究逐渐成为国内外学界研究的热点,与生态系统健康程度的相关研究逐渐增多,但大多数研究仅基于单一维度或特定维度对生态系统健康程度进行定性或者定量的评估,例如使用归一化差异植被指数(normalized difference vegetation index,NDVI)[3⇓⇓-6]、叶面积指数(leaf area index,LAI)[7-8]和净初级生产力(net primary productivity,NPP)[9]评估植被的生长; 基于遥感影像热红外波段的地表温度探测城市热岛监测[10]; 构建各种干旱指数以评估区域干旱状况[11⇓-13].由于生态系统的复杂性,单一指标往往无法对生态系统进行全面有效的分析与评估[14].遥感技术具有大范围、周期性监测等优点,被广泛用于生态系统健康程度评价.目前基于遥感的生态指数中遥感生态指数(remote sensing ecological index,RSEI)使用主成分分析方法耦合了NDVI、湿度指数(wetness index,WET)[15]、归一化建筑和不透水面指数(normalized difference based built and impervious surface index,NDBSI)[16-17]和地表温度(land surface temperature,LST)[18]4个生态指标,可以对区域生态系统健康程度进行系统性评价[19],已得到越来越多的专家学者实验证明[16⇓⇓-19].人类世中世界最大的问题,就是人类如何应对“社会—经济—环境”三者的耦合,社会、经济以及环境已经成为一个密不可分的研究整体.量化区域生态环境与经济发展的关系,鲁钰等[20]利用生态压力指数、生态协调系数和生态足迹多样性指数等指标,采用STIRPAT(stochastic impacts by regression on population, affluence, and technology)扩展模型结合主成分回归模型分析三维生态足迹演变的主要驱动因素; 熊曦[21]将欧洲环境局的即驱动力—压力—状态—影响—响应(DPSIR)环境管理模型引入到其生态文明建设分析评价,运用粗糙集理论和方法,就其生态文明建设展开分析评价; Gao等[22]构建土地利用强度指标体系和耦合协调度模型,探讨生态服务价值与土地利用强度的关系以及其变化原因.因此,为了更加全面地对福建省生态系统健康程度进行分析评估,就要探究社会、经济发展对生态环境的综合影响,本研究将从社会与经济的维度构建福建省土地利用强度体系. ...
2002—2020年秦岭—黄淮平原交界带植被物候特征遥感监测分析
1
2022
... 20世纪70年代以来,对生态系统健康程度评价的研究逐渐成为国内外学界研究的热点,与生态系统健康程度的相关研究逐渐增多,但大多数研究仅基于单一维度或特定维度对生态系统健康程度进行定性或者定量的评估,例如使用归一化差异植被指数(normalized difference vegetation index,NDVI)[3⇓⇓-6]、叶面积指数(leaf area index,LAI)[7-8]和净初级生产力(net primary productivity,NPP)[9]评估植被的生长; 基于遥感影像热红外波段的地表温度探测城市热岛监测[10]; 构建各种干旱指数以评估区域干旱状况[11⇓-13].由于生态系统的复杂性,单一指标往往无法对生态系统进行全面有效的分析与评估[14].遥感技术具有大范围、周期性监测等优点,被广泛用于生态系统健康程度评价.目前基于遥感的生态指数中遥感生态指数(remote sensing ecological index,RSEI)使用主成分分析方法耦合了NDVI、湿度指数(wetness index,WET)[15]、归一化建筑和不透水面指数(normalized difference based built and impervious surface index,NDBSI)[16-17]和地表温度(land surface temperature,LST)[18]4个生态指标,可以对区域生态系统健康程度进行系统性评价[19],已得到越来越多的专家学者实验证明[16⇓⇓-19].人类世中世界最大的问题,就是人类如何应对“社会—经济—环境”三者的耦合,社会、经济以及环境已经成为一个密不可分的研究整体.量化区域生态环境与经济发展的关系,鲁钰等[20]利用生态压力指数、生态协调系数和生态足迹多样性指数等指标,采用STIRPAT(stochastic impacts by regression on population, affluence, and technology)扩展模型结合主成分回归模型分析三维生态足迹演变的主要驱动因素; 熊曦[21]将欧洲环境局的即驱动力—压力—状态—影响—响应(DPSIR)环境管理模型引入到其生态文明建设分析评价,运用粗糙集理论和方法,就其生态文明建设展开分析评价; Gao等[22]构建土地利用强度指标体系和耦合协调度模型,探讨生态服务价值与土地利用强度的关系以及其变化原因.因此,为了更加全面地对福建省生态系统健康程度进行分析评估,就要探究社会、经济发展对生态环境的综合影响,本研究将从社会与经济的维度构建福建省土地利用强度体系. ...
广州市城市森林净初级生产力遥感估算
1
2016
... 20世纪70年代以来,对生态系统健康程度评价的研究逐渐成为国内外学界研究的热点,与生态系统健康程度的相关研究逐渐增多,但大多数研究仅基于单一维度或特定维度对生态系统健康程度进行定性或者定量的评估,例如使用归一化差异植被指数(normalized difference vegetation index,NDVI)[3⇓⇓-6]、叶面积指数(leaf area index,LAI)[7-8]和净初级生产力(net primary productivity,NPP)[9]评估植被的生长; 基于遥感影像热红外波段的地表温度探测城市热岛监测[10]; 构建各种干旱指数以评估区域干旱状况[11⇓-13].由于生态系统的复杂性,单一指标往往无法对生态系统进行全面有效的分析与评估[14].遥感技术具有大范围、周期性监测等优点,被广泛用于生态系统健康程度评价.目前基于遥感的生态指数中遥感生态指数(remote sensing ecological index,RSEI)使用主成分分析方法耦合了NDVI、湿度指数(wetness index,WET)[15]、归一化建筑和不透水面指数(normalized difference based built and impervious surface index,NDBSI)[16-17]和地表温度(land surface temperature,LST)[18]4个生态指标,可以对区域生态系统健康程度进行系统性评价[19],已得到越来越多的专家学者实验证明[16⇓⇓-19].人类世中世界最大的问题,就是人类如何应对“社会—经济—环境”三者的耦合,社会、经济以及环境已经成为一个密不可分的研究整体.量化区域生态环境与经济发展的关系,鲁钰等[20]利用生态压力指数、生态协调系数和生态足迹多样性指数等指标,采用STIRPAT(stochastic impacts by regression on population, affluence, and technology)扩展模型结合主成分回归模型分析三维生态足迹演变的主要驱动因素; 熊曦[21]将欧洲环境局的即驱动力—压力—状态—影响—响应(DPSIR)环境管理模型引入到其生态文明建设分析评价,运用粗糙集理论和方法,就其生态文明建设展开分析评价; Gao等[22]构建土地利用强度指标体系和耦合协调度模型,探讨生态服务价值与土地利用强度的关系以及其变化原因.因此,为了更加全面地对福建省生态系统健康程度进行分析评估,就要探究社会、经济发展对生态环境的综合影响,本研究将从社会与经济的维度构建福建省土地利用强度体系. ...
Predicting soil respiration for the Qinghai-Tibet Plateau:An empirical comparison of regression models
1
2016
... 20世纪70年代以来,对生态系统健康程度评价的研究逐渐成为国内外学界研究的热点,与生态系统健康程度的相关研究逐渐增多,但大多数研究仅基于单一维度或特定维度对生态系统健康程度进行定性或者定量的评估,例如使用归一化差异植被指数(normalized difference vegetation index,NDVI)[3⇓⇓-6]、叶面积指数(leaf area index,LAI)[7-8]和净初级生产力(net primary productivity,NPP)[9]评估植被的生长; 基于遥感影像热红外波段的地表温度探测城市热岛监测[10]; 构建各种干旱指数以评估区域干旱状况[11⇓-13].由于生态系统的复杂性,单一指标往往无法对生态系统进行全面有效的分析与评估[14].遥感技术具有大范围、周期性监测等优点,被广泛用于生态系统健康程度评价.目前基于遥感的生态指数中遥感生态指数(remote sensing ecological index,RSEI)使用主成分分析方法耦合了NDVI、湿度指数(wetness index,WET)[15]、归一化建筑和不透水面指数(normalized difference based built and impervious surface index,NDBSI)[16-17]和地表温度(land surface temperature,LST)[18]4个生态指标,可以对区域生态系统健康程度进行系统性评价[19],已得到越来越多的专家学者实验证明[16⇓⇓-19].人类世中世界最大的问题,就是人类如何应对“社会—经济—环境”三者的耦合,社会、经济以及环境已经成为一个密不可分的研究整体.量化区域生态环境与经济发展的关系,鲁钰等[20]利用生态压力指数、生态协调系数和生态足迹多样性指数等指标,采用STIRPAT(stochastic impacts by regression on population, affluence, and technology)扩展模型结合主成分回归模型分析三维生态足迹演变的主要驱动因素; 熊曦[21]将欧洲环境局的即驱动力—压力—状态—影响—响应(DPSIR)环境管理模型引入到其生态文明建设分析评价,运用粗糙集理论和方法,就其生态文明建设展开分析评价; Gao等[22]构建土地利用强度指标体系和耦合协调度模型,探讨生态服务价值与土地利用强度的关系以及其变化原因.因此,为了更加全面地对福建省生态系统健康程度进行分析评估,就要探究社会、经济发展对生态环境的综合影响,本研究将从社会与经济的维度构建福建省土地利用强度体系. ...
Cross-boundary human impacts compromise the Serengeti-Mara ecosystem
1
2019
... 20世纪70年代以来,对生态系统健康程度评价的研究逐渐成为国内外学界研究的热点,与生态系统健康程度的相关研究逐渐增多,但大多数研究仅基于单一维度或特定维度对生态系统健康程度进行定性或者定量的评估,例如使用归一化差异植被指数(normalized difference vegetation index,NDVI)[3⇓⇓-6]、叶面积指数(leaf area index,LAI)[7-8]和净初级生产力(net primary productivity,NPP)[9]评估植被的生长; 基于遥感影像热红外波段的地表温度探测城市热岛监测[10]; 构建各种干旱指数以评估区域干旱状况[11⇓-13].由于生态系统的复杂性,单一指标往往无法对生态系统进行全面有效的分析与评估[14].遥感技术具有大范围、周期性监测等优点,被广泛用于生态系统健康程度评价.目前基于遥感的生态指数中遥感生态指数(remote sensing ecological index,RSEI)使用主成分分析方法耦合了NDVI、湿度指数(wetness index,WET)[15]、归一化建筑和不透水面指数(normalized difference based built and impervious surface index,NDBSI)[16-17]和地表温度(land surface temperature,LST)[18]4个生态指标,可以对区域生态系统健康程度进行系统性评价[19],已得到越来越多的专家学者实验证明[16⇓⇓-19].人类世中世界最大的问题,就是人类如何应对“社会—经济—环境”三者的耦合,社会、经济以及环境已经成为一个密不可分的研究整体.量化区域生态环境与经济发展的关系,鲁钰等[20]利用生态压力指数、生态协调系数和生态足迹多样性指数等指标,采用STIRPAT(stochastic impacts by regression on population, affluence, and technology)扩展模型结合主成分回归模型分析三维生态足迹演变的主要驱动因素; 熊曦[21]将欧洲环境局的即驱动力—压力—状态—影响—响应(DPSIR)环境管理模型引入到其生态文明建设分析评价,运用粗糙集理论和方法,就其生态文明建设展开分析评价; Gao等[22]构建土地利用强度指标体系和耦合协调度模型,探讨生态服务价值与土地利用强度的关系以及其变化原因.因此,为了更加全面地对福建省生态系统健康程度进行分析评估,就要探究社会、经济发展对生态环境的综合影响,本研究将从社会与经济的维度构建福建省土地利用强度体系. ...
Effects of large herbivores on grassland arthropod diversity
1
2015
... 20世纪70年代以来,对生态系统健康程度评价的研究逐渐成为国内外学界研究的热点,与生态系统健康程度的相关研究逐渐增多,但大多数研究仅基于单一维度或特定维度对生态系统健康程度进行定性或者定量的评估,例如使用归一化差异植被指数(normalized difference vegetation index,NDVI)[3⇓⇓-6]、叶面积指数(leaf area index,LAI)[7-8]和净初级生产力(net primary productivity,NPP)[9]评估植被的生长; 基于遥感影像热红外波段的地表温度探测城市热岛监测[10]; 构建各种干旱指数以评估区域干旱状况[11⇓-13].由于生态系统的复杂性,单一指标往往无法对生态系统进行全面有效的分析与评估[14].遥感技术具有大范围、周期性监测等优点,被广泛用于生态系统健康程度评价.目前基于遥感的生态指数中遥感生态指数(remote sensing ecological index,RSEI)使用主成分分析方法耦合了NDVI、湿度指数(wetness index,WET)[15]、归一化建筑和不透水面指数(normalized difference based built and impervious surface index,NDBSI)[16-17]和地表温度(land surface temperature,LST)[18]4个生态指标,可以对区域生态系统健康程度进行系统性评价[19],已得到越来越多的专家学者实验证明[16⇓⇓-19].人类世中世界最大的问题,就是人类如何应对“社会—经济—环境”三者的耦合,社会、经济以及环境已经成为一个密不可分的研究整体.量化区域生态环境与经济发展的关系,鲁钰等[20]利用生态压力指数、生态协调系数和生态足迹多样性指数等指标,采用STIRPAT(stochastic impacts by regression on population, affluence, and technology)扩展模型结合主成分回归模型分析三维生态足迹演变的主要驱动因素; 熊曦[21]将欧洲环境局的即驱动力—压力—状态—影响—响应(DPSIR)环境管理模型引入到其生态文明建设分析评价,运用粗糙集理论和方法,就其生态文明建设展开分析评价; Gao等[22]构建土地利用强度指标体系和耦合协调度模型,探讨生态服务价值与土地利用强度的关系以及其变化原因.因此,为了更加全面地对福建省生态系统健康程度进行分析评估,就要探究社会、经济发展对生态环境的综合影响,本研究将从社会与经济的维度构建福建省土地利用强度体系. ...
新疆干旱时空动态及其对气候变化的响应
1
2022
... 20世纪70年代以来,对生态系统健康程度评价的研究逐渐成为国内外学界研究的热点,与生态系统健康程度的相关研究逐渐增多,但大多数研究仅基于单一维度或特定维度对生态系统健康程度进行定性或者定量的评估,例如使用归一化差异植被指数(normalized difference vegetation index,NDVI)[3⇓⇓-6]、叶面积指数(leaf area index,LAI)[7-8]和净初级生产力(net primary productivity,NPP)[9]评估植被的生长; 基于遥感影像热红外波段的地表温度探测城市热岛监测[10]; 构建各种干旱指数以评估区域干旱状况[11⇓-13].由于生态系统的复杂性,单一指标往往无法对生态系统进行全面有效的分析与评估[14].遥感技术具有大范围、周期性监测等优点,被广泛用于生态系统健康程度评价.目前基于遥感的生态指数中遥感生态指数(remote sensing ecological index,RSEI)使用主成分分析方法耦合了NDVI、湿度指数(wetness index,WET)[15]、归一化建筑和不透水面指数(normalized difference based built and impervious surface index,NDBSI)[16-17]和地表温度(land surface temperature,LST)[18]4个生态指标,可以对区域生态系统健康程度进行系统性评价[19],已得到越来越多的专家学者实验证明[16⇓⇓-19].人类世中世界最大的问题,就是人类如何应对“社会—经济—环境”三者的耦合,社会、经济以及环境已经成为一个密不可分的研究整体.量化区域生态环境与经济发展的关系,鲁钰等[20]利用生态压力指数、生态协调系数和生态足迹多样性指数等指标,采用STIRPAT(stochastic impacts by regression on population, affluence, and technology)扩展模型结合主成分回归模型分析三维生态足迹演变的主要驱动因素; 熊曦[21]将欧洲环境局的即驱动力—压力—状态—影响—响应(DPSIR)环境管理模型引入到其生态文明建设分析评价,运用粗糙集理论和方法,就其生态文明建设展开分析评价; Gao等[22]构建土地利用强度指标体系和耦合协调度模型,探讨生态服务价值与土地利用强度的关系以及其变化原因.因此,为了更加全面地对福建省生态系统健康程度进行分析评估,就要探究社会、经济发展对生态环境的综合影响,本研究将从社会与经济的维度构建福建省土地利用强度体系. ...
生态文明视野下可持续发展的未来路径
1
2022
... 20世纪70年代以来,对生态系统健康程度评价的研究逐渐成为国内外学界研究的热点,与生态系统健康程度的相关研究逐渐增多,但大多数研究仅基于单一维度或特定维度对生态系统健康程度进行定性或者定量的评估,例如使用归一化差异植被指数(normalized difference vegetation index,NDVI)[3⇓⇓-6]、叶面积指数(leaf area index,LAI)[7-8]和净初级生产力(net primary productivity,NPP)[9]评估植被的生长; 基于遥感影像热红外波段的地表温度探测城市热岛监测[10]; 构建各种干旱指数以评估区域干旱状况[11⇓-13].由于生态系统的复杂性,单一指标往往无法对生态系统进行全面有效的分析与评估[14].遥感技术具有大范围、周期性监测等优点,被广泛用于生态系统健康程度评价.目前基于遥感的生态指数中遥感生态指数(remote sensing ecological index,RSEI)使用主成分分析方法耦合了NDVI、湿度指数(wetness index,WET)[15]、归一化建筑和不透水面指数(normalized difference based built and impervious surface index,NDBSI)[16-17]和地表温度(land surface temperature,LST)[18]4个生态指标,可以对区域生态系统健康程度进行系统性评价[19],已得到越来越多的专家学者实验证明[16⇓⇓-19].人类世中世界最大的问题,就是人类如何应对“社会—经济—环境”三者的耦合,社会、经济以及环境已经成为一个密不可分的研究整体.量化区域生态环境与经济发展的关系,鲁钰等[20]利用生态压力指数、生态协调系数和生态足迹多样性指数等指标,采用STIRPAT(stochastic impacts by regression on population, affluence, and technology)扩展模型结合主成分回归模型分析三维生态足迹演变的主要驱动因素; 熊曦[21]将欧洲环境局的即驱动力—压力—状态—影响—响应(DPSIR)环境管理模型引入到其生态文明建设分析评价,运用粗糙集理论和方法,就其生态文明建设展开分析评价; Gao等[22]构建土地利用强度指标体系和耦合协调度模型,探讨生态服务价值与土地利用强度的关系以及其变化原因.因此,为了更加全面地对福建省生态系统健康程度进行分析评估,就要探究社会、经济发展对生态环境的综合影响,本研究将从社会与经济的维度构建福建省土地利用强度体系. ...
国家湿地公园社会功能评价指标体系构建及应用——以白渔泡国家湿地公园为例
1
2019
... 20世纪70年代以来,对生态系统健康程度评价的研究逐渐成为国内外学界研究的热点,与生态系统健康程度的相关研究逐渐增多,但大多数研究仅基于单一维度或特定维度对生态系统健康程度进行定性或者定量的评估,例如使用归一化差异植被指数(normalized difference vegetation index,NDVI)[3⇓⇓-6]、叶面积指数(leaf area index,LAI)[7-8]和净初级生产力(net primary productivity,NPP)[9]评估植被的生长; 基于遥感影像热红外波段的地表温度探测城市热岛监测[10]; 构建各种干旱指数以评估区域干旱状况[11⇓-13].由于生态系统的复杂性,单一指标往往无法对生态系统进行全面有效的分析与评估[14].遥感技术具有大范围、周期性监测等优点,被广泛用于生态系统健康程度评价.目前基于遥感的生态指数中遥感生态指数(remote sensing ecological index,RSEI)使用主成分分析方法耦合了NDVI、湿度指数(wetness index,WET)[15]、归一化建筑和不透水面指数(normalized difference based built and impervious surface index,NDBSI)[16-17]和地表温度(land surface temperature,LST)[18]4个生态指标,可以对区域生态系统健康程度进行系统性评价[19],已得到越来越多的专家学者实验证明[16⇓⇓-19].人类世中世界最大的问题,就是人类如何应对“社会—经济—环境”三者的耦合,社会、经济以及环境已经成为一个密不可分的研究整体.量化区域生态环境与经济发展的关系,鲁钰等[20]利用生态压力指数、生态协调系数和生态足迹多样性指数等指标,采用STIRPAT(stochastic impacts by regression on population, affluence, and technology)扩展模型结合主成分回归模型分析三维生态足迹演变的主要驱动因素; 熊曦[21]将欧洲环境局的即驱动力—压力—状态—影响—响应(DPSIR)环境管理模型引入到其生态文明建设分析评价,运用粗糙集理论和方法,就其生态文明建设展开分析评价; Gao等[22]构建土地利用强度指标体系和耦合协调度模型,探讨生态服务价值与土地利用强度的关系以及其变化原因.因此,为了更加全面地对福建省生态系统健康程度进行分析评估,就要探究社会、经济发展对生态环境的综合影响,本研究将从社会与经济的维度构建福建省土地利用强度体系. ...
基于遥感生态指数的武汉市生态环境质量评估
2
2020
... 20世纪70年代以来,对生态系统健康程度评价的研究逐渐成为国内外学界研究的热点,与生态系统健康程度的相关研究逐渐增多,但大多数研究仅基于单一维度或特定维度对生态系统健康程度进行定性或者定量的评估,例如使用归一化差异植被指数(normalized difference vegetation index,NDVI)[3⇓⇓-6]、叶面积指数(leaf area index,LAI)[7-8]和净初级生产力(net primary productivity,NPP)[9]评估植被的生长; 基于遥感影像热红外波段的地表温度探测城市热岛监测[10]; 构建各种干旱指数以评估区域干旱状况[11⇓-13].由于生态系统的复杂性,单一指标往往无法对生态系统进行全面有效的分析与评估[14].遥感技术具有大范围、周期性监测等优点,被广泛用于生态系统健康程度评价.目前基于遥感的生态指数中遥感生态指数(remote sensing ecological index,RSEI)使用主成分分析方法耦合了NDVI、湿度指数(wetness index,WET)[15]、归一化建筑和不透水面指数(normalized difference based built and impervious surface index,NDBSI)[16-17]和地表温度(land surface temperature,LST)[18]4个生态指标,可以对区域生态系统健康程度进行系统性评价[19],已得到越来越多的专家学者实验证明[16⇓⇓-19].人类世中世界最大的问题,就是人类如何应对“社会—经济—环境”三者的耦合,社会、经济以及环境已经成为一个密不可分的研究整体.量化区域生态环境与经济发展的关系,鲁钰等[20]利用生态压力指数、生态协调系数和生态足迹多样性指数等指标,采用STIRPAT(stochastic impacts by regression on population, affluence, and technology)扩展模型结合主成分回归模型分析三维生态足迹演变的主要驱动因素; 熊曦[21]将欧洲环境局的即驱动力—压力—状态—影响—响应(DPSIR)环境管理模型引入到其生态文明建设分析评价,运用粗糙集理论和方法,就其生态文明建设展开分析评价; Gao等[22]构建土地利用强度指标体系和耦合协调度模型,探讨生态服务价值与土地利用强度的关系以及其变化原因.因此,为了更加全面地对福建省生态系统健康程度进行分析评估,就要探究社会、经济发展对生态环境的综合影响,本研究将从社会与经济的维度构建福建省土地利用强度体系. ...
... [16⇓⇓-19].人类世中世界最大的问题,就是人类如何应对“社会—经济—环境”三者的耦合,社会、经济以及环境已经成为一个密不可分的研究整体.量化区域生态环境与经济发展的关系,鲁钰等[20]利用生态压力指数、生态协调系数和生态足迹多样性指数等指标,采用STIRPAT(stochastic impacts by regression on population, affluence, and technology)扩展模型结合主成分回归模型分析三维生态足迹演变的主要驱动因素; 熊曦[21]将欧洲环境局的即驱动力—压力—状态—影响—响应(DPSIR)环境管理模型引入到其生态文明建设分析评价,运用粗糙集理论和方法,就其生态文明建设展开分析评价; Gao等[22]构建土地利用强度指标体系和耦合协调度模型,探讨生态服务价值与土地利用强度的关系以及其变化原因.因此,为了更加全面地对福建省生态系统健康程度进行分析评估,就要探究社会、经济发展对生态环境的综合影响,本研究将从社会与经济的维度构建福建省土地利用强度体系. ...
2
2021
... 20世纪70年代以来,对生态系统健康程度评价的研究逐渐成为国内外学界研究的热点,与生态系统健康程度的相关研究逐渐增多,但大多数研究仅基于单一维度或特定维度对生态系统健康程度进行定性或者定量的评估,例如使用归一化差异植被指数(normalized difference vegetation index,NDVI)[3⇓⇓-6]、叶面积指数(leaf area index,LAI)[7-8]和净初级生产力(net primary productivity,NPP)[9]评估植被的生长; 基于遥感影像热红外波段的地表温度探测城市热岛监测[10]; 构建各种干旱指数以评估区域干旱状况[11⇓-13].由于生态系统的复杂性,单一指标往往无法对生态系统进行全面有效的分析与评估[14].遥感技术具有大范围、周期性监测等优点,被广泛用于生态系统健康程度评价.目前基于遥感的生态指数中遥感生态指数(remote sensing ecological index,RSEI)使用主成分分析方法耦合了NDVI、湿度指数(wetness index,WET)[15]、归一化建筑和不透水面指数(normalized difference based built and impervious surface index,NDBSI)[16-17]和地表温度(land surface temperature,LST)[18]4个生态指标,可以对区域生态系统健康程度进行系统性评价[19],已得到越来越多的专家学者实验证明[16⇓⇓-19].人类世中世界最大的问题,就是人类如何应对“社会—经济—环境”三者的耦合,社会、经济以及环境已经成为一个密不可分的研究整体.量化区域生态环境与经济发展的关系,鲁钰等[20]利用生态压力指数、生态协调系数和生态足迹多样性指数等指标,采用STIRPAT(stochastic impacts by regression on population, affluence, and technology)扩展模型结合主成分回归模型分析三维生态足迹演变的主要驱动因素; 熊曦[21]将欧洲环境局的即驱动力—压力—状态—影响—响应(DPSIR)环境管理模型引入到其生态文明建设分析评价,运用粗糙集理论和方法,就其生态文明建设展开分析评价; Gao等[22]构建土地利用强度指标体系和耦合协调度模型,探讨生态服务价值与土地利用强度的关系以及其变化原因.因此,为了更加全面地对福建省生态系统健康程度进行分析评估,就要探究社会、经济发展对生态环境的综合影响,本研究将从社会与经济的维度构建福建省土地利用强度体系. ...
... ⇓⇓-19].人类世中世界最大的问题,就是人类如何应对“社会—经济—环境”三者的耦合,社会、经济以及环境已经成为一个密不可分的研究整体.量化区域生态环境与经济发展的关系,鲁钰等[20]利用生态压力指数、生态协调系数和生态足迹多样性指数等指标,采用STIRPAT(stochastic impacts by regression on population, affluence, and technology)扩展模型结合主成分回归模型分析三维生态足迹演变的主要驱动因素; 熊曦[21]将欧洲环境局的即驱动力—压力—状态—影响—响应(DPSIR)环境管理模型引入到其生态文明建设分析评价,运用粗糙集理论和方法,就其生态文明建设展开分析评价; Gao等[22]构建土地利用强度指标体系和耦合协调度模型,探讨生态服务价值与土地利用强度的关系以及其变化原因.因此,为了更加全面地对福建省生态系统健康程度进行分析评估,就要探究社会、经济发展对生态环境的综合影响,本研究将从社会与经济的维度构建福建省土地利用强度体系. ...
浙江省植被生态质量时空变化及其驱动因素分析
2
2023
... 20世纪70年代以来,对生态系统健康程度评价的研究逐渐成为国内外学界研究的热点,与生态系统健康程度的相关研究逐渐增多,但大多数研究仅基于单一维度或特定维度对生态系统健康程度进行定性或者定量的评估,例如使用归一化差异植被指数(normalized difference vegetation index,NDVI)[3⇓⇓-6]、叶面积指数(leaf area index,LAI)[7-8]和净初级生产力(net primary productivity,NPP)[9]评估植被的生长; 基于遥感影像热红外波段的地表温度探测城市热岛监测[10]; 构建各种干旱指数以评估区域干旱状况[11⇓-13].由于生态系统的复杂性,单一指标往往无法对生态系统进行全面有效的分析与评估[14].遥感技术具有大范围、周期性监测等优点,被广泛用于生态系统健康程度评价.目前基于遥感的生态指数中遥感生态指数(remote sensing ecological index,RSEI)使用主成分分析方法耦合了NDVI、湿度指数(wetness index,WET)[15]、归一化建筑和不透水面指数(normalized difference based built and impervious surface index,NDBSI)[16-17]和地表温度(land surface temperature,LST)[18]4个生态指标,可以对区域生态系统健康程度进行系统性评价[19],已得到越来越多的专家学者实验证明[16⇓⇓-19].人类世中世界最大的问题,就是人类如何应对“社会—经济—环境”三者的耦合,社会、经济以及环境已经成为一个密不可分的研究整体.量化区域生态环境与经济发展的关系,鲁钰等[20]利用生态压力指数、生态协调系数和生态足迹多样性指数等指标,采用STIRPAT(stochastic impacts by regression on population, affluence, and technology)扩展模型结合主成分回归模型分析三维生态足迹演变的主要驱动因素; 熊曦[21]将欧洲环境局的即驱动力—压力—状态—影响—响应(DPSIR)环境管理模型引入到其生态文明建设分析评价,运用粗糙集理论和方法,就其生态文明建设展开分析评价; Gao等[22]构建土地利用强度指标体系和耦合协调度模型,探讨生态服务价值与土地利用强度的关系以及其变化原因.因此,为了更加全面地对福建省生态系统健康程度进行分析评估,就要探究社会、经济发展对生态环境的综合影响,本研究将从社会与经济的维度构建福建省土地利用强度体系. ...
... ⇓-19].人类世中世界最大的问题,就是人类如何应对“社会—经济—环境”三者的耦合,社会、经济以及环境已经成为一个密不可分的研究整体.量化区域生态环境与经济发展的关系,鲁钰等[20]利用生态压力指数、生态协调系数和生态足迹多样性指数等指标,采用STIRPAT(stochastic impacts by regression on population, affluence, and technology)扩展模型结合主成分回归模型分析三维生态足迹演变的主要驱动因素; 熊曦[21]将欧洲环境局的即驱动力—压力—状态—影响—响应(DPSIR)环境管理模型引入到其生态文明建设分析评价,运用粗糙集理论和方法,就其生态文明建设展开分析评价; Gao等[22]构建土地利用强度指标体系和耦合协调度模型,探讨生态服务价值与土地利用强度的关系以及其变化原因.因此,为了更加全面地对福建省生态系统健康程度进行分析评估,就要探究社会、经济发展对生态环境的综合影响,本研究将从社会与经济的维度构建福建省土地利用强度体系. ...
基于遥感生态指数的新疆玛纳斯湖湿地生态变化评价
2
2019
... 20世纪70年代以来,对生态系统健康程度评价的研究逐渐成为国内外学界研究的热点,与生态系统健康程度的相关研究逐渐增多,但大多数研究仅基于单一维度或特定维度对生态系统健康程度进行定性或者定量的评估,例如使用归一化差异植被指数(normalized difference vegetation index,NDVI)[3⇓⇓-6]、叶面积指数(leaf area index,LAI)[7-8]和净初级生产力(net primary productivity,NPP)[9]评估植被的生长; 基于遥感影像热红外波段的地表温度探测城市热岛监测[10]; 构建各种干旱指数以评估区域干旱状况[11⇓-13].由于生态系统的复杂性,单一指标往往无法对生态系统进行全面有效的分析与评估[14].遥感技术具有大范围、周期性监测等优点,被广泛用于生态系统健康程度评价.目前基于遥感的生态指数中遥感生态指数(remote sensing ecological index,RSEI)使用主成分分析方法耦合了NDVI、湿度指数(wetness index,WET)[15]、归一化建筑和不透水面指数(normalized difference based built and impervious surface index,NDBSI)[16-17]和地表温度(land surface temperature,LST)[18]4个生态指标,可以对区域生态系统健康程度进行系统性评价[19],已得到越来越多的专家学者实验证明[16⇓⇓-19].人类世中世界最大的问题,就是人类如何应对“社会—经济—环境”三者的耦合,社会、经济以及环境已经成为一个密不可分的研究整体.量化区域生态环境与经济发展的关系,鲁钰等[20]利用生态压力指数、生态协调系数和生态足迹多样性指数等指标,采用STIRPAT(stochastic impacts by regression on population, affluence, and technology)扩展模型结合主成分回归模型分析三维生态足迹演变的主要驱动因素; 熊曦[21]将欧洲环境局的即驱动力—压力—状态—影响—响应(DPSIR)环境管理模型引入到其生态文明建设分析评价,运用粗糙集理论和方法,就其生态文明建设展开分析评价; Gao等[22]构建土地利用强度指标体系和耦合协调度模型,探讨生态服务价值与土地利用强度的关系以及其变化原因.因此,为了更加全面地对福建省生态系统健康程度进行分析评估,就要探究社会、经济发展对生态环境的综合影响,本研究将从社会与经济的维度构建福建省土地利用强度体系. ...
... -19].人类世中世界最大的问题,就是人类如何应对“社会—经济—环境”三者的耦合,社会、经济以及环境已经成为一个密不可分的研究整体.量化区域生态环境与经济发展的关系,鲁钰等[20]利用生态压力指数、生态协调系数和生态足迹多样性指数等指标,采用STIRPAT(stochastic impacts by regression on population, affluence, and technology)扩展模型结合主成分回归模型分析三维生态足迹演变的主要驱动因素; 熊曦[21]将欧洲环境局的即驱动力—压力—状态—影响—响应(DPSIR)环境管理模型引入到其生态文明建设分析评价,运用粗糙集理论和方法,就其生态文明建设展开分析评价; Gao等[22]构建土地利用强度指标体系和耦合协调度模型,探讨生态服务价值与土地利用强度的关系以及其变化原因.因此,为了更加全面地对福建省生态系统健康程度进行分析评估,就要探究社会、经济发展对生态环境的综合影响,本研究将从社会与经济的维度构建福建省土地利用强度体系. ...
西北地区三维生态足迹生态安全评价及驱动力分析
1
2022
... 20世纪70年代以来,对生态系统健康程度评价的研究逐渐成为国内外学界研究的热点,与生态系统健康程度的相关研究逐渐增多,但大多数研究仅基于单一维度或特定维度对生态系统健康程度进行定性或者定量的评估,例如使用归一化差异植被指数(normalized difference vegetation index,NDVI)[3⇓⇓-6]、叶面积指数(leaf area index,LAI)[7-8]和净初级生产力(net primary productivity,NPP)[9]评估植被的生长; 基于遥感影像热红外波段的地表温度探测城市热岛监测[10]; 构建各种干旱指数以评估区域干旱状况[11⇓-13].由于生态系统的复杂性,单一指标往往无法对生态系统进行全面有效的分析与评估[14].遥感技术具有大范围、周期性监测等优点,被广泛用于生态系统健康程度评价.目前基于遥感的生态指数中遥感生态指数(remote sensing ecological index,RSEI)使用主成分分析方法耦合了NDVI、湿度指数(wetness index,WET)[15]、归一化建筑和不透水面指数(normalized difference based built and impervious surface index,NDBSI)[16-17]和地表温度(land surface temperature,LST)[18]4个生态指标,可以对区域生态系统健康程度进行系统性评价[19],已得到越来越多的专家学者实验证明[16⇓⇓-19].人类世中世界最大的问题,就是人类如何应对“社会—经济—环境”三者的耦合,社会、经济以及环境已经成为一个密不可分的研究整体.量化区域生态环境与经济发展的关系,鲁钰等[20]利用生态压力指数、生态协调系数和生态足迹多样性指数等指标,采用STIRPAT(stochastic impacts by regression on population, affluence, and technology)扩展模型结合主成分回归模型分析三维生态足迹演变的主要驱动因素; 熊曦[21]将欧洲环境局的即驱动力—压力—状态—影响—响应(DPSIR)环境管理模型引入到其生态文明建设分析评价,运用粗糙集理论和方法,就其生态文明建设展开分析评价; Gao等[22]构建土地利用强度指标体系和耦合协调度模型,探讨生态服务价值与土地利用强度的关系以及其变化原因.因此,为了更加全面地对福建省生态系统健康程度进行分析评估,就要探究社会、经济发展对生态环境的综合影响,本研究将从社会与经济的维度构建福建省土地利用强度体系. ...
基于DPSIR模型的国家级生态文明先行示范区生态文明建设分析评价——以湘江源头为例
1
2020
... 20世纪70年代以来,对生态系统健康程度评价的研究逐渐成为国内外学界研究的热点,与生态系统健康程度的相关研究逐渐增多,但大多数研究仅基于单一维度或特定维度对生态系统健康程度进行定性或者定量的评估,例如使用归一化差异植被指数(normalized difference vegetation index,NDVI)[3⇓⇓-6]、叶面积指数(leaf area index,LAI)[7-8]和净初级生产力(net primary productivity,NPP)[9]评估植被的生长; 基于遥感影像热红外波段的地表温度探测城市热岛监测[10]; 构建各种干旱指数以评估区域干旱状况[11⇓-13].由于生态系统的复杂性,单一指标往往无法对生态系统进行全面有效的分析与评估[14].遥感技术具有大范围、周期性监测等优点,被广泛用于生态系统健康程度评价.目前基于遥感的生态指数中遥感生态指数(remote sensing ecological index,RSEI)使用主成分分析方法耦合了NDVI、湿度指数(wetness index,WET)[15]、归一化建筑和不透水面指数(normalized difference based built and impervious surface index,NDBSI)[16-17]和地表温度(land surface temperature,LST)[18]4个生态指标,可以对区域生态系统健康程度进行系统性评价[19],已得到越来越多的专家学者实验证明[16⇓⇓-19].人类世中世界最大的问题,就是人类如何应对“社会—经济—环境”三者的耦合,社会、经济以及环境已经成为一个密不可分的研究整体.量化区域生态环境与经济发展的关系,鲁钰等[20]利用生态压力指数、生态协调系数和生态足迹多样性指数等指标,采用STIRPAT(stochastic impacts by regression on population, affluence, and technology)扩展模型结合主成分回归模型分析三维生态足迹演变的主要驱动因素; 熊曦[21]将欧洲环境局的即驱动力—压力—状态—影响—响应(DPSIR)环境管理模型引入到其生态文明建设分析评价,运用粗糙集理论和方法,就其生态文明建设展开分析评价; Gao等[22]构建土地利用强度指标体系和耦合协调度模型,探讨生态服务价值与土地利用强度的关系以及其变化原因.因此,为了更加全面地对福建省生态系统健康程度进行分析评估,就要探究社会、经济发展对生态环境的综合影响,本研究将从社会与经济的维度构建福建省土地利用强度体系. ...
Spatial-temporal analysis of ecosystem services value and research on ecological compensation in Taihu Lake basin of Jiangsu Province in China from 2005 to 2018
1
2021
... 20世纪70年代以来,对生态系统健康程度评价的研究逐渐成为国内外学界研究的热点,与生态系统健康程度的相关研究逐渐增多,但大多数研究仅基于单一维度或特定维度对生态系统健康程度进行定性或者定量的评估,例如使用归一化差异植被指数(normalized difference vegetation index,NDVI)[3⇓⇓-6]、叶面积指数(leaf area index,LAI)[7-8]和净初级生产力(net primary productivity,NPP)[9]评估植被的生长; 基于遥感影像热红外波段的地表温度探测城市热岛监测[10]; 构建各种干旱指数以评估区域干旱状况[11⇓-13].由于生态系统的复杂性,单一指标往往无法对生态系统进行全面有效的分析与评估[14].遥感技术具有大范围、周期性监测等优点,被广泛用于生态系统健康程度评价.目前基于遥感的生态指数中遥感生态指数(remote sensing ecological index,RSEI)使用主成分分析方法耦合了NDVI、湿度指数(wetness index,WET)[15]、归一化建筑和不透水面指数(normalized difference based built and impervious surface index,NDBSI)[16-17]和地表温度(land surface temperature,LST)[18]4个生态指标,可以对区域生态系统健康程度进行系统性评价[19],已得到越来越多的专家学者实验证明[16⇓⇓-19].人类世中世界最大的问题,就是人类如何应对“社会—经济—环境”三者的耦合,社会、经济以及环境已经成为一个密不可分的研究整体.量化区域生态环境与经济发展的关系,鲁钰等[20]利用生态压力指数、生态协调系数和生态足迹多样性指数等指标,采用STIRPAT(stochastic impacts by regression on population, affluence, and technology)扩展模型结合主成分回归模型分析三维生态足迹演变的主要驱动因素; 熊曦[21]将欧洲环境局的即驱动力—压力—状态—影响—响应(DPSIR)环境管理模型引入到其生态文明建设分析评价,运用粗糙集理论和方法,就其生态文明建设展开分析评价; Gao等[22]构建土地利用强度指标体系和耦合协调度模型,探讨生态服务价值与土地利用强度的关系以及其变化原因.因此,为了更加全面地对福建省生态系统健康程度进行分析评估,就要探究社会、经济发展对生态环境的综合影响,本研究将从社会与经济的维度构建福建省土地利用强度体系. ...


