

0 引言
从数据来源看,传统的统计数据缺乏空间信息,不能进行空间数据分析,随着航天遥感技术的发展,遥感影像逐渐成为城市扩张研究的主要数据源,然而高分辨率遥感影像数据量大、处理步骤繁琐、利用难度较高[10-11],不利于长时间序列城市扩张的空间演变分析。夜间灯光数据具有出色的低光探测能力,包含丰富的强度变化信息、数据时空连续性强、容易获取,比较适合大尺度、长时间序列的空间扩张动态的研究[12]。近年来,DMSP/OLS和NPP/VIIRS夜间灯光数据已经广泛应用于区域和全球尺度的城市扩张研究,例如: Jiang等[13]利用1992—2013年DMSP/OLS数据全面分析了非洲的城市化动态,发现在非洲照明区域有了巨大的发展,尤其是夜间照明不足的区域; Li等[14]基于NPP/VIIRS和统计数据定量分析了广西城市扩张的时空演变模式,并基于地理探测器分析了其驱动机制。也有学者结合了DMSP/OLS和NPP/VIIRS 2种影像研究城市化进程,以得到更长时间序列的城市扩张演变历程,例如Jiang等[15]结合2种夜间灯光数据揭示了朝鲜典型城市的空间格局和变化特征,发现朝鲜的城市化水平与中国和韩国之间仍存在很大差距。
目前国内基于夜间灯光遥感的城市扩张研究侧重于长三角城市群、长江中下游城市群和珠三角城市群等城市化水平较高的地区[16],对于城市化水平相对落后的中西部地区缺乏充分研究。根据《中原城市群发展规划》[17],中原城市群具有连接东部沿海开放区和中西部地区的区位优势,是中西部地区创新创业的先行区,肩负着引领中部崛起的重大使命。因此,本文选取中原城市群作为研究区,研究其城市化发展的时空演变特征及其驱动力,对促进中原城市群以及其他中西部城市的发展,有序推进城市化进程具有重要意义。本研究基于DMSP/OLS和NPP/VIIRS 2种夜间灯光影像,采用统计数据比较法提取了1993—2018年的城市建成区空间信息,选取城市群整体和地市2种尺度、时间和空间2种角度,构建城市扩张速度、扩张强度、扩张类型、标准差椭圆、热点分析等指标,对长时间序列中原城市群城市扩张的时空演变过程进行了定量对比分析,总结了中原城市群1993—2018年近25 a间空间格局的动态发展规律,并研究了影响城市群扩张的驱动力机制,可为其本身乃至中西部城市化发展、上层决策制定提供科学参考。
1 研究区概况与数据源
1.1 研究区概况
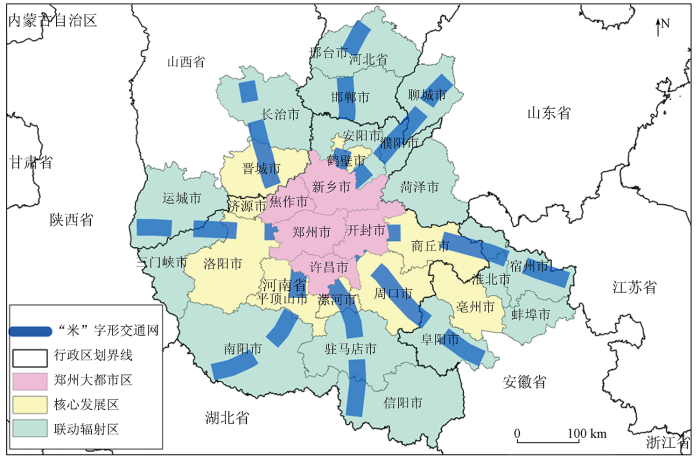
本文选取中原城市群作为研究区,该城市群地处我国中东部,是“一带一路”国家战略及东西部地区产业转移、资源配置核心枢纽,承担着引领中部崛起、促进中西部地区共同发展的重要使命[18]。截至2020年底,常住人口1.64亿人,生产总值8.1万亿元,在七大国家城市群中排名第四。根据国务院2016年批复的《中原城市群发展规划》[17],中原城市群共包括5省30个城市,涵盖河南省全部城市,陕西省、山东省、河北省、安徽省部分城市。中原城市群交通区位优势突出,陆桥通道和京广通道交汇于此,建成了“米”字形高速铁路网,进而形成了“一核四轴四区”的网络化空间布局[19](图1)。近年来中原城市群各城市之间紧密合作,协同发展,成为城市群发展的“后起之秀”。
图1
1.2 数据源及其预处理
1)夜间灯光数据。本文的时间跨度从1993—2018年,使用了1993—2010年DMSP/OLS稳定数据和2015年、2018年年度NPP/VIIRS数据。以上数据来源于美国国家地球物理数据中心。
式中: n为年份,n=1992,1993,…,2012; i为像元序号。
图2
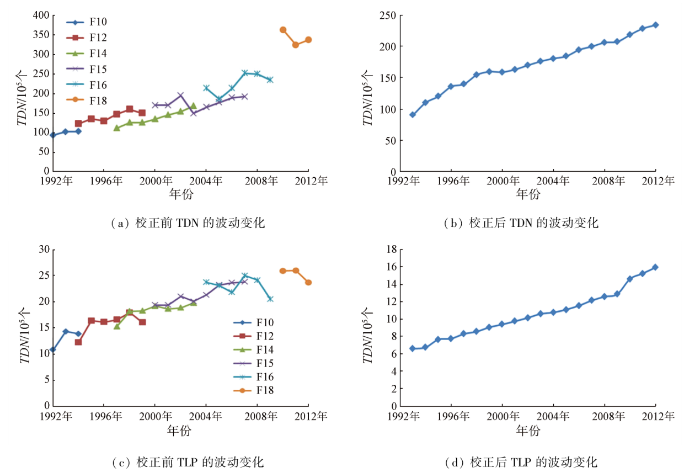
图2
校正前后DMSP/OLS影像的TDN和TLP
Fig.2
TDN and TLP of the nighttime light before and after correction
NPP/VIIRS数据保留了前者的基本特征,空间分辨率提高至500 m,有效地弥补了DMSP/OLS影像的不足,大大地丰富了夜间灯光影像的应用方向和研究领域[21-22]。本研究使用由Elvidge等通过对月均值数据处理得到的全球VIIRS夜间灯光的年度时间序列数据[23](
2)行政区划数据和统计数据。中原城市群行政区范围矢量数据来源于国家地理信息公共服务平台天地图(
3)土地利用数据。土地利用数据来源于中国科学院资源环境科学与数据中心(
2 研究方法
2.1 建成区提取
基于夜光遥感提取建成区的方法主要有4种[24],其中,经验阈值法操作简单但是主观性较强; 较高分辨率影像比较法通过遥感解译高分辨率遥感影像提取建成区,数据量大、处理步骤繁琐、难度较高; 突变检测法利用建成区边界周长的突变点来确定阈值,从而提取城市建成区,该方法数据处理比较繁琐,不具有普适性,且NPP/VIIRS数据的传感器更灵敏、DN值连续性好取值范围也更广泛,实验证明部分城市并没有明显的突变点; 基于统计数据比较法以权威机构发布的统计年鉴数据为参考,通过调整阈值,使提取结果无限接近统计数据从而确定最佳阈值,该方法被认为提取空间范围具有较高的精确度[25]。综上所述,本研究采用基于统计数据比较法来提取中原城市群建成区范围,计算公式为:
式中:
为了验证建成区提取的精度,在基于夜间灯光数据提取的建成区和非建成区,分别随机抽取1 000个样本点,然后以Landsat TM影像解译得到的建成区作为验证数据[26],对1995—2018年夜间灯光数据提取的结果做精度验证,得到总体评估精度分别为82%,85%,86%,82%,83%和81%,总体精度较高,可以根据该建成区提取结果进行分析研究。
2.2 扩张速度与扩张强度
本研究的城市扩张规模分析从扩张速度、扩张强度2个指标入手。前者表示城市扩张的快慢,是一段时间内,建成区面积增量与基础建成区面积的比值; 后者代表城市扩张的强弱,是建成区面积增量与基础城市面积的比值,计算公式为:
式中: SP为扩张速度; ST为扩张强度;
2.3 扩张类型
城市扩张类型主要分为边缘式、填充式和飞地式3类,分类依据是新增建成区相较于已有建成区的相对位置,边缘式是新增建成区位于已有建成区的边缘部位,填充式位于内部,飞地式是脱离已有建成区独立发展。这3种扩张类型是基于景观扩张指数(landscape expansion index, LEI)划分的,飞地式LEI = 0,边缘式0 <LEI≤0.5,填充式0.5 <LEI ≤1。LEI是根据原有建成区和扩张建成区的空间相对位置关系来表达城市扩张的类型,是一种区别于反映城市建成区时间序列特征的空间特征表达方式,能够直观地表现建成区的空间扩张过程,计算公式为:
式中: L为原有建成区和扩张建成区边缘相交长度; P为扩张建成区的总周长。
2.4 标准差椭圆
标准差椭圆方法基于研究对象的空间位置、空间结构等特征,从全局的角度揭示研究对象空间分布的集中程度、中心型、方向性、形态及其随时间的演变特征。标准差椭圆的重心为中原城市群建成区的重心,椭圆的长轴方向表示建成区扩张的主要趋势方向,短轴方向为次要趋势方向,城市建成区空间分布的集中程度则由椭圆的面积表示。
2.5 热点分析
统计学中常用热点分析获取热点和冷点的空间聚类,计算公式为:
式中:
2.6 灰色关联度
本文选取灰色关联分析法[27]进行城市扩张驱动力分析。该方法利用各作用因子与参考因子之间的灰色关联度来表征不同驱动因子对城市扩张的影响。分析步骤如下:
1)设置城市建成区增量为参考序列,设置驱动因子增量为比较序列,公式为:
式中: n为中原城市群的数量,值为30; m为驱动指标的个数,值为11。当i=0时,Xi为参考变量; 当i=1, 2, …, m时,Xi为比较变量。
2)采用初值法对变量进行无量纲化处理,计算公式为:
3)计算差序列,选取最大值和最小值,公式为:
式中:
4)计算关联系数,计算公式为:
式中:
5)计算灰色关联度,公式为:
式中R0i为对比序列和参考序列间的灰色关联度。灰色关联度越大,证明驱动因子和建成区的关系越紧密。
3 结果与分析
3.1 中原城市群城市扩张的时空演变特征
3.1.1 城市扩张空间形态
如图3(a)所示,中原城市群在1993—2018年近25 a间持续扩张,以2010年为分界点,扩张模式由面状扩张向多中心的点状扩张和沿主要交通线路的线状扩张转变。第一个阶段是1993—2010年,主要以面状扩张为主要趋势,即以各城市中心城区为中心,以不规则圈层向外扩张,此阶段大多数城市仅有1~2个中心城区,2000年以前城市扩张缓慢,2000年以后城市扩张显著加强。郑州市向北和向东的扩张更为明显; 郑州市的外围邻接城市中,洛阳市持续向南扩张,开封市、焦作市、济源市和许昌市呈现出“向郑州扩张”的趋势。第二个阶段是2010—2018年,圈层式扩张模式逐渐收敛,多中心的点状扩张模式逐渐显现,沿主要交通线路线状扩展的趋势明显。如图3(b)所示,郑州市建成区总面积以及城市扩张规模均远大于其他城市。以郑州市为中心,由东北至西南方向上的城市以及邯郸、蚌埠和阜阳的建成区面积总量及变化明显,其余城市的建成区规模及增量处于较低水平。总体上,城市群扩张面积呈现出“中间大、两边小”的分布格局。
图3

图3
中原城市群建成区扩张空间演变
Fig.3
Spatial evolution of Central Plains urban agglomeration in built-up range and area
3.1.2 城市扩张类型分析
图4

图4
中原城市群建成区扩张类型
Fig.4
Types of built-up area expansion in the Central Plains urban agglomeration
图5

图5
中原城市群各城市建成区扩张类型面积统计
Fig.5
Statistics on the expansion types of built-up areas in the Zhongyuan urban agglomeration
3.1.3 城市扩张强度和扩张速度的时间演变特征
如图6所示,从城市群整体来看,扩张速度和扩张强度均为正且大体呈“W”型波动式变化,在2000—2005年阶段扩张速度达到峰值,2005年前扩张面积增量持续增长,2005年以后进入稳步增长阶段。1993—2000年阶段,我国处于计划经济逐步向市场经济转型时期,受国家政策影响,城市化驱动力没有完全被激发,城市扩建活力较低,因此城市扩张速度和扩张强度普遍较低。2000—2005年阶段,工业化带动城市化迅速发展,城市建设用地高速扩张,扩张速度和扩张面积增量在该阶段达到峰值,分别是9 km2/a和561 km2。2005—2015年阶段,扩张强度和扩张面积增量进入稳定发展阶段,扩张速度有所放缓。2015—2018年阶段,中原城市群城市建设迎来了快速发展“第二春”,得益于《中原城市群发展规划》,城镇化建设进入新的快速发展阶段。
图6
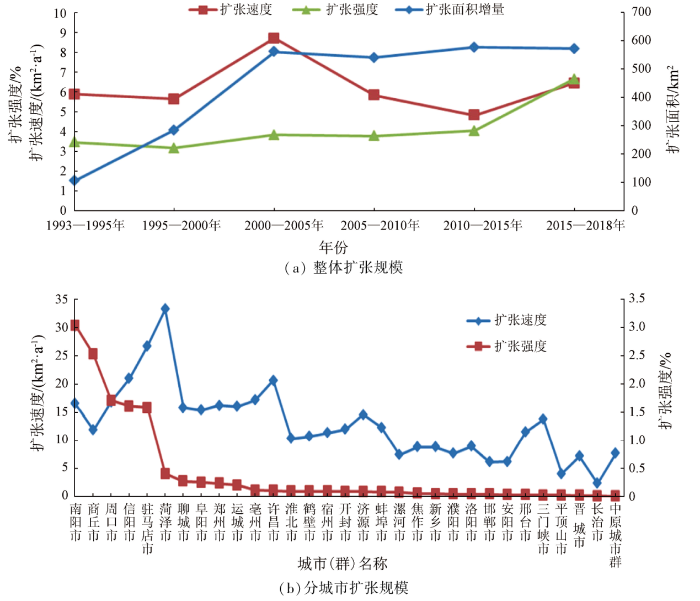
图6
中原城市群整体、分城市的扩张规模
Fig.6
Expansion scale of Central Plains urban agglomeration as a whole and sub cities
分城市来看,不同城市的扩张速度具有显著差异,大部分城市的扩张强度较低,不同城市扩张强度两级分化严重。菏泽市、驻马店市、信阳市和许昌市扩张速度最快,均超过20 km2/a,扩张速度最慢的是平顶山市和长治市,低于5 km2/a。中原城市群各城市普遍扩张强度不高,值得注意的是,中原城市群各城市中,扩张强度最强的南阳市、商丘市、周口市、信阳市和驻马店市,和扩张强度最弱的邢台市、三门峡市、平顶山市、晋城市、长治市,这2个扩张强度极端城市的建成区面积占城市总面积的比重均是最低的,反而扩张强度中等城市的比重较高,可见,中原城市群不同城市之间扩张强度的两极分化十分严重。
3.1.4 建成区重心与扩张方向的时空迁移特征
如图7所示,研究期内建成区重心经历了“西南-东北-东北-西-西北-东南”的变动过程,重心在郑州市和开封市之间“徘徊游走”。标准差椭圆的面积经历了“减小-增大-减小”的过程,表明中原城市群建成区的空间分布经历了“集中-分散-集中”的演变过程,椭圆面积在2005年达到最大值140 705 km2,表明建成区在2005年分散程度最大。建成区重心变动大致可以分为5个阶段: 1993—1995年阶段,重心在郑州市中牟县内向西南方向移动,移动距离11.63 km,椭圆面积缩小了8 000 km2,空间上呈收缩的趋势; 1995—2005年阶段,重心向东北方向移动,由郑州市移动至开封市龙亭区,移动距离30.55 km,该阶段重心移动最远,椭圆面积增加了25 700 km2,空间上呈扩张趋势; 2005—2010年阶段,重心在开封市龙亭区内向西移动,移动距离为7.94 km,椭圆面积减小了6 100 km2,空间上呈收缩趋势; 2010—2015年阶段,重心由开封市龙亭区向西北移动至郑州市中牟县,移动距离15.53 km,椭圆面积缩小了8 500 km2,空间上呈收缩趋势; 2015—2018年阶段,重心由郑州市中牟县向东南方向移动至开封市祥符区,移动距离19.02 km,该阶段重心移动较远,椭圆面积变化不大。每个时期标准差椭圆的长轴方向都是“东南-西北”方向,说明中原城市群建成区在7个时期均呈“东南-西北”的空间分布格局,“东北-西南”方向的发展强度略低。
图7
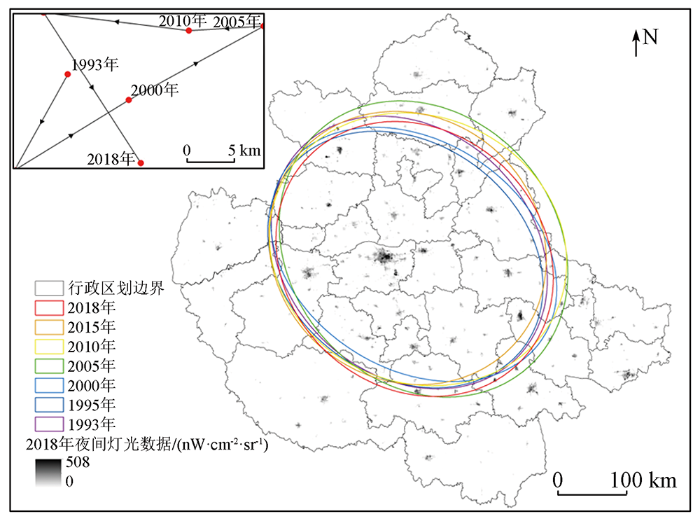
图7
中原城市群标准差椭圆及其重心变动
Fig.7
Standard deviation ellipse and its center of gravity change in Central Plains urban agglomeration
3.1.5 建成区热点分析
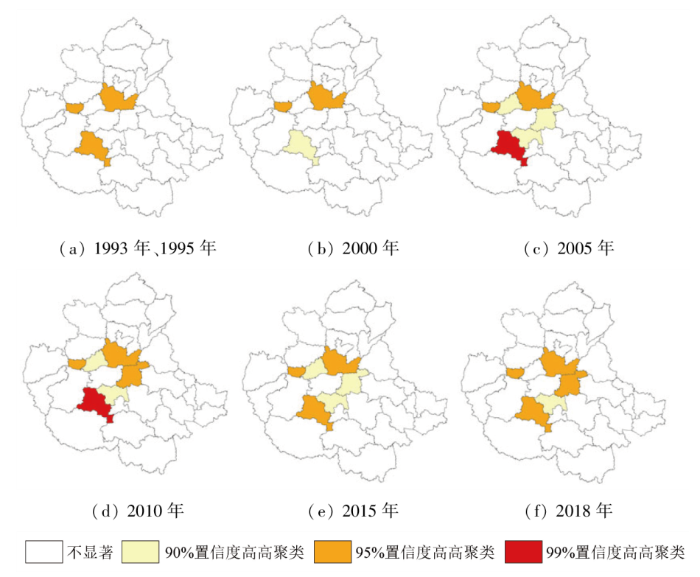
热点分析的结果显示郑州市外围邻接城市“高高聚类”趋势增强,群体发展优势突出。结果如图8所示,大部分城市热点分析的结果是不显著,邻近郑州市外围圈层的城市呈“高高聚类”,且随着时间的推移,该高高聚类包括的城市沿郑州市外围增加,2005年之前仅新乡市、济源市、平顶山市表现出置信度为90%或95%的高高聚类,2010年以后又增加了焦作市、开封市和许昌市,到了2018年焦作市高高聚类不再显著。结果表明,郑州市外围圈层城市城市化发展有“抱团取暖”的趋势,城市群的群体发展优势在郑州外围圈层城市首先显现。
图8
3.2 中原城市群城市扩张的驱动力分析
表1 城市扩张驱动因素及指标选取
Tab.1
| 驱动因素 | 驱动指标 |
|---|---|
| 经济因素 | GDP(X1) |
| 一般预算收入(X2) | |
| 实际利用外资额(X3) | |
| 固定资产投资(X4) | |
| 第二产业占比(X5) | |
| 第三产业占比(X6) | |
| 社会因素 | 年末总人口(X7) |
| 人口密度(X8) | |
| 教育支出(X9) | |
| 交通因素 | 客运量(X10) |
| 环境因素 | 建成区绿化覆盖率(X11) |
表2 城市扩张驱动因素灰色关联度
Tab.2
| 驱动力因素 | 灰色关联度 |
|---|---|
| 一般公共预算收入(X2) | 0.92 |
| GDP(X1) | 0.90 |
| 实际利用外资额(X3) | 0.89 |
| 教育支出(X9) | 0.88 |
| 人口密度(X8) | 0.84 |
| 年末总人口(X7) | 0.83 |
| 客运量(X10) | 0.81 |
| 第二产业占比(X5) | 0.80 |
| 第三产业占比(X6) | 0.76 |
| 固定资产投资(X4) | 0.70 |
| 建成区绿化覆盖率(X11) | 0.60 |
1)经济因素。城市扩张的过程与城市经济发展状况密切相关。一般公共预算收入、GDP和实际利用外资额是经济层面的重要指标,同时也是与城市扩张关联最高的3项指标。一般公共预算收入是地方财政收入的重要组成部分,和GDP 能够直观地反映地方的经济发展和财政状况。经济的良好快速发展对城市扩张具有极大的推动作用[29]。随着经济全球化进程的加深,地方政府通过吸引外资设立企业,带动了经济增长并促进了城市建设用地的扩张; 第二、第三产业占比和固定资产投资在经济因素中与城市建成区的相关度排序较低,但数值均在0.70以上,表明其对中原城市群的扩张仍起到良好的推动作用。固定资产投资的规模、比例、使用方向等均对城市扩张有显著影响,尤其是固定资产在房产、建筑等方面的投资直接影响了城市扩张的规模和速度,同时大量社会资本的流通,使得经济集聚并通过市场转换来推动城市空间扩张。一方面,第二、三产业的大力发展,提供了更多就业机会,吸引人口聚集,促进了城市住房、基础设施的建设和完善,同时推动了经济互动从农村向城市转移,为城市扩张提供动力; 另一方面,产业结构升级调整,促使产业不断向郊区和次发达城市延伸,推动土地向外扩张。
2)社会因素。城市扩张的过程是城市土地与人口相适应的过程。人口增长是城市扩张的直接动力,人口规模的增长扩大了对住房的需求,同时对超市、医院、公园绿地、道路等基础设施的需求也随之增加。同时丰富的教育资源也有助于城市培养和吸引人才,增加人口流动,因此教育支出与城市扩张具有很高的相关度。
3)交通因素。2010年后,中原城市群沿主要交通线路线状扩展的趋势明显。客运量的关联度超过了0.80,证明了交通通达度和便利度很大程度上推动了城市的发展。中原城市群具有优越且便利的交通条件,具有排名前列的高速公路通车里程、快速联通全球的国际机场和连接全国的“米”字形高速铁路网。现代综合交通枢纽格局的加速形成、立体综合交通网络的不断完善促进了人口和生产要素的流动,也进一步推动了城市群的扩张进程。
4)环境因素。居住环境的改善有助于吸引人口向城市转移,进而促进城市建成区的扩张。本文中,建成区绿化覆盖率与城市建成区的相关度为0.60,处于中等较低水平。说明环境因素和城市扩张的关联性相对较低,环境发展水平与城市扩张强度不匹配。中原城市群在进行建设的同时,需要加强环保和绿化建设,积极打造生态文明,建立和谐、绿色、宜居的新型城市群。
4 结论
本研究基于2种夜间灯光影像提取了中原城市群建成区范围,采用扩张速度、扩张强度、扩张类型、标准差椭圆、热点分析等指标和方法,从群整体和地市2个尺度出发,对1993—2018年长时间序列中原城市群城市扩张的时空演变特征进行了系统分析,并在此基础上构建模型,研究了城市扩张的驱动力,得出以下几点结论:
1)空间上,以郑州市为中心,东北至西南方向为参考,各城市建成区面积及扩张规模总体上呈现 “中间大、两边小”的分布格局,扩张类型以边缘式和飞地式为主。空间演变以2010年为分界点,第一个阶段以不规则圈层向外扩张的面状扩张模式为主,开封、焦作、济源、许昌呈现出“向郑州扩张”的趋势; 第二个阶段多中心的点状扩张模式逐渐显现,沿主要交通线路线状扩展的趋势明显。
2)时间上,建成区面积呈稳步上升趋势,不同城市间扩张面积、扩张速度、扩张强度差异显著,扩张速度和扩张强度均为正且大体呈“W”型波动式变化,在2000—2005年阶段扩张速度达到峰值,2005年前扩张面积增量持续增长,2005年以后进入稳步增长阶段。郑州市外围邻接城市“高高聚类”趋势增强,群体发展优势突出。
3)重心演变上,经历了“西南-东北-东北-西-西北-东南”的变动过程,重心在郑州市和开封市之间“徘徊游走”,“东南-西北”方向的发展强度略高于“东北-西南”方向。中原城市群建成区的空间分布经历了“集中-分散-集中”的演变过程,建成区在2005年分散程度最大。
4)驱动机制上,城市群扩张的主要驱动力来源于经济因素,其次是社会、交通和环境因素。对城市扩张影响前5的驱动指标依次为一般公共预算收入、GDP、实际利用外资额、教育支出和人口密度。
参考文献
Building in or out? Examining urban expansion patterns and land use efficiency across the global sample of 466 cities with million+ inhabitants
[J].DOI:10.1016/j.habitatint.2021.102503 URL [本文引用: 1]
District-based urban expansion monitoring using multitemporal satellite data:Application in two mega cities
[J].DOI:10.1007/s10661-021-09657-z [本文引用: 1]
1992—2016年京津冀城市群城市扩展过程和驱动分析
[J].
Urban expansion in Beijing-Tianjin-Hebei urban agglomeration from 1992 to 2016:The process and driving forces
[J].
城市群城市用地扩张时空特征及驱动机制研究——以长株潭城市群为例
[J].
Study of spatio-temporal pattern and driving mechanism of urban land expansion in urban agglomeration:A case study of the Changsha-Zhuzhou-Xiangtan urban agglomeration
[J].
城市扩张程度的影响因素分析——以武汉市为例
[J].
Analysis of the factors affecting the degree of urban expansion:Taking Wuhan city as an example
[J].
长株潭都市圈建设用地增长格局及驱动因素研究
[J/OL].
Research on the growth pattern and driving factors of construction land in CZT metropolitan area
[J/OL].
基于地理探测器的乌鲁木齐城市扩张特征与时空驱动因素分析
[J].
Urban expansion and its temporal and spatial driving forces of Urumqi based on geo-detector method
[J].
Impacts of urban expansion on the urban thermal environment:A case study of Changchun,China
[J].DOI:10.1007/s11769-021-1251-3 [本文引用: 1]
Impacts of urban expansion on the loss and fragmentation of cropland in the major grain production areas of China
[J].
DOI:10.3390/land11010130
URL
[本文引用: 1]

The continuous expansion of urban land has led to massive encroachment upon cropland. To examine the impacts of urban expansion on the loss and fragmentation of cropland in China’s nine major grain production areas (MGPAs), we used standard deviation ellipse, land use transfer matrix, land use dynamic degree, and landscape metric to explore the spatio-temporal evolutions, mutual transfer, and landscape patterns of cropland and urban land. The results show the following: (1) From 1995 to 2018, the areas of cropland in MGPAs showed a trend of “short-term increase—long-term decrease—short-term increase”, while that of urban land grew continuously; (2) Urban expansion is the main cause of cropland loss. The cropland area converted to urban land accounts for a large proportion (49.26%) of the total transfer of cropland to other land types, especially in the densely populated, rapidly urbanizing and industrializing Taihu Lake Plain, Jianghuai Region, and Pearl River Delta; (3) In most MGPAs, urban expansion has led to fragmentation of cropland, especially in the Pearl River Delta, as indicated by the significant change of patch density. However, in the Sanjiang Plain and Songnen Plain, a less pronounced or even reduced cropland fragmentation was observed due to the significant conversion of other land types to cropland under specific land policies. From these results, we suggest that the government should regulate the encroachment of urban land on cropland and the transfer of natural land to it, and encourage the rural land consolidation to increase the cropland.
基于夜间灯光影像数据的黄河流域中心城市建成区空间扩展及动力因子分析
[J].
DOI:10.7522/j.issn.1000-694X.2021.00126
[本文引用: 1]
研究黄河流域建成区扩展特征有助于透视用地开发效果和践行中心城市高质量发展规划。基于1992、1997、2002、2007、2012、2018年6期夜间灯光影像与统计数据,提取建成区范围,采用扩展强度指数、紧凑度指数、协调发展系数与灰色关联分析,探究1992—2018年黄河流域8个中心城市扩展的时空格局、质量及动力因子。结果表明:(1)黄河流域中心城市建成区面积分化明显,中下游城市扩展规模和强度大,扩展形态呈紧凑度普遍下降趋势。(2)夜间灯光影像数据刻画的西安建成区综合水平高、西宁水平低,银川综合发展快、兰州慢;除西宁、呼和浩特与太原外,其他中心城市平均夜间灯光指数在1997—2018年呈下降趋势,反映城市扩展水平降低。(3)中心城市人口-土地协调发展系数均呈波动下降趋势,除呼和浩特、太原和济南外,人口-土地由基本协调型向土地过快扩展型转变;中心城市经济-土地协调发展系数呈波动下降趋势,经济年均增长率降低,建成区面积年均扩展率增加,基本由经济过快增长型向经济-土地协调发展型转变。(4)中心城市空间扩展主要受经济发展(地区生产总值)影响;从中心城市整体看,全时段(1996—2018年)行政力(固定资产投资)和内源力(人口规模)影响作用较大,分时段(1996—2002年、2002—2012年与2012—2018年)行政力影响系数亦较高,市场力(社会消费品零售总额)与外向力(实际利用外资额)影响作用程度随时间增加明显。新时期黄河流域中心城市空间扩展应注重内部提质增效,提高建设用地利用效率,促进城市高质量发展。
Study on spatial expansion and dynamic factors of built-up area of central cities in the Yellow River Basin based on night-time light data
[J].
Can urban sprawl be the cause of environmental deterioration? Based on the provincial panel data in China
[J].DOI:10.1016/j.envres.2020.109954 URL [本文引用: 1]
Monitoring regional urban dynamics using DMSP/OLS nighttime light data in Zhejiang Province
[J].
Detecting the dynamics of urban growth in Africa using DMSP/OLS nighttime light data
[J].
DOI:10.3390/land10010013
URL
[本文引用: 1]
Africa has been experiencing a rapid urbanization process, which may lead to an increase in unsustainable land use and urban poverty. Assessing the spatiotemporal characteristics of urbanization dynamics is especially important and needed for the sustainable development of Africa. Satellite-based nighttime light (NTL) data are widely used to monitor the dynamics of urban growth from global to local scales. In this study, urban growth patterns across Africa were analyzed and discussed using stable nighttime light datasets obtained from DMSP/OLS (the Defense Meteorological Satellite Program’s Operational Line-scan System) spanning from 1992 to 2013. We partitioned the nighttime lighting areas into three types (low, medium, and high) using thresholds derived from the Brightness Gradient (BG) method. Our results indicated that built-up areas in Africa have increased rapidly, particularly those areas with low nighttime lighting types. Countries with higher urbanization levels in Africa, like South Africa, Algeria, Egypt, Nigeria, and Libya, were leading the brightening trend. The distribution of nighttime lighting types was consistent with the characteristics of urban development, with high nighttime lighting types showed up at the urban center, whereas medium and low nighttime lighting types appeared in the urban-rural transition zone and rural areas respectively. The impacts of these findings on the future of African cities will be further proposed.
Spatio-temporal evolution and driving mechanism of urbanization in small cities:Case study from Guangxi
[J].
DOI:10.3390/land11030415
URL
[本文引用: 1]
Urbanization has an abundant connotation in dimensions such as population, economy, land, and society and is an important sign to measure regional economic development and social progress. The use of Night Light Data from remote sensing satellites as a proxy variable can significantly improve the accuracy and comprehensiveness of the measurement of urbanization development dynamics. Based on the Night Light Data and statistical data from 2015 to 2019, this paper quantitatively analyzes the spatio-temporal evolution pattern of urbanization in Guangxi and its driving mechanism using exploratory time-space data analysis, GeoDetector and Matrix: Boston Consulting Group, providing an important basis for sustainable urban development planning and scientific decision-making by the government. The findings show that (1) there is a high level of spatial heterogeneity and spatial autocorrelation of urbanization in Guangxi, with the Gini index of urban night light index and urban night light expansion vitality index always greater than 0.5, the global Moran’s I greater than 0.17, the spatial differentiation converging but the spatial correlation increasing. (2) The spatial pattern of urbanization in Guangxi has long been solidified, but there is a differentiation in urban development trend, with the coexistence of urban expansion and shrinkage, requiring differentiated policy design for urban governance. (3) The development and evolution of urbanization in Guangxi present a complex intertwined dynamic mechanism of action, with interaction effects of bifactor enhancement and non-linear enhancement among factors. It should be noted that the influence of factors varies greatly, with the added value of the tertiary industry, gross domestic product, total retail sales of social consumer goods having the strongest direct effect on the urban night light index, while the added value of secondary industry, per capita GDP, gross domestic product having the strongest direct effect on the urban night light expansion vitality index. All of them are key factors, followed by some significant influence factors such as government revenue, population urbanization rate, per government revenue, population urbanization rate, per capita disposable income of urban and rural residents that should not be ignored, and the rest that play indirect roles mainly by interaction.
Study on urban spatial pattern based on DMSP/OLS and NPP/VIIRS in Democratic People’s Republic of Korea
[J].
DOI:10.3390/rs13234879
URL
[本文引用: 1]
In recent years, much attention has been given to the current situation and trend regarding economic development in the Democratic People’s Republic of Korea (DPRK), of which urbanization is an important indicator. In the present study, (i) the urbanized area is estimated using DMSP/OLS and NPP/VIIRS, (ii) the current spatial pattern and the change characteristics of typical cities are revealed, and (iii) the scale and developmental stage of major cities in the DPRK are judged through comparison. Although the DPRK is relatively closed, the financial crisis in 2008 indirectly affected its economic development, and a large gap remains between the urbanization level of the DPRK and that of China and the Republic of Korea. The large cities in the DPRK are located mainly in its eastern coastal areas and western plains, and there has been no significant expansion in Pyongyang, Chungjin, and Hamhung in the past 28 years. Although economic construction has begun again recently in the DPRK, further reform and opening are required. As the DPRK’s relations with its neighbors and countries around the world improve, its economic development and urban construction will present a new pattern.
基于夜光数据的滇中城市建成区动态监测与时空格局演变
[J].
Dynamic monitoring and spatial-temporal pattern evolution of buil-up areas in central Yunnan based on nighttime light data
[J].
国家发展改革委关于印发中原城市群发展规划的通知
[EB/OL].(
Notice of the National Development and Reform Commission on issuing the development plan for the Central Plains urban agglomeration
[EB/OL].(
丝绸之路经济带建设中的我国节点城市产业定位与协同发展研究
[J].
A study on the industry positioning and synergetic development of the node cities of China on the Silk-Road Economic Belt
[J].
Extracting the dynamics of urban expansion in China using DMSP-OLS nighttime light data from 1992 to 2008
[J].DOI:10.1016/j.landurbplan.2012.02.013 URL [本文引用: 1]
基于2种夜间灯光影像亮度修正指数的城市建成区提取研究
[J].
DOI:10.12082/dqxxkx.2020.200128
[本文引用: 1]
夜间灯光影像容易受到道路灯光、水面散射等影响而产生背景噪声,这一定程度上影响了利用夜间灯光数据提取建成区的精度。本文基于夜间灯光影像的DN(Digital Number)值与路网密度正相关、与EVI指数(Enhanced Vegetation Index,增强型植被指数)呈负相关的规律,提出了2种可用于建成区提取的夜间灯光亮度修正指数:EVI夜间灯光亮度修正指数EANI (EVI Adjusted Nighttime Light(NTL) Index)和基于道路网密度与EVI指数的夜间灯光亮度修正指数REANI (Road Density & EVI Adjusted NTL Index),并利用珞珈1号卫星(LJ1-01,分辨率约130 m)影像和NPP-VIIRS影像(分辨率约 500 m) 2种不同空间分辨率夜间灯光遥感影像进行验证。以2018年徐州市建成区为研究对象,分区域(主城区、外围区)利用阈值法对2种原始夜间灯光影像、经EANI指数和REANI指数处理后的影像进行建成区提取,得到6种建成区提取的结果。研究表明: ① EANI指数和REANI指数能够有效抑制夜间灯光影像的背景噪声,建成区提取的结果均优于直接利用原始影像的结果,特别是对于城市化水平较低地区的建成区提取效果更佳;② 相较于NPP-VIIRS影像,利用LJ1-01影像提取建成区的效果提高6%左右,说明我国的LJ1-01夜间灯光影像在建成区提取方面有广阔的应用前景。EANI和REANI为建成区提取提供了有效工具,并可应用于城市规划和城市扩张等研究领域。
Research on built-up area extraction via brightness correction indexes based on two kinds of nighttime light images
[J].
夜间灯光遥感数据应用综述和展望
[J].
DOI:10.18306/dlkxjz.2019.02.005
[本文引用: 1]
在遥感应用研究中,夜间灯光遥感作为发展活跃的一个重要分支,近年来受到越来越多来自自然科学领域和社会经济领域的关注。与传统的光学遥感卫星获取地物辐射信息不同,夜间灯光遥感是获取夜间无云条件下地表发射的可见光-近红外电磁波信息。相比于普通的遥感卫星影像,夜间灯光遥感所使用的夜间灯光影像记录的地表灯光强度信息更直接反映人类活动差异,因而被广泛应用于城市化进程研究、不透水面提取、社会经济指标空间化估算、重大事件评估、生态环境评估等领域。目前,虽然基于夜间灯光数据的应用研究成果正在不断积累,但对成果的系统性总结、整理的研究目前存在着覆盖面不全、时效性不强等不足。基于此,论文通过对近几十年来有关夜间灯光数据的研究成果的详细梳理,从数据处理与技术方法、应用研究等方面进行归纳总结。最后,文章从多源数据融合、应用领域拓展和短周期地表灯光监测3个方面指出了未来的研究热点。
Review and prospect of application of nighttime light remote sensing data
[J].
DOI:10.18306/dlkxjz.2019.02.005
[本文引用: 1]
In remote sensing research, night light remote sensing as an important branch of active development has attracted increasingly more attention from the fields of natural and social science research in recent decades. Different from traditional daytime optical satellite remote sensing that obtains ground object radiation information, nighttime light remote sensing is the acquisition of visible-near-infrared electromagnetic information transmitted from the Earth's surface under cloud-free conditions at night. Compared to the ordinary satellite remote sensing images, ground light intensity information recorded by the night light images directly reflects the difference of human activity. Therefore, it is widely used in urbanization research, extraction of impervious surfaces, estimation of socioeconomic indicators, major events assessment, ecological environment assessment, and other fields. At present, although research results based on nighttime light data are continuously accumulating, there is a general lack of systematic review of these results and the current reviews suffer from incomplete coverage and poor timeliness. Therefore, this article summarizes the research results of nighttime light data in recent decades and examines them from the aspects of data processing and technical approaches, urbanization application research, and parameterization. Finally, we identify the following three research hotspots: multi-source data fusion, application expansion, and short-period surface light monitoring.
Annual time series of global VIIRS nighttime lights derived from monthly averages:2012 to 2019
[J].
DOI:10.3390/rs13050922
URL
[本文引用: 1]
A consistently processed annual global nighttime lights time series (2012–2019) was produced using monthly cloud-free radiance averages made from low light imaging day/night band (DNB) data collected by the NASA/NOAA Visible Infrared Imaging Radiometer Suite (VIIRS). The processing steps are modified from the original methods developed to produce annual nighttime lights products from nightly data. Only two years of VIIRS nighttime lights (VNL) were produced with the V.1 methods: 2015 and 2016. Here we report on methods used to produce a V.2 VNL time series from the monthly averages with filtering to remove extraneous features such as biomass burning, aurora, and background. In this case, outlier removal is achieved with a twelve-month median, which discards high and low radiance outliers, thus isolating the background to a narrow range of radiances under 1 nW/cm2/sr. Background areas with no detectable lighting are further isolated using a statistical measure of texture, 3 × 3 data range (DR). The DR threshold for zeroing out background rises as the number of cloud-free observations falls. The V.2 method extends the temporal leverage in the noise filtering by developing the DR threshold from a multiyear maximum DR and a multiyear percent cloud-free grid. Additional noise filtering is achieved by zeroing out grid cells that have low average radiances (<0.6 nW/cm2/sr) and detection in only one or two years out of eight. The spatial extent and average radiance levels are compared for the V.1 and V.2 2015 VNL. For the vast majority of grid cells, the average radiances are nearly the same in the two products. However, the V.2 product has more areas of dim lighting detected. The key advantages of the V.2 time series include consistent processing and threshold levels across all years, thus optimizing the set for change detection analyses.
基于夜间灯光数据的城市建成区提取方法评价与应用
[J].
Methods for deriving urban built-up area using night-light data:Assessment and application
[J].
基于DMSP-OLS和珞珈一号夜光遥感影像的粤港澳大湾区城市空间格局演变
[J].
DOI:10.13474/j.cnki.11-2246.2021.364
[本文引用: 1]
夜光遥感影像数据可有效反映城市空间格局变化。本文基于1992—2012年的DSMP-OLS夜光遥感影像和2018年的珞珈一号遥感影像,利用分层阈值法提取粤港澳大湾区内各城市建成区;通过计算平均灯光强度、平均灯光增长速率、城市建成区面积、城市建成区增长速率、城市重心、城市重心偏移距离等一系列指数,揭示区内各城市的空间格局演变过程。研究结果表明:①1992—2018年,粤港澳大湾区的城市规模大幅增长,沿珠江口两侧形成了以澳门、广州、深圳和香港为核心的倒“U”形城市群,并呈辐射状向周边扩张。②以珠江口为界,粤港澳大湾区东部各个城市的发展水平整体高于西部各个城市,广州、深圳、香港等核心城市发展水平明显高于江门、肇庆、惠州等外围城市。③1992—2018年,粤港澳大湾区建成区的增长速率由小变大,最后逐渐趋于稳定,2002—2007年是城市扩张最迅猛时期。④1992—2018年,粤港澳大湾区的各城市重心迁移方式表现为3种类型:持续向区域中心迁移;持续向相邻城市邻接区迁移;持续向海洋方向迁移。大部分城市的重心迁移方向呈“震荡”特征。
Evolution of urban spatial pattern of GBA based on DMSP-OLS and LJ-1 nighttime light remote sensing images
[J].
DOI:10.13474/j.cnki.11-2246.2021.364
[本文引用: 1]
Nighttime light remote sensing images can be effectively used to extract evolution of urban spatial pattern. In this paper, the DSMP-OLS nighttime light (NTL) images from 1992 to 2012 and the LJ-1 NTL images in 2018 are used to extract urban built-up areas of Guangdong-Hong Kong-Macao greater bay area (GBA) by applying dynamic threshold method. On this basis, in order to reveal the spatial pattern and urban expansion process of each city in GBA, a number of indicators are used, including average light brightness, growth rate of average light brightness, urban built-up area, growth rate of urban built-up area, urban center of gravity coordinates, and offset distance of urban center of gravity. Finally, we analyze the main driving factors of urban expansion in GBA combined with the national economic statistics. The results show that:① From 1992 to 2018, the urban scale of GBA increased significantly. It forms an inverted "U" shaped urban agglomeration, with Guangzhou, Shenzhen and Hong Kong as the center, expanding outward in a radial manner. ② Taking the Pearl River Estuary as the boundary, the development level of eastern cities is significantly higher than that of western cities. The development level of core cities such as Guangzhou, Shenzhen and Hong Kong were significantly higher than that of peripheral cities such as Jiangmen, Zhaoqing and Huizhou. ③ From 1992 to 2018, the expansion speed of the built-up area in GBA increases from small to large, and then decreased gradually. 2002-2007 was the fastest period of urban expansion. ④ From 1992 to 2018, there were three types of urban center of gravity migration:the center of gravity of periphery cities continued to move to the center of GBA, the center of gravity of central cities moved to the junction of neighboring cities, the center of gravity of special administrative cities is moving towards the ocean. Most cities have "vibration" in their directions of urban gravity movement.
社会经济灰色系统的理论与方法
[J].
Theory and method of socio-economic grey system
[J].
城市用地扩张的时空格局特征及驱动因素分析——以中原城市群为例
[J].
Analysis of spatial-temporal pattern characteristics and driving factors of urban land expansion:Taking central plains city cluster as an example
[J].
中国城市建设用地扩张与财政收入增长的面板格兰杰因果检验
[J].
DOI:10.11821/dlxb201312001
[本文引用: 1]
土地开发已成为当前研究的一个焦点,但是对“土地财政”现象的研究仍集中在其形成机制方面,而很少证实土地是否及如何推动了地方财政收入的增长。为此,本文基于《城市统计年鉴》(1985-2011) 的面板数据,构建面板误差修正模型和随机效应模型,运用格兰杰因果检验探讨城市建设用地扩张与城市财政收入增长之间的因果关系,并对“土地财政”的影响机制、区域差异和开发效率进行初步探讨。结果显示,从1995 年开始,中国城市的土地开发是推动其地方财政收入增长的格兰杰原因。但是这种效应主要为即期的影响,而对房地产开发和工业增值税的长期推动效果不太显著,这暗示了土地财政在中国有过度的倾向。从区域差异来看,土地开发对地方财政收入的推动幅度在中西部地区或在100 万人口以上的超大城市更大,且随城市规模的增加其影响效果更为显著。
Panel Granger Test on urban land expansion and fiscal revenue growth in China’s prefecture-level cities
[J].
